


Customer Lifetime Value (LTV): How to Calculate It and Why Attribution Makes the Number Wrong
The biggest scaling mistake I see is businesses obsessing over acquisition cost while having no idea what a customer is actually worth. You can’t bid intelligently on ads if you don’t know LTV. You can’t know if a $300 CAC is profitable or catastrophic without it. LTV is the number that tells you how much you can afford to spend, and most businesses either don’t calculate it or calculate it wrong. Customer lifetime value is the total revenue a customer generates across their entire relationship with your business. It is the other half of the unit economics equation. Without an accurate LTV, you cannot set a sustainable customer acquisition cost target. Without a sustainable CAC target, you cannot scale. This guide walks through the LTV formulas, shows how to calculate it by segment, explains why most businesses get the number wrong, and connects LTV directly to the attribution problem that distorts every metric downstream.
TL;DR
- LTV = Average Revenue Per Customer x Gross Margin x Average Customer Lifespan. For subscriptions: LTV = ARPU x Gross Margin % / Monthly Churn Rate. A SaaS company with $200 ARPU, 75% margin, and 3% churn has an LTV of $5,000. An ecommerce brand with $75 AOV, 50% margin, 3 purchases/year, and 2.5-year lifespan has an LTV of $281.
- The sustainability benchmark is an LTV:CAC ratio of at least 3:1. Top-quartile SaaS companies maintain 4:1 to 6:1. But ratios are only meaningful if both numbers are accurate. Bad attribution distorts CAC, which breaks the ratio even when LTV is correct. Per Genesys Growth, 82% of SaaS companies calculate LTV but less than 50% measure LTV:CAC.
- Attribution accuracy determines which customers you count and what your cohort data looks like. If attribution misses 30% of conversions, tracked customers are a biased sample skewed toward bottom-of-funnel buyers. Your LTV based on that sample may not represent your actual base. Hyros tracks the full journey across channels and devices, building LTV on complete data.
What Is Customer Lifetime Value?

Customer lifetime value (LTV, also called CLV or CLTV) is the total net revenue a business expects to earn from a single customer account across the entire duration of their relationship. It represents the economic value of acquiring and retaining a customer, expressed in dollars.
LTV answers a simple question: how much is a customer worth? That answer determines nearly every financial decision in a growth-stage business. It sets the ceiling for customer acquisition cost. It justifies (or kills) expansion into new channels. It defines the break-even point for each cohort of customers. It tells investors whether the business model is sustainable.
The concept originated in direct-response marketing in the 1980s, when catalog companies like L.L.Bean and Lands’ End realized that the value of a customer was not in the first order but in the twentieth. That same principle applies to every business model today: the ecommerce brand where repeat purchases drive profitability, the SaaS company where retention compounds monthly recurring revenue, and the coaching business where upsells and referrals multiply the initial sale.
Despite its importance, only 25% of marketers rank LTV among their top five metrics, according to marketing metrics research cited by Genesys Growth. Most teams optimize for front-end metrics (cost per click, cost per lead, first-purchase ROAS) while the number that actually determines profitability sits uncalculated or miscalculated in a spreadsheet nobody reviews.
For the other half of the unit economics equation, see our guide on how to calculate customer acquisition cost.
How Do You Calculate LTV Step by Step?

There are three standard approaches to calculating LTV, each suited to different business models and data availability levels.
Formula 1: Historical LTV (Simplest)
LTV = Average Revenue Per Customer x Gross Margin % x Average Customer Lifespan
This formula uses actual historical data from your existing customer base.
Step 1: Calculate Average Revenue Per Customer
For ecommerce: Average Order Value (AOV) x Average Purchase Frequency per year.
For SaaS: Annual Recurring Revenue (ARR) per customer, or Monthly Recurring Revenue (MRR) x 12.
For services: Average contract value per engagement period.
Step 2: Apply Gross Margin
Multiply revenue by your gross margin percentage. LTV should reflect profit contribution, not gross revenue. A $100 order with 40% gross margin contributes $40 toward covering acquisition costs and generating profit.
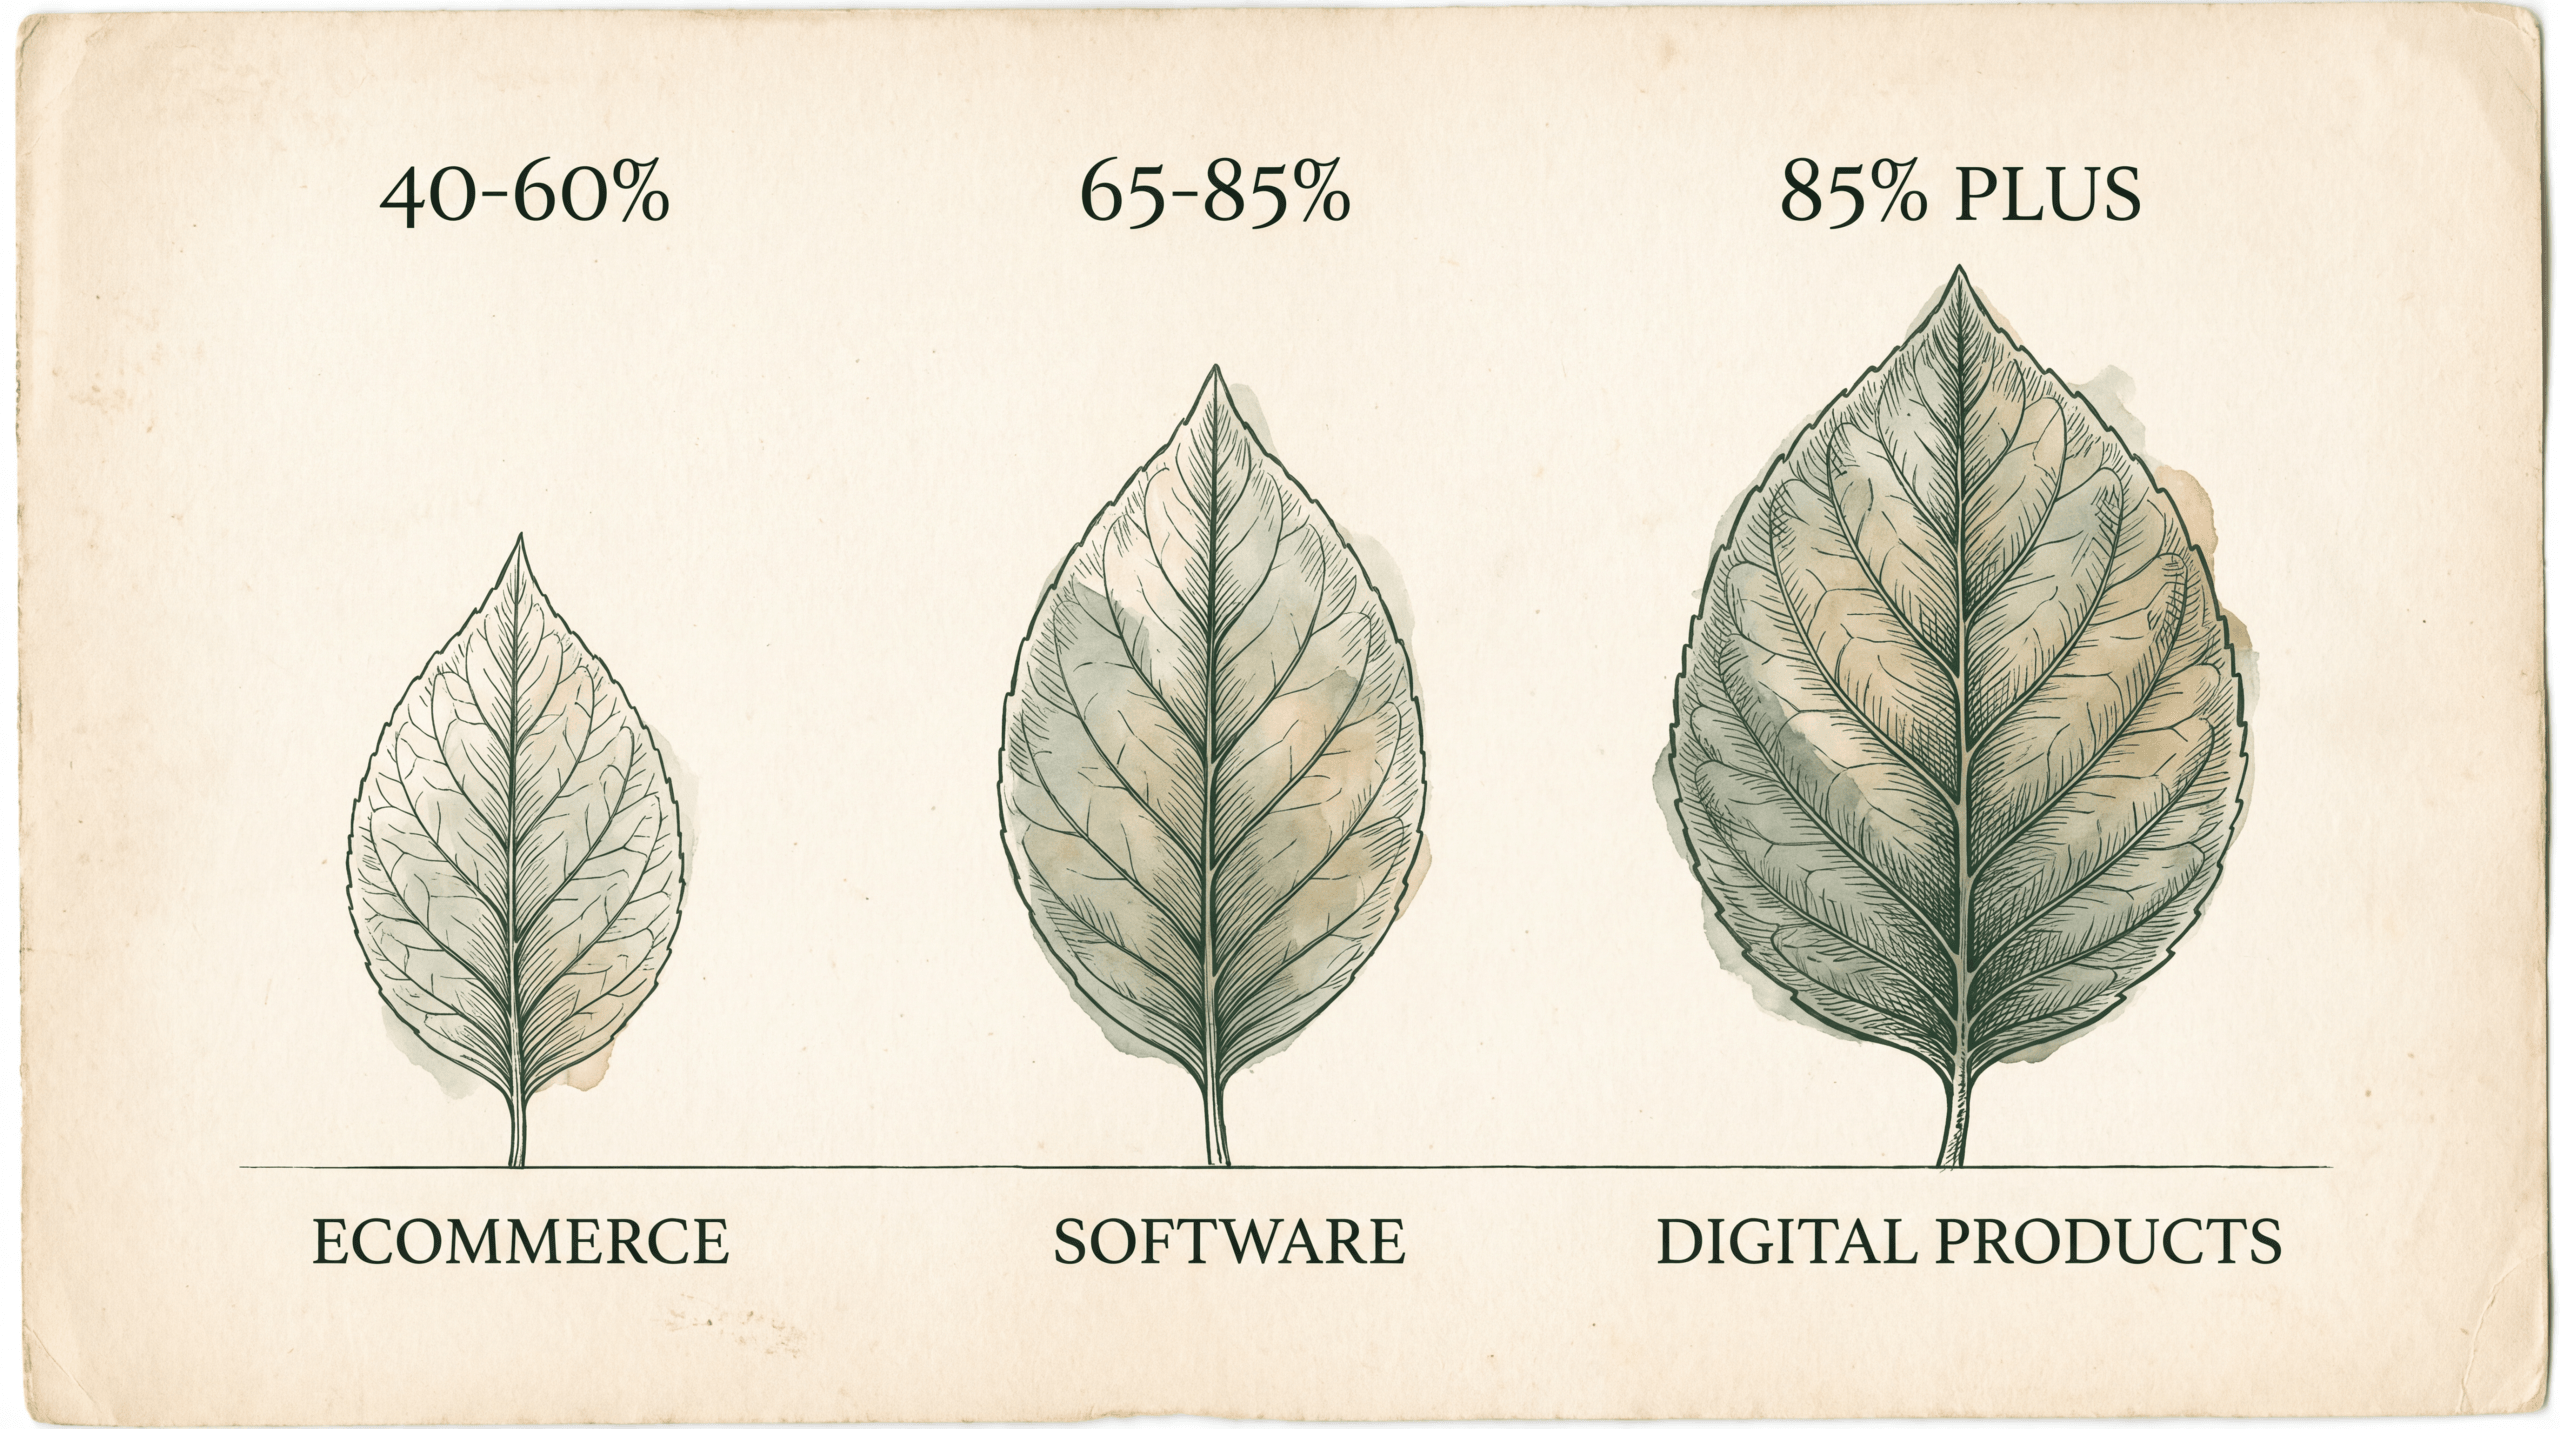
Most ecommerce brands operate at 40-60% gross margins. SaaS companies typically run 65-85% gross margins, with the median for healthy SaaS businesses at around 75%. Info-product and digital course businesses often exceed 85% because the marginal cost of serving an additional customer is near zero.
Step 3: Multiply by Average Customer Lifespan
How long does the average customer stay active? For subscription businesses, this is the inverse of churn rate (1 / churn rate). For ecommerce, estimate the number of years between first and last purchase.
Example: DTC Ecommerce Brand
– Average Order Value: $75
– Purchase Frequency: 3x per year
– Annual Revenue Per Customer: $225
– Gross Margin: 50%
– Gross Profit Per Year: $112.50
– Average Customer Lifespan: 2.5 years
– LTV: $281.25
If this brand’s fully loaded CAC is $80, the LTV:CAC ratio is 3.5:1, above the 3:1 sustainability threshold.
Let’s imagine this brand runs Meta Ads at a $120 CAC. On the surface, that looks like a loss: $120 to acquire a customer worth $281. But now factor in that their email list customers reorder at 5x per year, not 3x. Those customers have an LTV of $469. If the Meta ads are primarily generating email subscribers who go on to become high-repeat buyers, that $120 CAC is a bargain. The formula gives you the right answer only if you’re measuring the right customers. Segment matters more than the headline number.
Formula 2: Subscription LTV (SaaS and Recurring Revenue)
LTV = ARPU x Gross Margin % / Monthly Churn Rate
This formula is the standard for subscription businesses because it accounts for churn as a decay function instead of using an average lifespan estimate.
Step 1: Determine ARPU
Average Revenue Per User (ARPU) is your total recurring revenue divided by total customers. Use monthly ARPU for the monthly churn formula or annual ARPU for an annual version.
Step 2: Apply Gross Margin
Same as Formula 1. Multiply by your gross margin percentage to reflect contribution margin.
Step 3: Divide by Monthly Churn Rate
Churn rate is the percentage of customers who cancel each month. The inverse (1 / churn rate) gives the expected customer lifespan in months. Dividing ARPU x Margin by churn directly produces the LTV.
Example: B2B SaaS Company
– Monthly ARPU: $200
– Gross Margin: 75%
– Monthly Churn: 3%
– Gross Profit Per Month: $150
– Expected Lifespan: 1 / 0.03 = 33.3 months
– LTV: $150 / 0.03 = $5,000
For B2B SaaS in 2026, typical benchmarks show annual churn between 4% and 7%, and Net Revenue Retention (NRR) between 101% and 106%. Companies with NRR above 100% are growing revenue from existing customers even as some churn, which means the simple LTV formula underestimates actual value.
Formula 3: Predictive LTV (Most Accurate)
Predictive LTV uses statistical models (regression analysis, probabilistic models like BG/NBD, or machine learning) to forecast future customer behavior based on historical patterns.
Predictive models consider:
– Purchase recency (when did they last buy?)
– Frequency (how often do they buy?)
– Monetary value (how much do they spend per transaction?)
– Engagement signals (email opens, site visits, support interactions)
– Cohort-level behavior patterns
According to Tredence research cited by Genesys Growth, predictive LTV models outperform historical calculations by 25-40% in accuracy. The tradeoff is complexity: you need at least 12 months of data and a data science capability to build and maintain the models.
For most businesses, starting with Formula 1 or Formula 2 is sufficient. Move to predictive models once you have the data depth and analytical resources to support them.
What Is a Good LTV by Industry?

LTV benchmarks vary enormously by industry because they are driven by average revenue, margin, and retention dynamics that differ across business models.
Ecommerce
| Segment | Typical LTV | Key Driver |
|---|---|---|
| General DTC | $100-300 | Repeat purchase rate and AOV |
| Subscription DTC (beauty, food) | $200-500 | Monthly recurring + 12-18 month average lifespan |
| Luxury goods | $500-2,000+ | High AOV, lower frequency, strong brand loyalty |
Ecommerce LTV is dominated by repeat purchase behavior. Research shows that existing customers spend 67% more than new customers. The first purchase is an audition. Profitability lives in the second, third, and tenth purchase.
SaaS
| Segment | Typical LTV | Key Driver |
|---|---|---|
| SMB SaaS | $1,000-5,000 | Low ARPU, moderate churn |
| Mid-market SaaS | $5,000-25,000 | Higher ARPU, lower churn, upsell expansion |
| Enterprise SaaS | $25,000-500,000+ | High contract values, multi-year deals, NRR > 100% |
The defining metric for SaaS LTV is Net Revenue Retention. Companies with NRR above 120% (the best-in-class threshold for enterprise SaaS) are growing revenue from existing customers faster than churn erodes it. Their LTV increases over time instead of decaying, which makes the simple churn-based formula an underestimate.
High-Ticket Services
| Segment | Typical LTV | Key Driver |
|---|---|---|
| Coaching programs | $2,000-20,000 | Initial program + upsell to higher-tier programs |
| Agencies | $10,000-100,000+ | Monthly retainers, multi-year relationships |
| Financial advisory | $50,000-500,000+ | Long relationships, AUM-based fees |
CustomerGauge data shows architecture firms averaging $1.13 million in customer lifetime value and digital design brands averaging $90,000. Both numbers reflect multi-year, high-value professional relationships.
For info-product businesses and coaches, LTV is often compressed into fewer transactions but at higher price points. A coaching program that sells a $5,000 initial course and a $15,000 mastermind upsell to 30% of buyers has a blended LTV of $9,500 for the initial cohort.
Why Does Attribution Accuracy Change Your LTV?
LTV calculations depend on knowing who your customers are, where they came from, what they bought, and how long they stayed. Attribution errors corrupt each of these inputs.
Biased Customer Samples
If your attribution system tracks only 70% of actual conversions (a common gap with browser-only tracking), the 70% it sees is not a random sample. Pixel-based tracking disproportionately captures customers who converted quickly, converted on desktop, and came through trackable channels. It misses customers who converted on mobile with ad blockers, converted after cookies expired, or had multi-week decision cycles.
This sampling bias distorts your LTV calculation. The customers your tracking sees may have different average order values, different repeat purchase rates, and different retention curves than the customers it misses. Calculating LTV from a biased sample produces a number that does not represent your actual customer base.
Channel-Level LTV Distortion
Different acquisition channels produce customers with different lifetime values. Organic search customers often have higher LTV than paid social customers because they found you through active research intent instead of an interruption. Referral customers often have the highest LTV of all because they arrived with built-in trust.
If your attribution cannot accurately assign customers to channels, you cannot calculate channel-level LTV. You end up optimizing spend toward channels that look cheap on a CAC basis without knowing whether those channels produce customers who stick around.
Across the hundreds of ad accounts I’ve reviewed through Hyros data, 25-45% of winning ads are missed by standard tracking. If those winning ads produce customers with above-average LTV, the missed tracking is not just a CAC problem. It is an LTV intelligence problem. You are blind to your best-performing customer acquisition paths.
Cohort Analysis Gaps
Cohort-based LTV analysis (tracking groups of customers acquired in the same month and watching their spending behavior over time) requires accurate attribution to group customers correctly. If your January cohort includes customers who were actually acquired in December (because the attribution lagged) or excludes customers who converted 20 days after their first click (because the tracking window expired), your cohort data is contaminated.
Every business decision based on cohort LTV (budget allocation, product development, investor reporting) inherits these errors.
How Do You Increase LTV?
Increasing LTV means getting more revenue from each customer over a longer period. There are three paths: increase revenue per transaction, increase transaction frequency, and extend the customer relationship.
1. Increase Average Order Value
Upsells, cross-sells, bundles, and premium tiers all increase AOV. For ecommerce, offering a subscription option at a slight discount locks in recurring revenue while lifting the perceived value of each transaction. For SaaS, usage-based pricing tiers let high-value customers self-select into higher plans.
According to research cited by Genesys Growth, companies transitioning to usage-based pricing models see 20-30% LTV improvements within 18 months. The mechanism is straightforward: customers who use more, pay more, and usage-based pricing removes the friction of manual upgrades.
2. Increase Purchase Frequency
Email sequences, loyalty programs, replenishment reminders, and post-purchase nurture campaigns all drive repeat purchases. Personalized retention campaigns achieve 3x higher engagement than acquisition campaigns. Welcome email sequences with 60-70% open rates establish early engagement patterns that predict long-term retention.
For ecommerce, the gap between a 2x-per-year buyer and a 4x-per-year buyer doubles LTV without acquiring a single new customer. Investing in retention is almost always cheaper than investing in acquisition.
3. Extend Customer Lifespan
Reducing churn directly increases the lifespan multiplier in the LTV formula. Bain & Company research found that a 5% improvement in retention increases profits by 25-95%. That wide range reflects the compounding effect: each additional month or year of retention generates revenue at near-zero marginal acquisition cost.
For SaaS businesses, customer success programs reduce churn by 15-25% in B2B contexts. Health scoring systems can predict churn 3-6 months in advance, and proactive intervention saves 25-40% of flagged accounts. The ROI on churn prevention almost always exceeds the ROI on new customer acquisition because you are protecting revenue you already earned instead of paying to replace it.
Active community members show 2-3x higher lifetime values than non-participants, suggesting that community building is a retention strategy with direct LTV impact. Omnichannel shoppers have 30% higher LTV than single-channel customers. Another argument for meeting customers on multiple surfaces instead of optimizing a single channel.
4. Fix Attribution to Find High-LTV Channels
This is the attribution-specific lever. If you cannot see which channels produce your highest-LTV customers, you cannot allocate budget toward them. An attribution platform that tracks the full customer journey, from first ad click through every repeat purchase, lets you calculate LTV by acquisition source and shift spend toward the channels that produce customers who stay longest and spend the most.
Hyros tracks every transaction tied to a customer profile, from the first attributed ad click to the latest repeat purchase. This gives you LTV by campaign, by ad set, and by creative: granularity that platform-side attribution cannot provide because it loses track of customers after the first conversion.
How Does Hyros Help With LTV Calculation?
I built the full-journey tracking in Hyros because I kept running into the same dead end: I could see my acquisition metrics but had no visibility into what happened after the first sale. My ad platforms told me CPA. They couldn’t tell me which campaigns were finding customers who bought again six months later. That’s the number that actually determines whether a business is profitable. Hyros provides the tracking foundation that makes accurate LTV calculation possible by solving three problems platform-side attribution cannot.
Complete Customer Journey Data
Hyros tracks every purchase a customer makes, not just the first one. Platform-side attribution (Meta Ads, Google Ads) is designed to measure ad campaign performance, not customer lifetime behavior. Once a customer converts, platform tracking stops caring about them. Hyros continues tracking repeat purchases, upsells, subscription renewals, and every subsequent transaction, tying them all back to the original acquisition source.
This means you can calculate true LTV by acquisition channel. If Meta Ads customers average $350 in lifetime value and Google Ads customers average $600, that changes your CAC targets for each channel. The right question is not “which channel has the lowest CPA?” but “which channel produces the highest LTV relative to its CAC?” Only full-journey tracking can answer that.
Accurate Cohort Data
Because Hyros uses deterministic matching (email, phone) instead of cookies, it does not lose track of customers when they switch devices, clear browsers, or return after cookies expire. Your cohort analysis is built on complete records, not the partial sample that cookie-based tracking provides.
According to an independent analysis by Softailed, server-side tracking recovers 18-40% more conversions compared to browser-only pixels. Those recovered conversions include both first purchases (which affect CAC calculations) and repeat purchases (which affect LTV calculations). Without them, both sides of your unit economics equation are wrong.
Revenue Attribution Beyond the First Sale
The standard attribution question is: which ad drove this customer’s first purchase? Hyros extends that question to: which ad drove this customer’s total lifetime value? If a Facebook prospecting ad acquired a customer who made a $50 first purchase but went on to spend $2,000 over two years, the true value of that ad is $2,000, not $50.
This long-view attribution changes budget allocation decisions. Dan Henry used Hyros data to scale from $20,000 to $300,000 per month in ad spend while becoming 300% more profitable. That trajectory requires knowing not just which ads acquire customers cheaply, but which ads acquire customers who are worth the most over time.
For more on how to pair LTV with CAC for business-level decision making, see our guide on the CAC-to-LTV ratio and the ROAS vs ROI comparison.
FAQ
What is a good LTV:CAC ratio?
The standard benchmark is 3:1: each customer generates at least three times the cost of acquiring them. Top-quartile SaaS companies achieve 4:1 to 6:1. A ratio below 2:1 signals unsustainable unit economics. A ratio above 8:1 may indicate underinvestment in growth; you could afford to acquire more customers more aggressively. The ratio only works if both numbers are accurate, which requires attribution that counts all customers and assigns them to the right channels.
How is LTV different from revenue?
Revenue measures what customers pay. LTV measures what customers are worth over their entire relationship, accounting for margin and retention. A customer who pays $100 per month at 75% margin for 24 months generates $2,400 in revenue but $1,800 in LTV (the margin-adjusted amount that covers acquisition costs and generates profit). Revenue is a top-line number. LTV is a unit economics number.
How much data do I need to calculate LTV?
A minimum of 12 months of customer transaction data produces a reliable baseline, according to NetSuite research. For subscription businesses, you need enough time to observe churn patterns (typically 6-12 months of cohort data). For ecommerce with infrequent purchases (furniture, mattresses), you may need 2-3 years to observe repeat behavior. Start with whatever data you have. A rough LTV estimate is far better than no LTV estimate.
Can I calculate LTV by marketing channel?
Yes, but only with attribution that tracks the full customer journey. You need to know which channel acquired each customer and then track that customer’s subsequent purchases over time. Platform-side attribution (Google Ads, Meta Ads) tracks initial conversions but does not follow customers through repeat purchases. A dedicated attribution platform like Hyros connects every transaction to the original acquisition source, enabling accurate LTV-by-channel analysis.
Why does my LTV keep changing?
LTV shifts as your customer mix evolves, pricing changes, product offerings expand, and retention dynamics change. Common causes include: new marketing channels bringing in customers with different spending patterns, price increases affecting both AOV and churn, product improvements increasing retention, and seasonal purchasing patterns creating cohort-level variation. Track LTV by cohort (customers acquired in the same month) to isolate these effects instead of relying on a single blended number.
What is net revenue retention and how does it affect LTV?
Net Revenue Retention (NRR) measures revenue change from existing customers including upgrades, downgrades, and churn. An NRR of 110% means you earn 10% more from existing customers each year even after accounting for cancellations. NRR above 100% means the simple churn-based LTV formula underestimates actual LTV because customers are expanding their spending over time. Enterprise SaaS companies with 120%+ NRR have LTV curves that increase instead of decay. Each year a customer stays, they become more valuable, not less.
Standalone Summary
Customer lifetime value (LTV) is the total net revenue a customer generates across their entire relationship with a business. The standard formula is Average Revenue Per Customer multiplied by Gross Margin multiplied by Average Customer Lifespan. For subscription businesses, the shortcut is ARPU multiplied by Gross Margin divided by Monthly Churn Rate. Industry benchmarks in 2026 range from $100-300 for general DTC ecommerce to $25,000-500,000+ for enterprise SaaS. The sustainability benchmark for unit economics is an LTV:CAC ratio of at least 3:1. LTV calculations depend on accurate customer data, which requires attribution that tracks the full customer journey. Browser-based tracking misses 20-40% of conversions and produces biased customer samples that distort LTV calculations. Increasing LTV comes from raising average order values, increasing purchase frequency, extending customer lifespan through retention, and using attribution data to find and scale channels that produce the highest-LTV customers. Hyros provides full-journey tracking from first ad click through every repeat purchase, enabling LTV calculation by acquisition channel, campaign, and creative with data that matches what your payment processor actually records.
Track every customer from first click to lifetime value with Hyros. Book a demo