

Incrementality Testing Without Engineers: The 6-Click Workflow Inside Hyros
TL;DR
- Incrementality testing measures true causal lift via treated-vs-holdout comparison
- No data scientist required — modern dashboards absorb the stats math behind one button
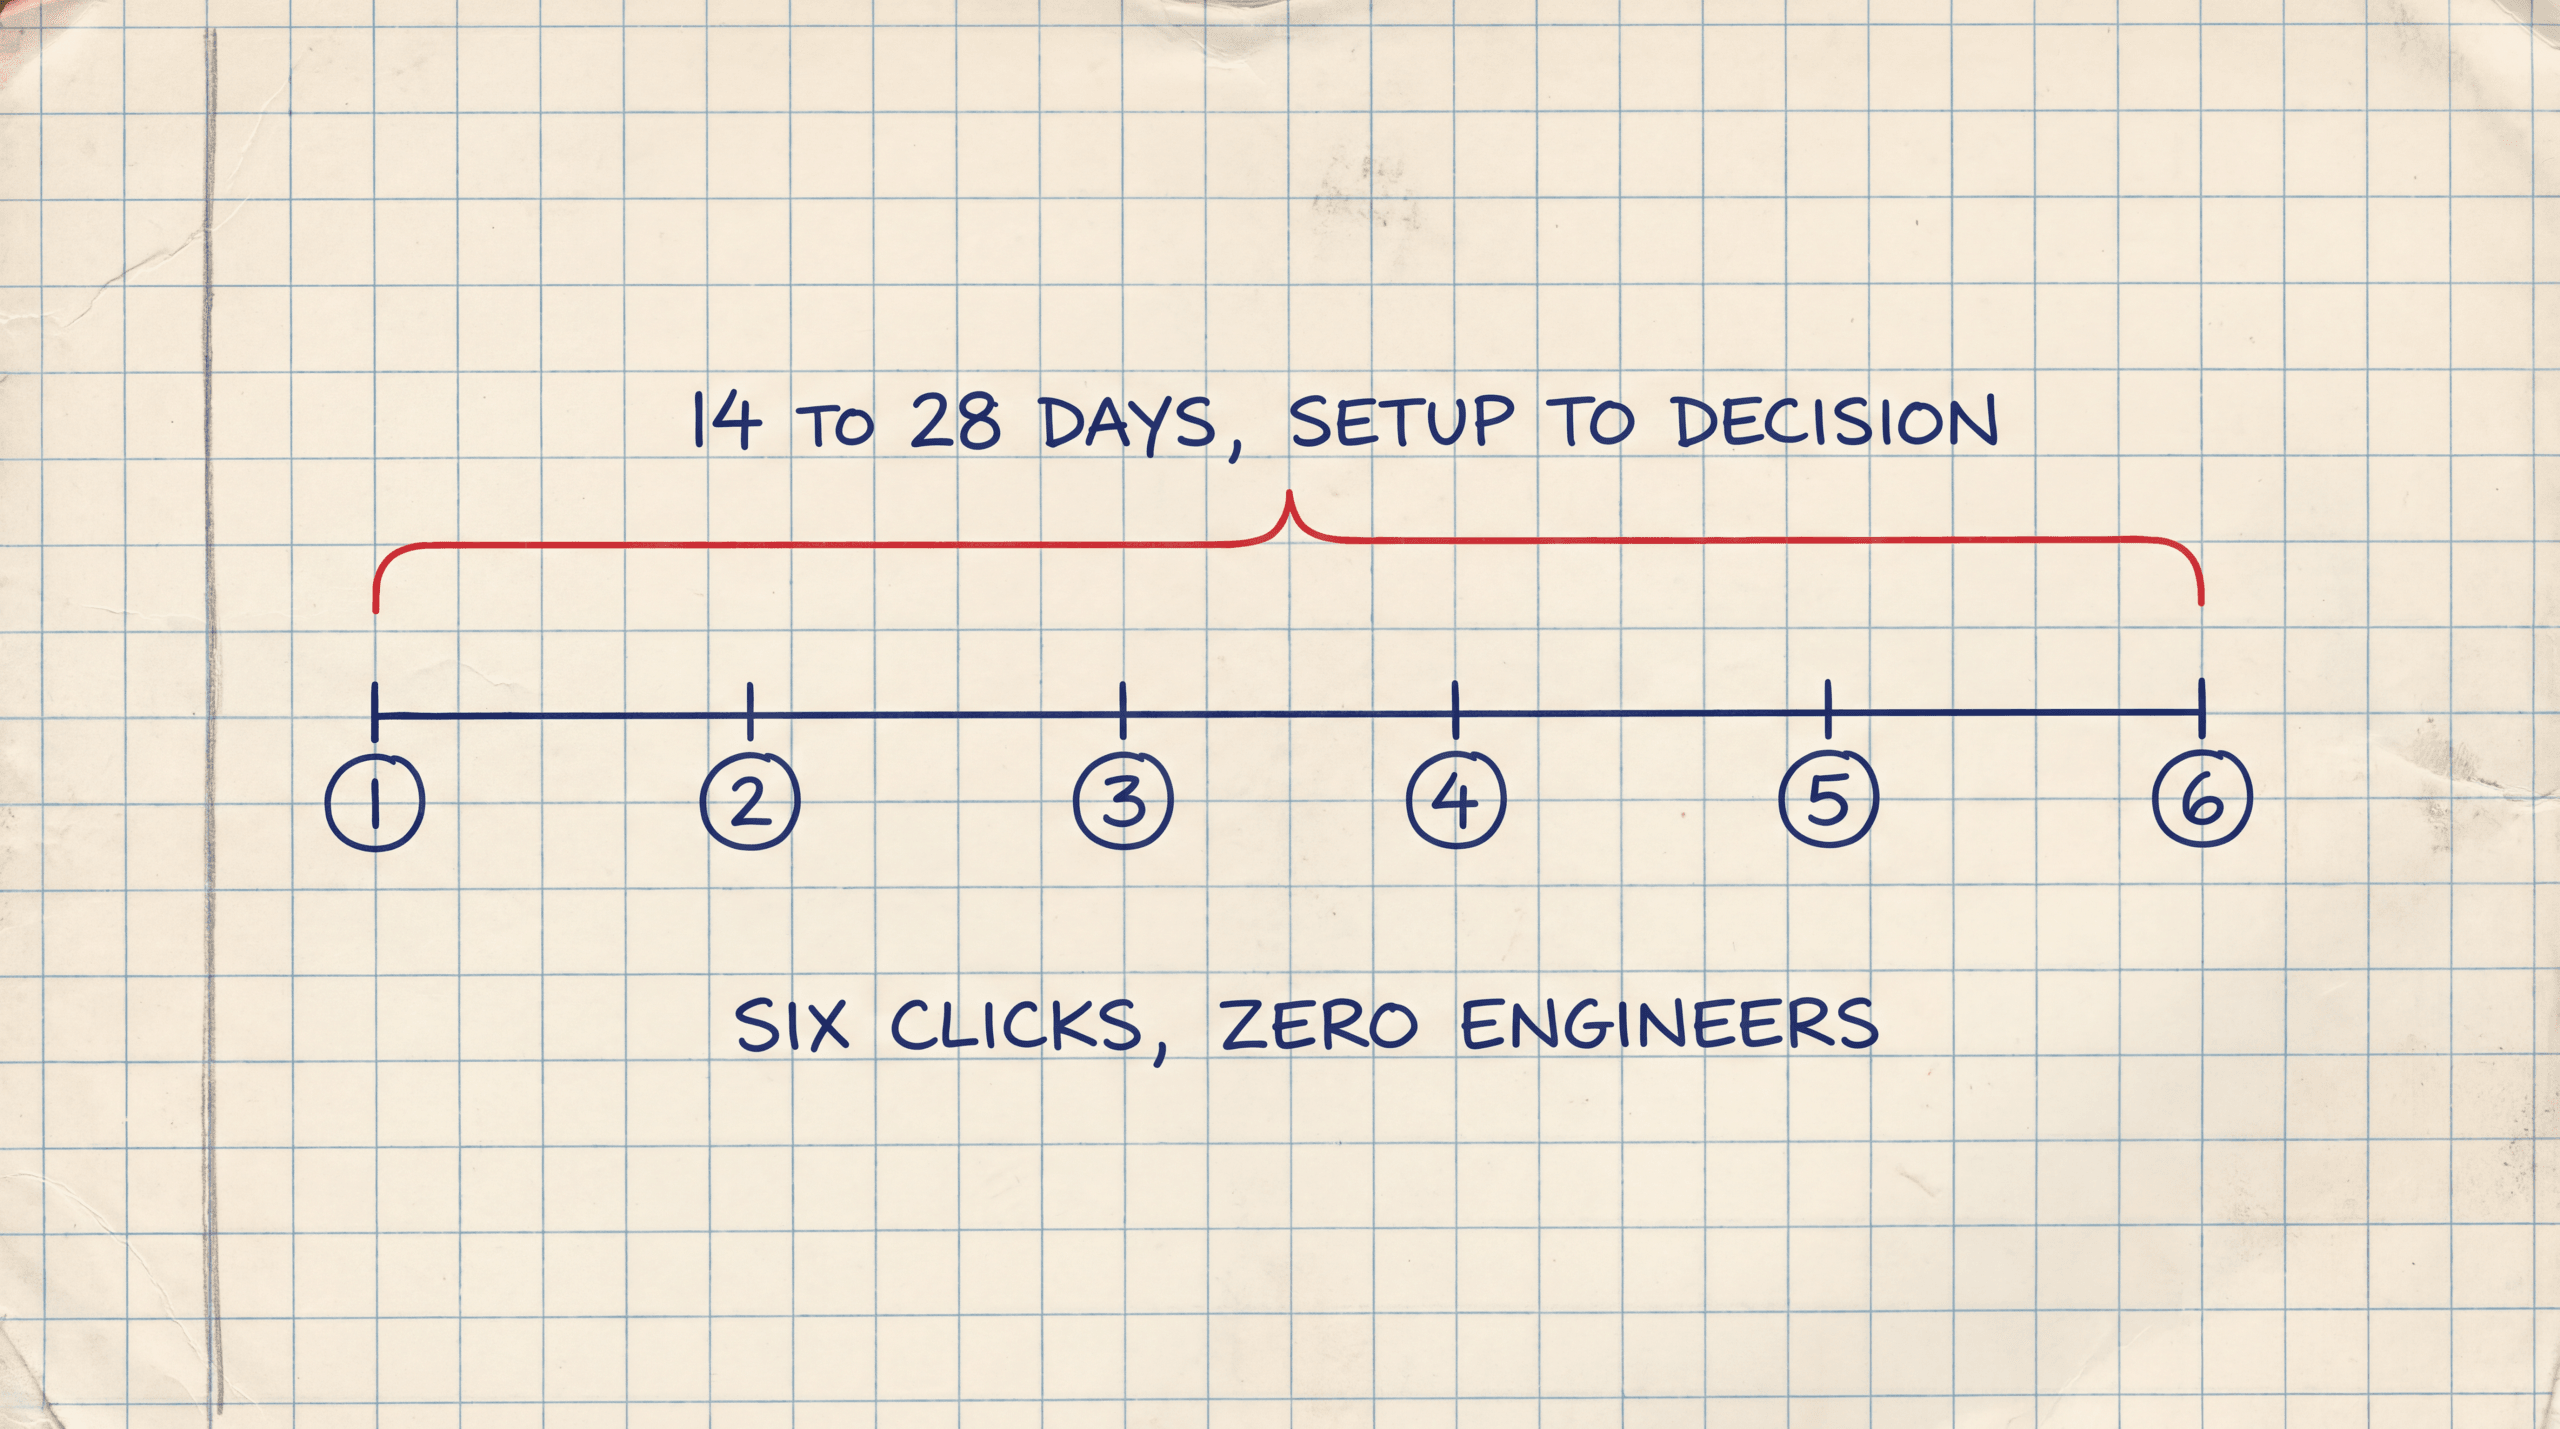
- A 6-step holdout runs 14 to 28 days from setup to kill-or-scale decision
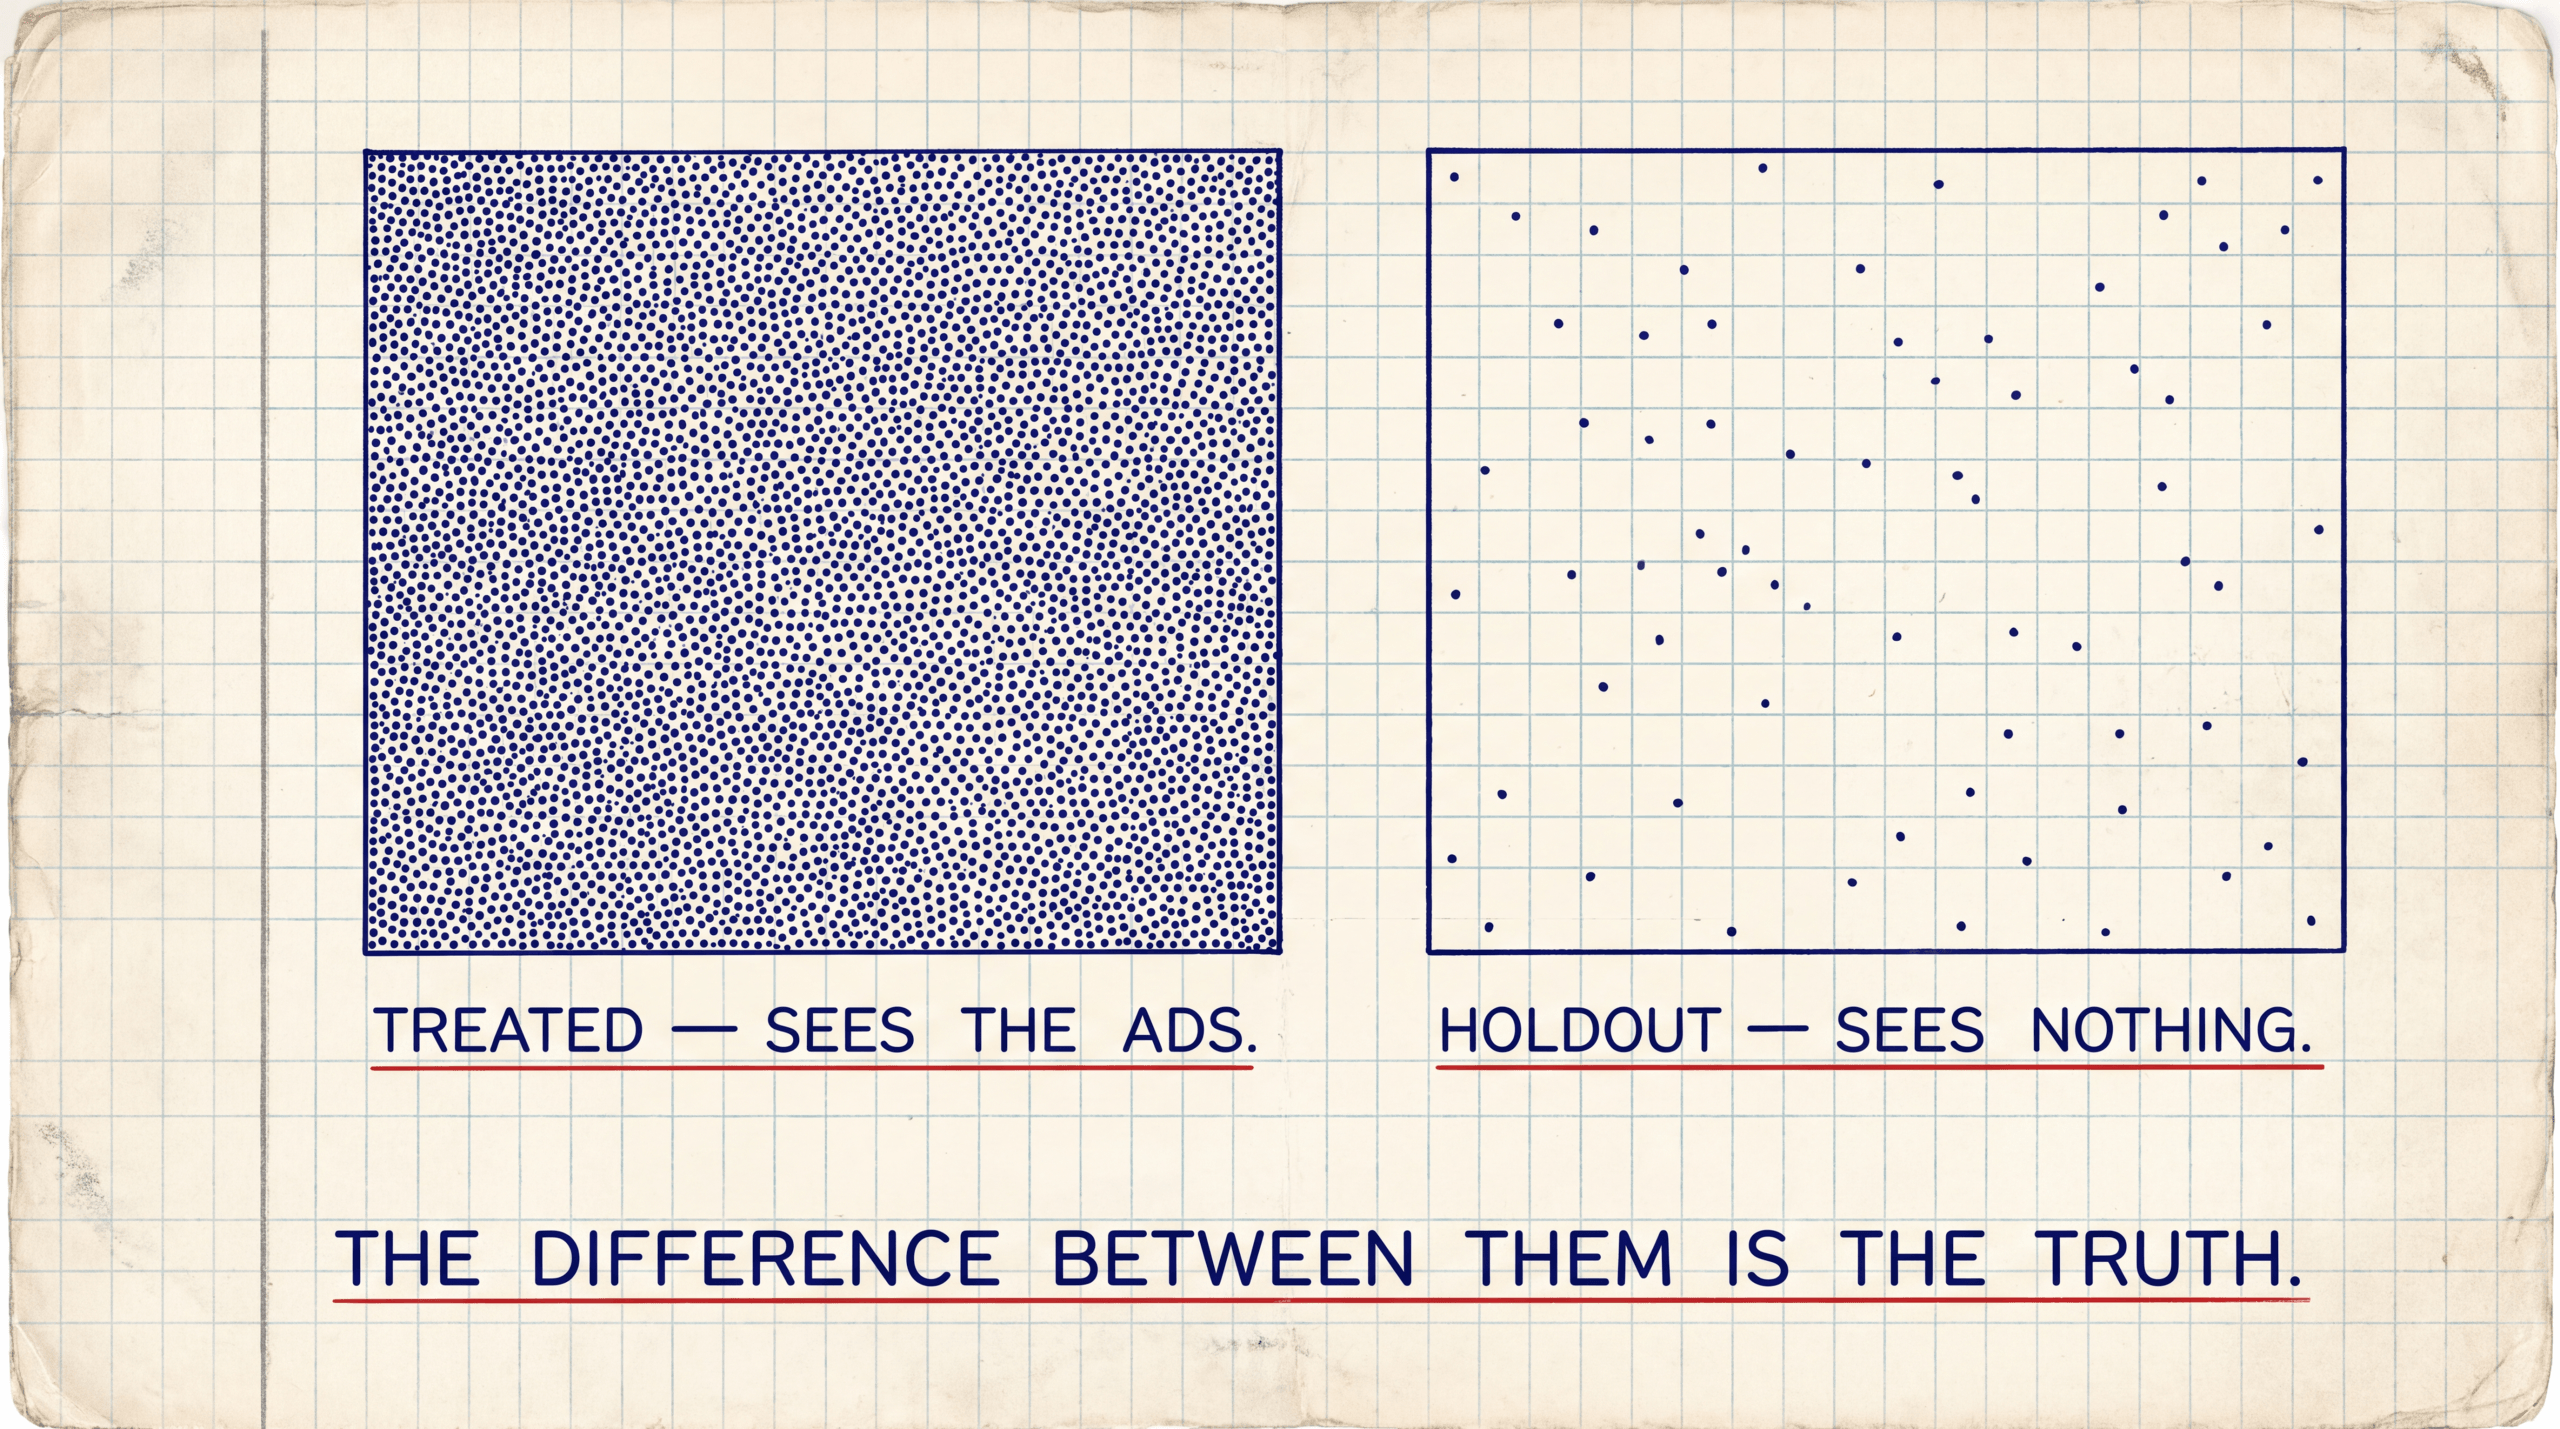
Incrementality testing measures the true causal lift of a campaign by comparing a treated group against a holdout control. Most guides assume you have a data scientist and a stats library. You don’t. Here’s the 6-step workflow to run a clean holdout test inside Hyros. No R. No Python. No engineer handoff. 14 to 28 days from setup to a kill-or-scale decision.
What Incrementality Testing Actually Measures (And Why ROAS Isn’t Enough)
Most marketers treat reported ROAS as truth. It isn’t. A converting click is not the same as a click that caused the conversion. Until you separate those, every budget decision is a guess.
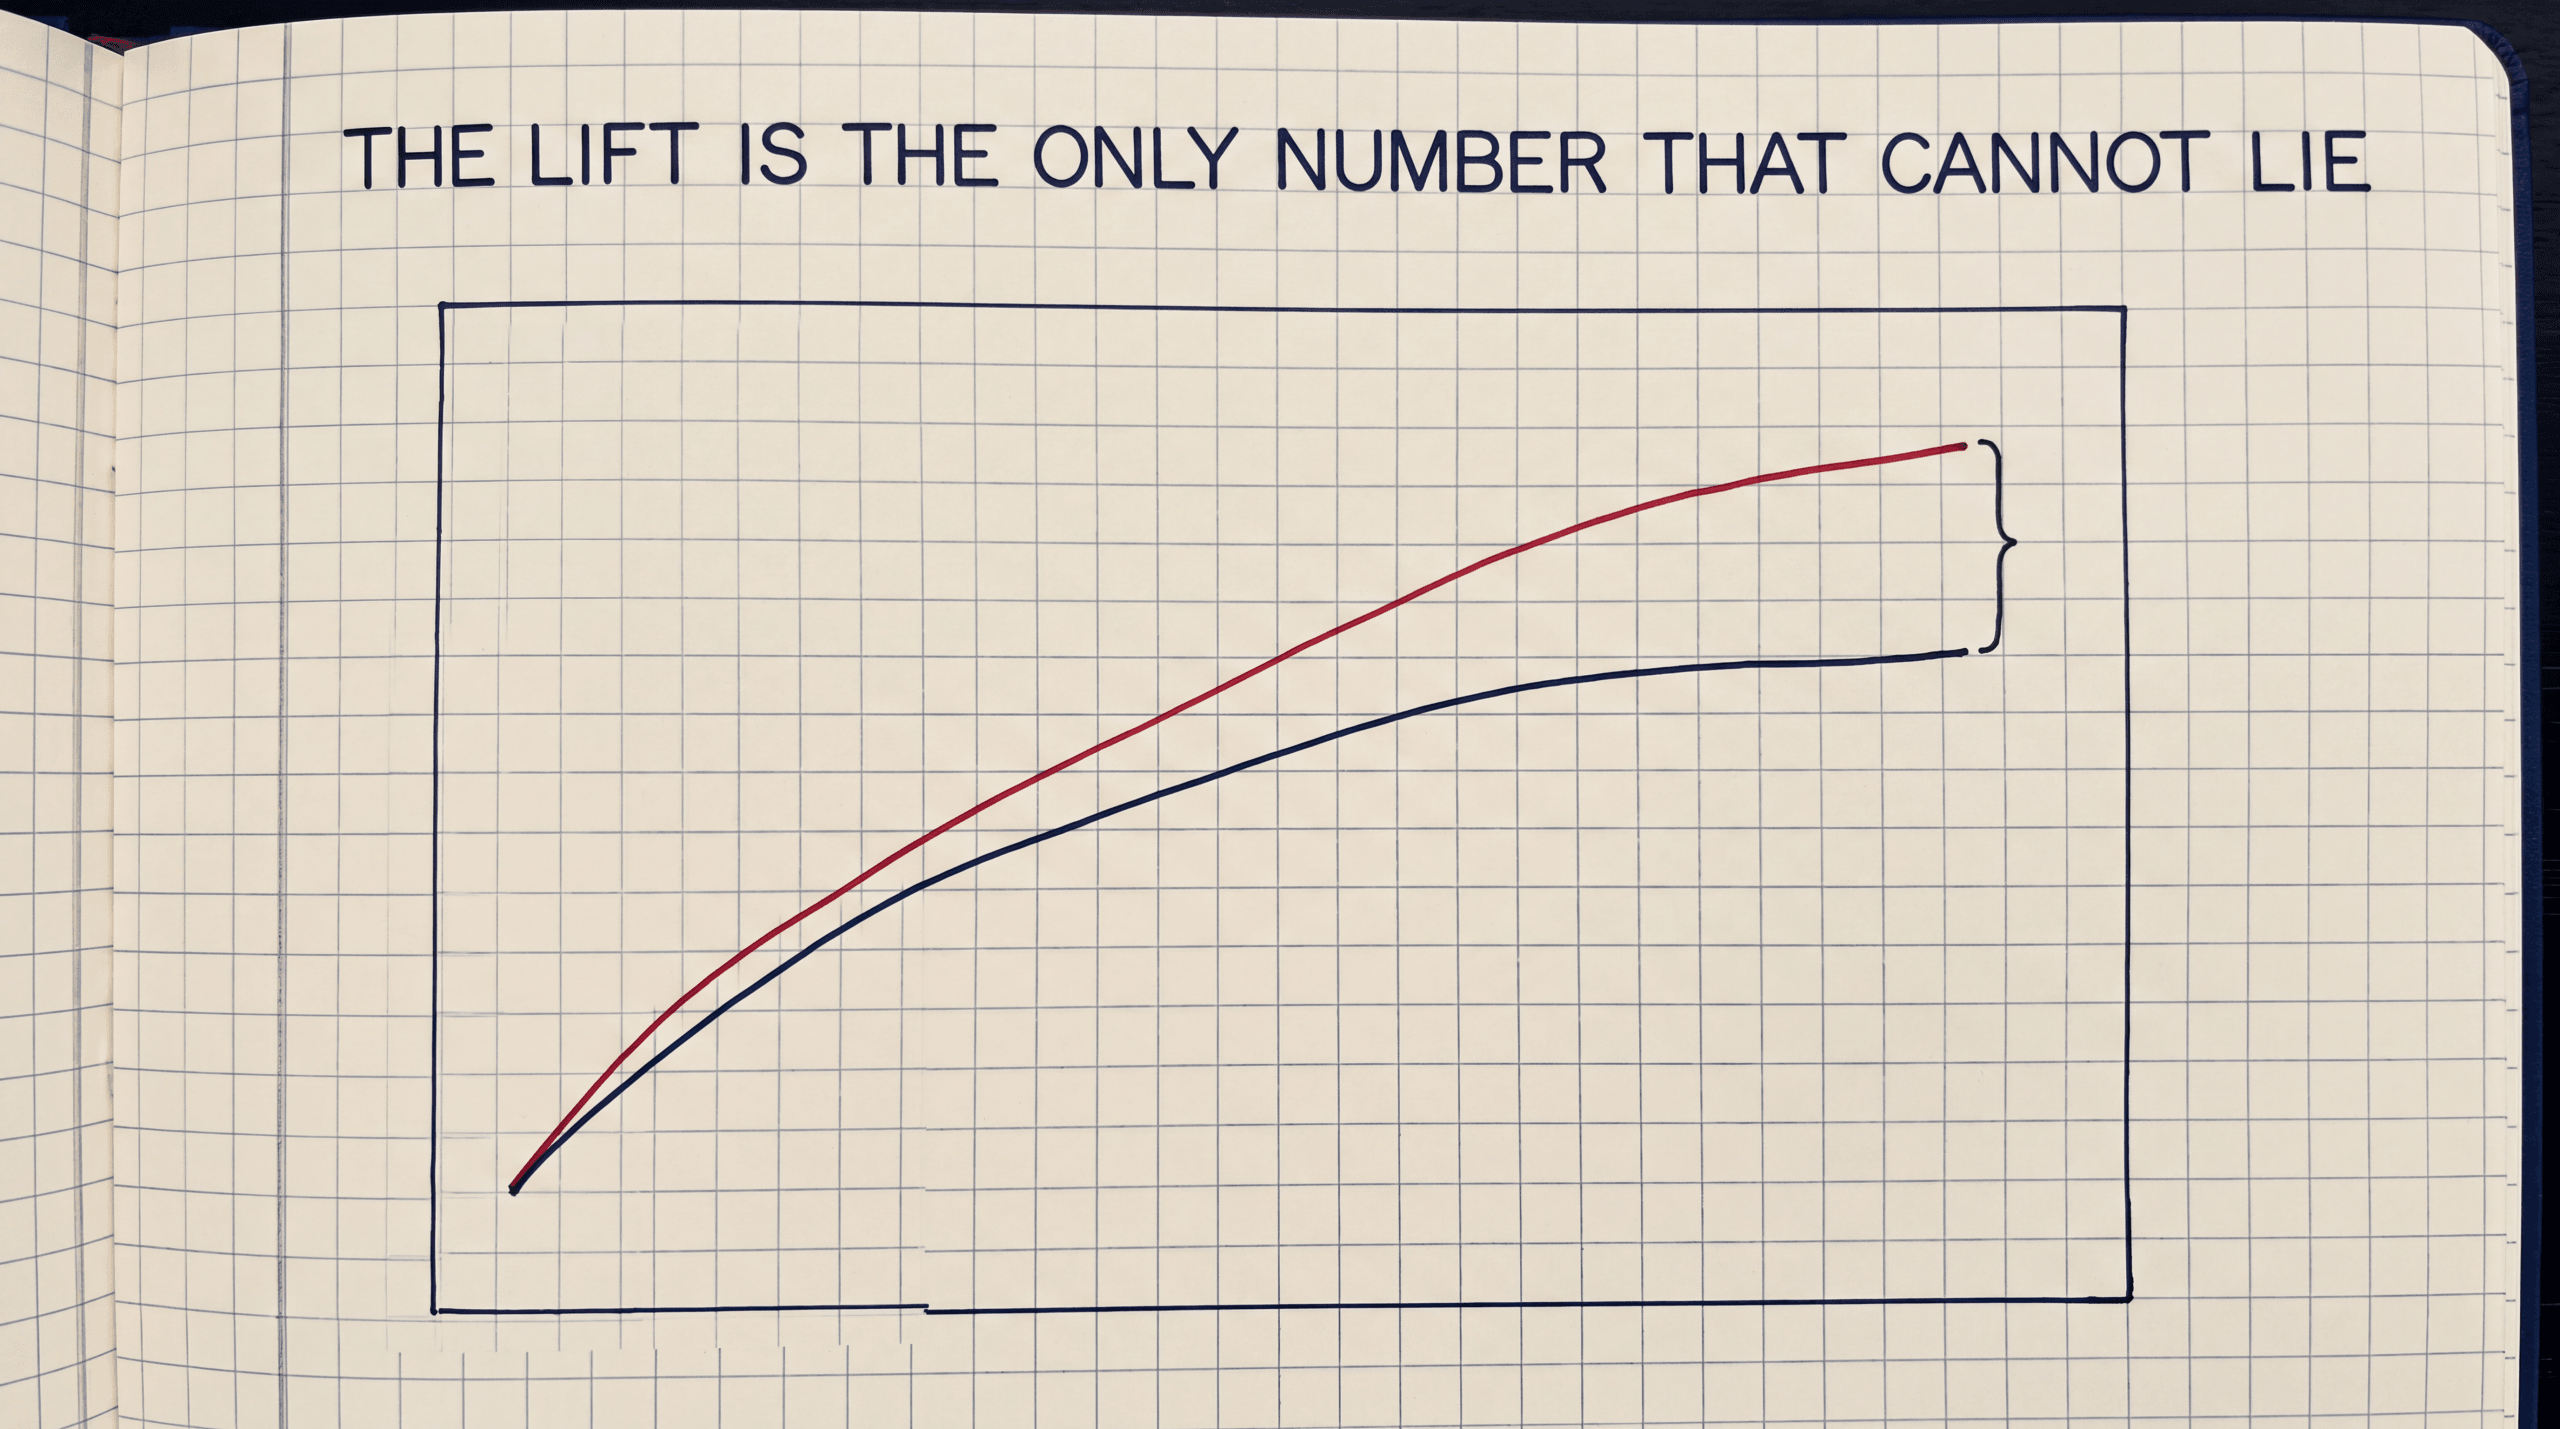
Incrementality answers the only question that matters: if I turn this channel off, how many sales actually disappear? Reported conversions tell you who clicked. Incremental lift tells you who would not have bought otherwise. The gap is where wasted spend hides, and industry research from LayerFive puts it at nearly half of marketing spend lost to poor attribution.
I built Hyros because I couldn’t scale my own businesses without this answer. Even after I fixed tracking, I kept finding channels that looked profitable on the dashboard but produced almost no real lift when I turned them off. That’s the problem last-touch attribution can’t fix. Last-touch flatters intercept channels like branded search and retargeting because they show up right before the sale even when they didn’t cause it.
Why Most Marketers Skip It (The Engineer Myth)
Ask ten media buyers why they’ve never run an incrementality test. Eight will say the same thing. “We don’t have a data scientist.” This is the most expensive lie in marketing.
Yes, the math is complex. Meta’s open-source GeoLift library is built in R. Haus.io was founded by ex-Google economists. Real causal inference uses synthetic controls and Bayesian time series, which absolutely require a data team.
But the execution doesn’t. Modern attribution tools have absorbed the math into the dashboard. You pick a channel, set a holdout percentage, let it run. The tool spits out a lift number with a confidence interval. You don’t need to understand internal combustion to drive to the grocery store.
When I was running ads for Hyros, I noticed the teams running incrementality tests weren’t the ones with PhDs. They were the ones using tools that hid the math behind a button. Everyone else stalled at “we’ll do it next quarter.” Next quarter never showed up.
The 3 Test Types You Actually Need to Know
There are three incrementality test designs that cover most of what a marketer will need. Pick one based on the channel and the question.
Geo holdout
Turn off a channel in a list of test cities, keep it running in matched control cities, compare revenue across the test window. Strongest design for brand spend, TV, podcast, OOH, and PR, where targeting individuals isn’t possible. Downside: you need enough geographic spread to build matched groups.
Audience holdout
Randomly carve out a percentage of your audience and exclude them from a specific channel. After 14 to 28 days, compare conversion rates between included and excluded groups. For DTC and agency accounts under $500K a month in spend, this is the right default. Fast to set up, no geographic spread required, works inside any platform that supports excluded audiences.
Ghost bids
Paid search only. You let your ad enter the auction but intentionally lose on a subset of impressions. The ghost impressions become the control. Google Ads Conversion Lift Studies use a variant of this. Right design for branded search, where audience holdout fails because the audience self-selects by typing your brand name.
Most readers will start with audience holdout. Where it meets its limits, multi-touch attribution picks up the journey-level questions.
The Holdout Test Workflow, Step by Step
This is the part nobody else shows. AppsFlyer, Google, and Haus stop at concept. Triple Whale and Lifesight pitch their tool but don’t walk you through the runbook. Here’s what I’d run, regardless of which attribution tool sits underneath. The methodology is the same whether you click through a dashboard or hand it to an analyst.
Step 1: Pick a channel to test
Start with your largest paid spend channel. That’s where the wasted-spend exposure is biggest. If you’re spending $100K a month on Meta and real lift is 50% of reported, that’s $50K in monthly waste worth knowing about. Pick the channel where a clear answer changes a budget decision next quarter.
Step 2: Define your holdout population
Two options for most accounts: an audience holdout or a geo holdout. Audience is the right default if your platform supports excluded audiences. Geo is the right call if you’re testing brand spend, TV, podcast, or anything where you can’t target individuals. Before you start, confirm your campaigns have enough geographic spread (for geo) or enough audience size (for audience) to build a matched control. If the spread isn’t there, run audience and revisit geo later.
Step 3: Size the holdout
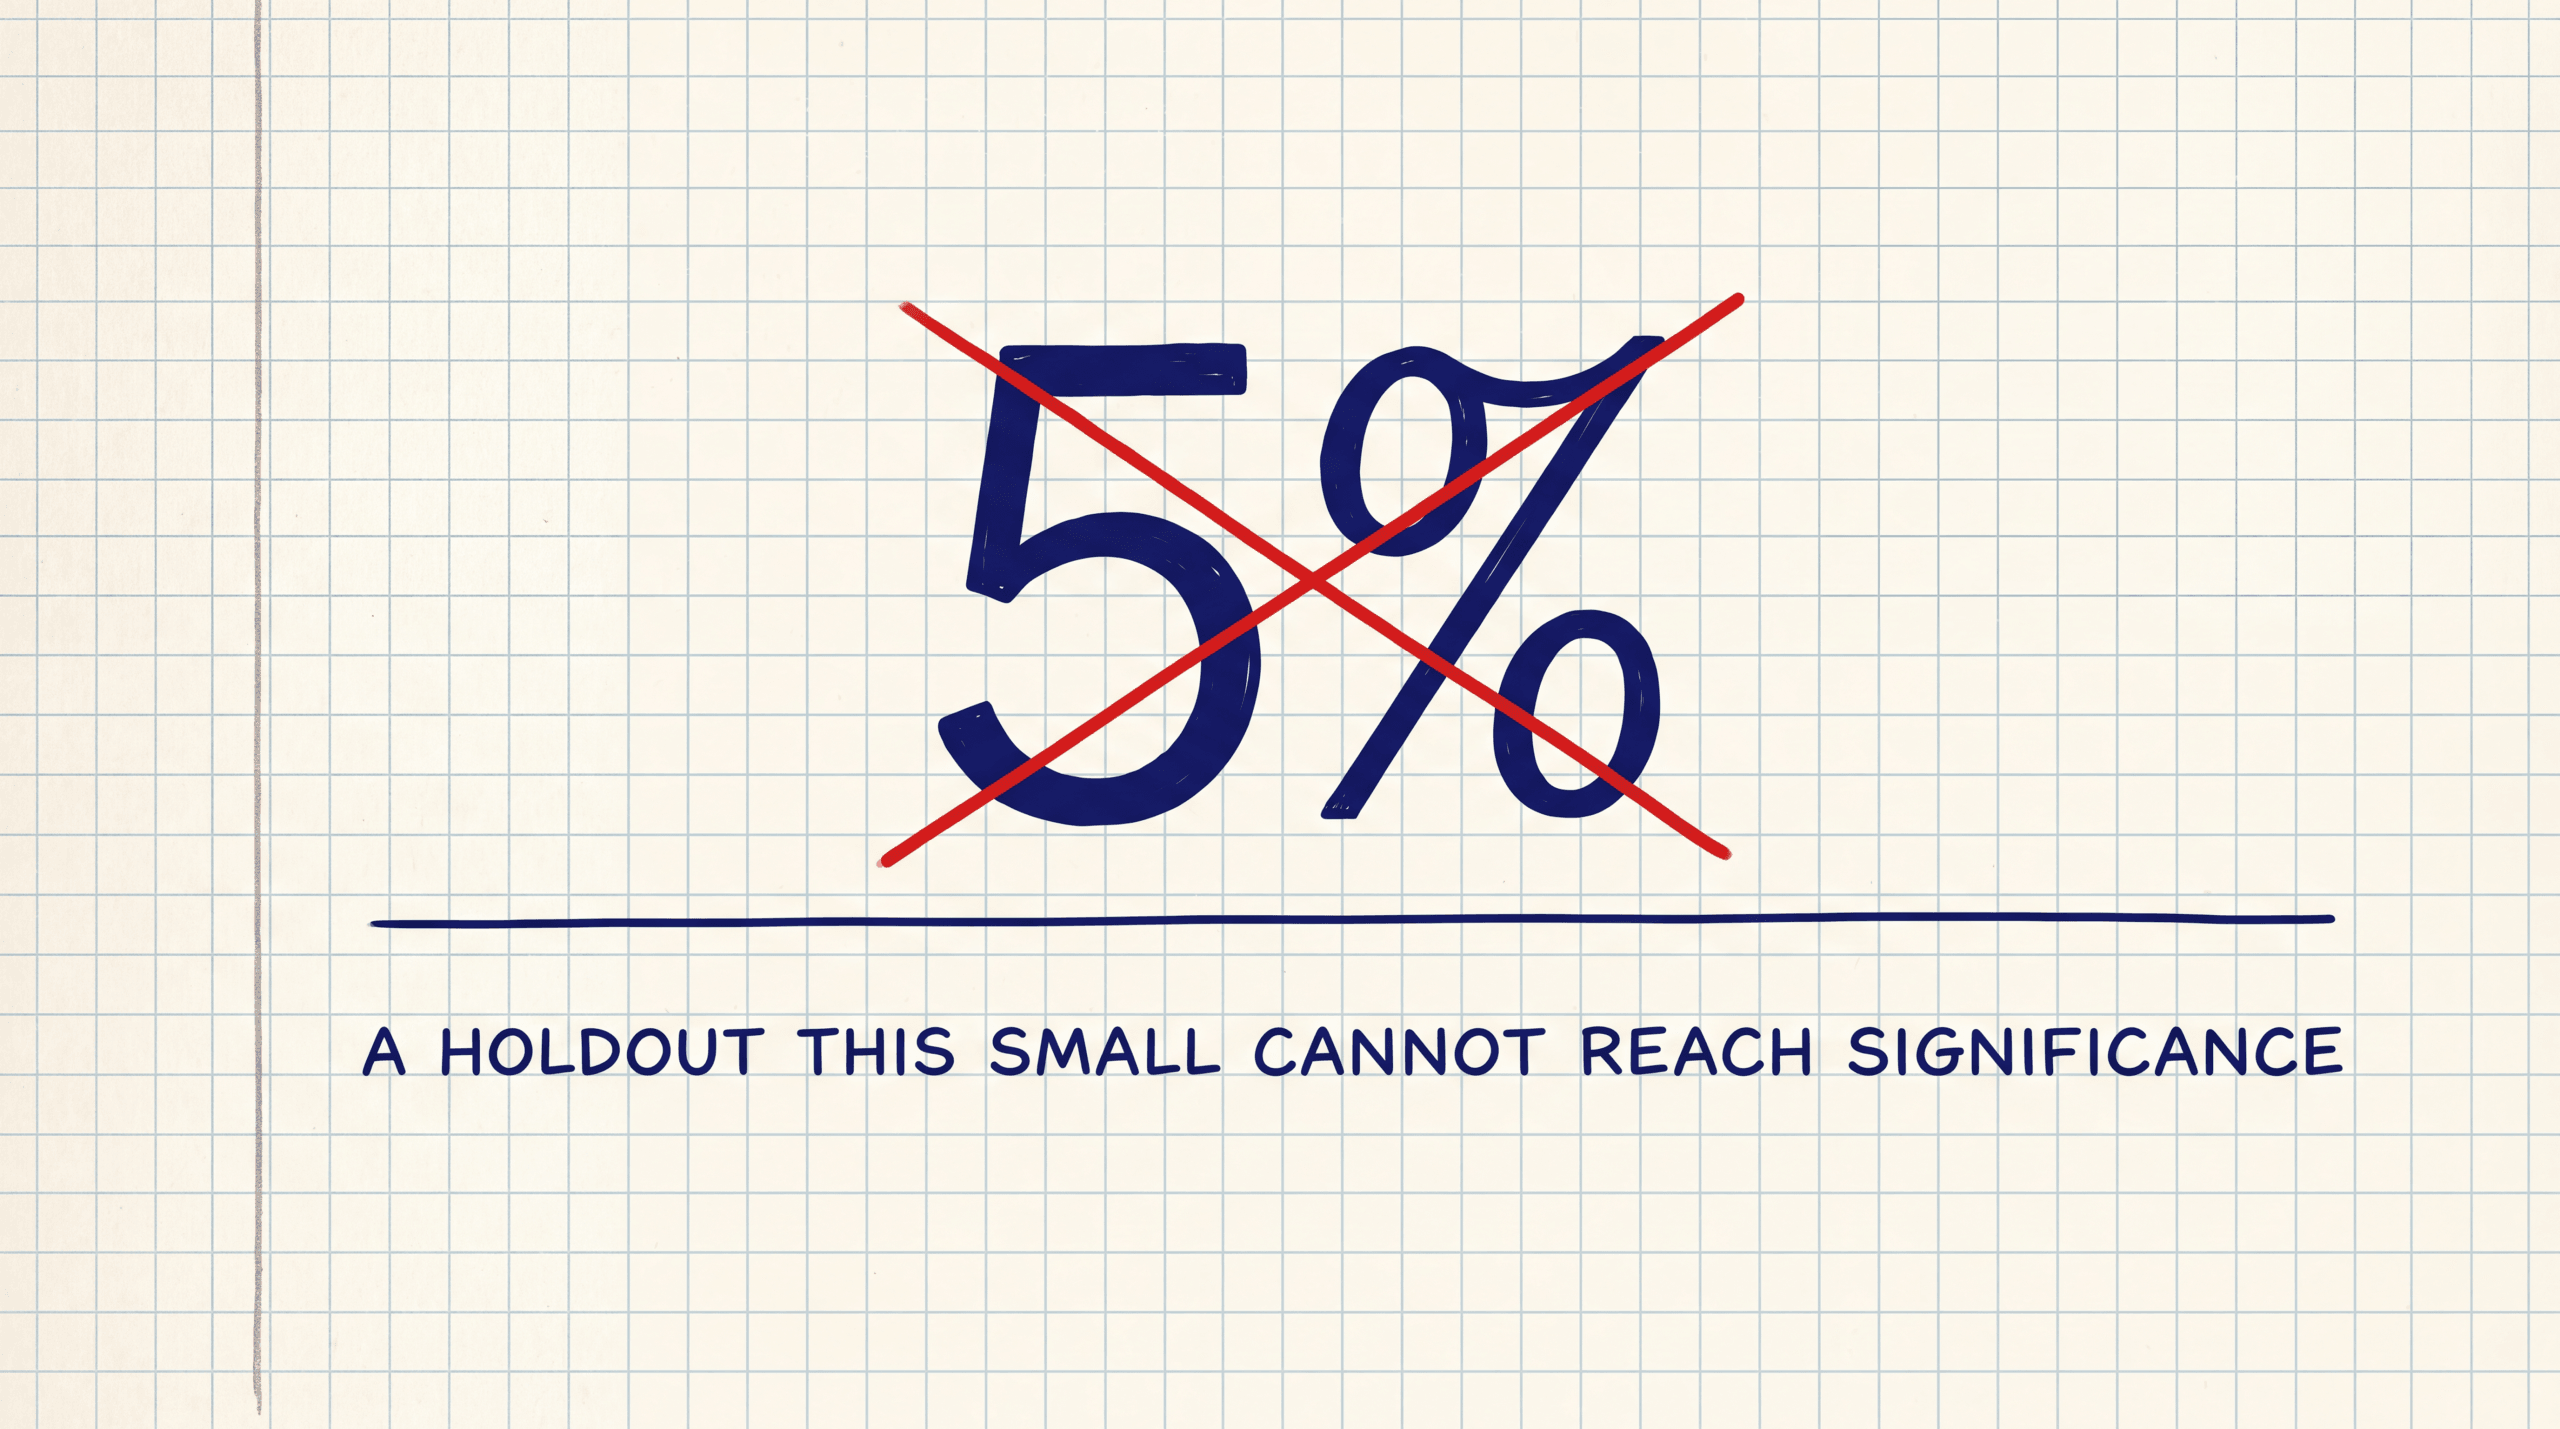
This is where most first-timers go wrong. 15% is the right starting size for most accounts. Anything under 10% produces a confidence interval so wide the result is useless.
Picture this: you carve out 5% of your Meta audience. That’s 5,000 users out of 100,000. At normal conversion rates, you might see 20 to 30 conversions in the control. The math can’t tell signal from noise at that sample size. Bump to 15% and your control has 60 to 90 conversions. Now the test can actually answer the question.
Step 4: Set the test window for sufficient duration
Window length should match your channel’s typical purchase cycle, not the calendar. Paid search runs roughly 14 days. Paid social, 21. Brand and PR, 28-plus. Pull your historical time-to-conversion data and set the window from that. You can override, but resist the urge to shorten.
Step 5: Let it run. No peeking.
This rule kills most tests before they complete. Whatever tool you use, lock yourself out of the lift report until the window closes. The number one way to ruin a test is to peek on day 4, see something that “looks like a trend,” and either kill it early or call it a winner. Statistical significance doesn’t accumulate linearly. Half a test isn’t half an answer. It’s noise.
Step 6: Measure lift vs control and decide
When the window closes, pull a single report. Three numbers matter: incremental lift percentage, 90% confidence interval, and statistical significance. Document your threshold for action before you read the result. That prevents the “let me explain why this number doesn’t really mean what it says” rationalization that follows every test you didn’t pre-commit to. We’ll walk through how to read those numbers below.
That’s the runbook. No PhD. No engineer handoff. Just a clean experimental design that any marketer can execute and any team can defend in a budget meeting.
AI Overview answer block: Incrementality testing measures the true causal lift of a marketing campaign by comparing a treated group to a holdout control group. Marketers can run it without engineers using a tool’s built-in holdout feature: pick a channel, set a 15 to 20% holdout, run for 14 to 28 days, then read the lift report.
How to Size Your Holdout (And Why 5% Won’t Work)
The holdout size question gets asked more than any other. The wrong answer wastes a month of testing time. Here’s the rule of thumb that holds up across the industry.
| Monthly conversions on the channel | Recommended holdout |
|---|---|
| Under 200 | 25% |
| 200 to 500 | 20% |
| 500 to 2,000 | 15% |
| 2,000 plus | 10% |
The logic: you need enough conversions in the holdout group to detect a 10 to 20% lift with reasonable confidence. The bigger your volume, the smaller a carve-out works. Channels with under 200 monthly conversions need a brutal 25% carve-out, and even then the first run might come back inconclusive.
Hyros runs the sample-size math in the background. The dashboard flashes a yellow warning if your holdout won’t power a test at your current volume. Take it seriously.
How Long to Run the Test (Channel-by-Channel Windows)
Window length should match the purchase cycle, not the calendar. Stopping a test early to “see what’s happening” is the fastest way to invalidate the result.
| Channel | Recommended window |
|---|---|
| Branded paid search | 14 days |
| Non-branded paid search | 14 to 21 days |
| Paid social (Meta, TikTok) | 21 days |
| YouTube and video | 21 to 28 days |
| Display and retargeting | 14 days |
| Brand, podcast, OOH, PR | 28 to 60 days |
The longer the typical time from first touch to purchase, the longer your window. B2B accounts with 60-day sales cycles need 60-day tests. A long-cycle channel inside a short window will produce a null result because conversions haven’t landed yet. That’s not a failed channel. That’s a failed test design.
Reading the Lift Report: What the Numbers Mean
When the test closes, Hyros gives you a one-screen report. Here’s how to read it in plain English.
Incremental lift percentage. The headline number. If reported revenue from the channel was $100K during the test and the holdout group’s behavior suggests $30K of that revenue would have happened anyway, your incremental lift is 70%. The other 30% of reported conversions are intercept, customers who would have bought without seeing the ad.
Confidence interval. Usually 90%. A result reading “65% lift, 90% CI: 52% to 78%” means the model is 90% confident the true lift falls in that range. A wide interval (“45% lift, 90% CI: minus 10% to plus 100%”) is unactionable because the range includes both “kill it” and “scale it.”
Statistical significance. A p-value or “significant / not significant” flag. Significant means the difference between test and control groups is unlikely to be random noise. Not significant means you can’t rule out chance. Rerun with a larger holdout or a longer window.
Three outcomes are possible: clear lift (scale or maintain), clear no-lift (kill or restructure), and inconclusive (rerun bigger). Inconclusive is the most common first-test outcome, especially on channels with under 500 monthly conversions. Don’t panic. Bump the holdout to 20% and rerun.
If your Google test shows weak lift, the channel isn’t the only suspect. Your conversion signal might be the problem. Google Enhanced Conversions can recover signal the default pixel loses, often turning a “no lift” test into a “real lift” one on rerun.
Three Common Mistakes That Wreck Your First Test
I’ve watched hundreds of teams run their first incrementality test. Three mistakes account for almost every botched result. Here they are, in order of frequency.
Mistake 1: Running during a sale or major creative refresh. Your window has to be steady-state. If you’re in the middle of a 25%-off promo or a major creative shift, the test is measuring the event, not the channel. Wait two weeks after the promo ends, then start.
Mistake 2: Holdout too small. 5% doesn’t work. 15% does. If Hyros throws the yellow warning, listen to it.
Mistake 3: Channel still in learning phase. A brand new Meta campaign is in learning phase for the first 7 to 10 days. Launch a test on a 3-day-old campaign and you’re measuring the learning phase, not the channel.
Most “Hyros told us our channel doesn’t work” stories trace back to one of those three. The channel might be fine. The test was measuring the wrong thing.
What To Do With the Result (Kill, Scale, or Restructure)
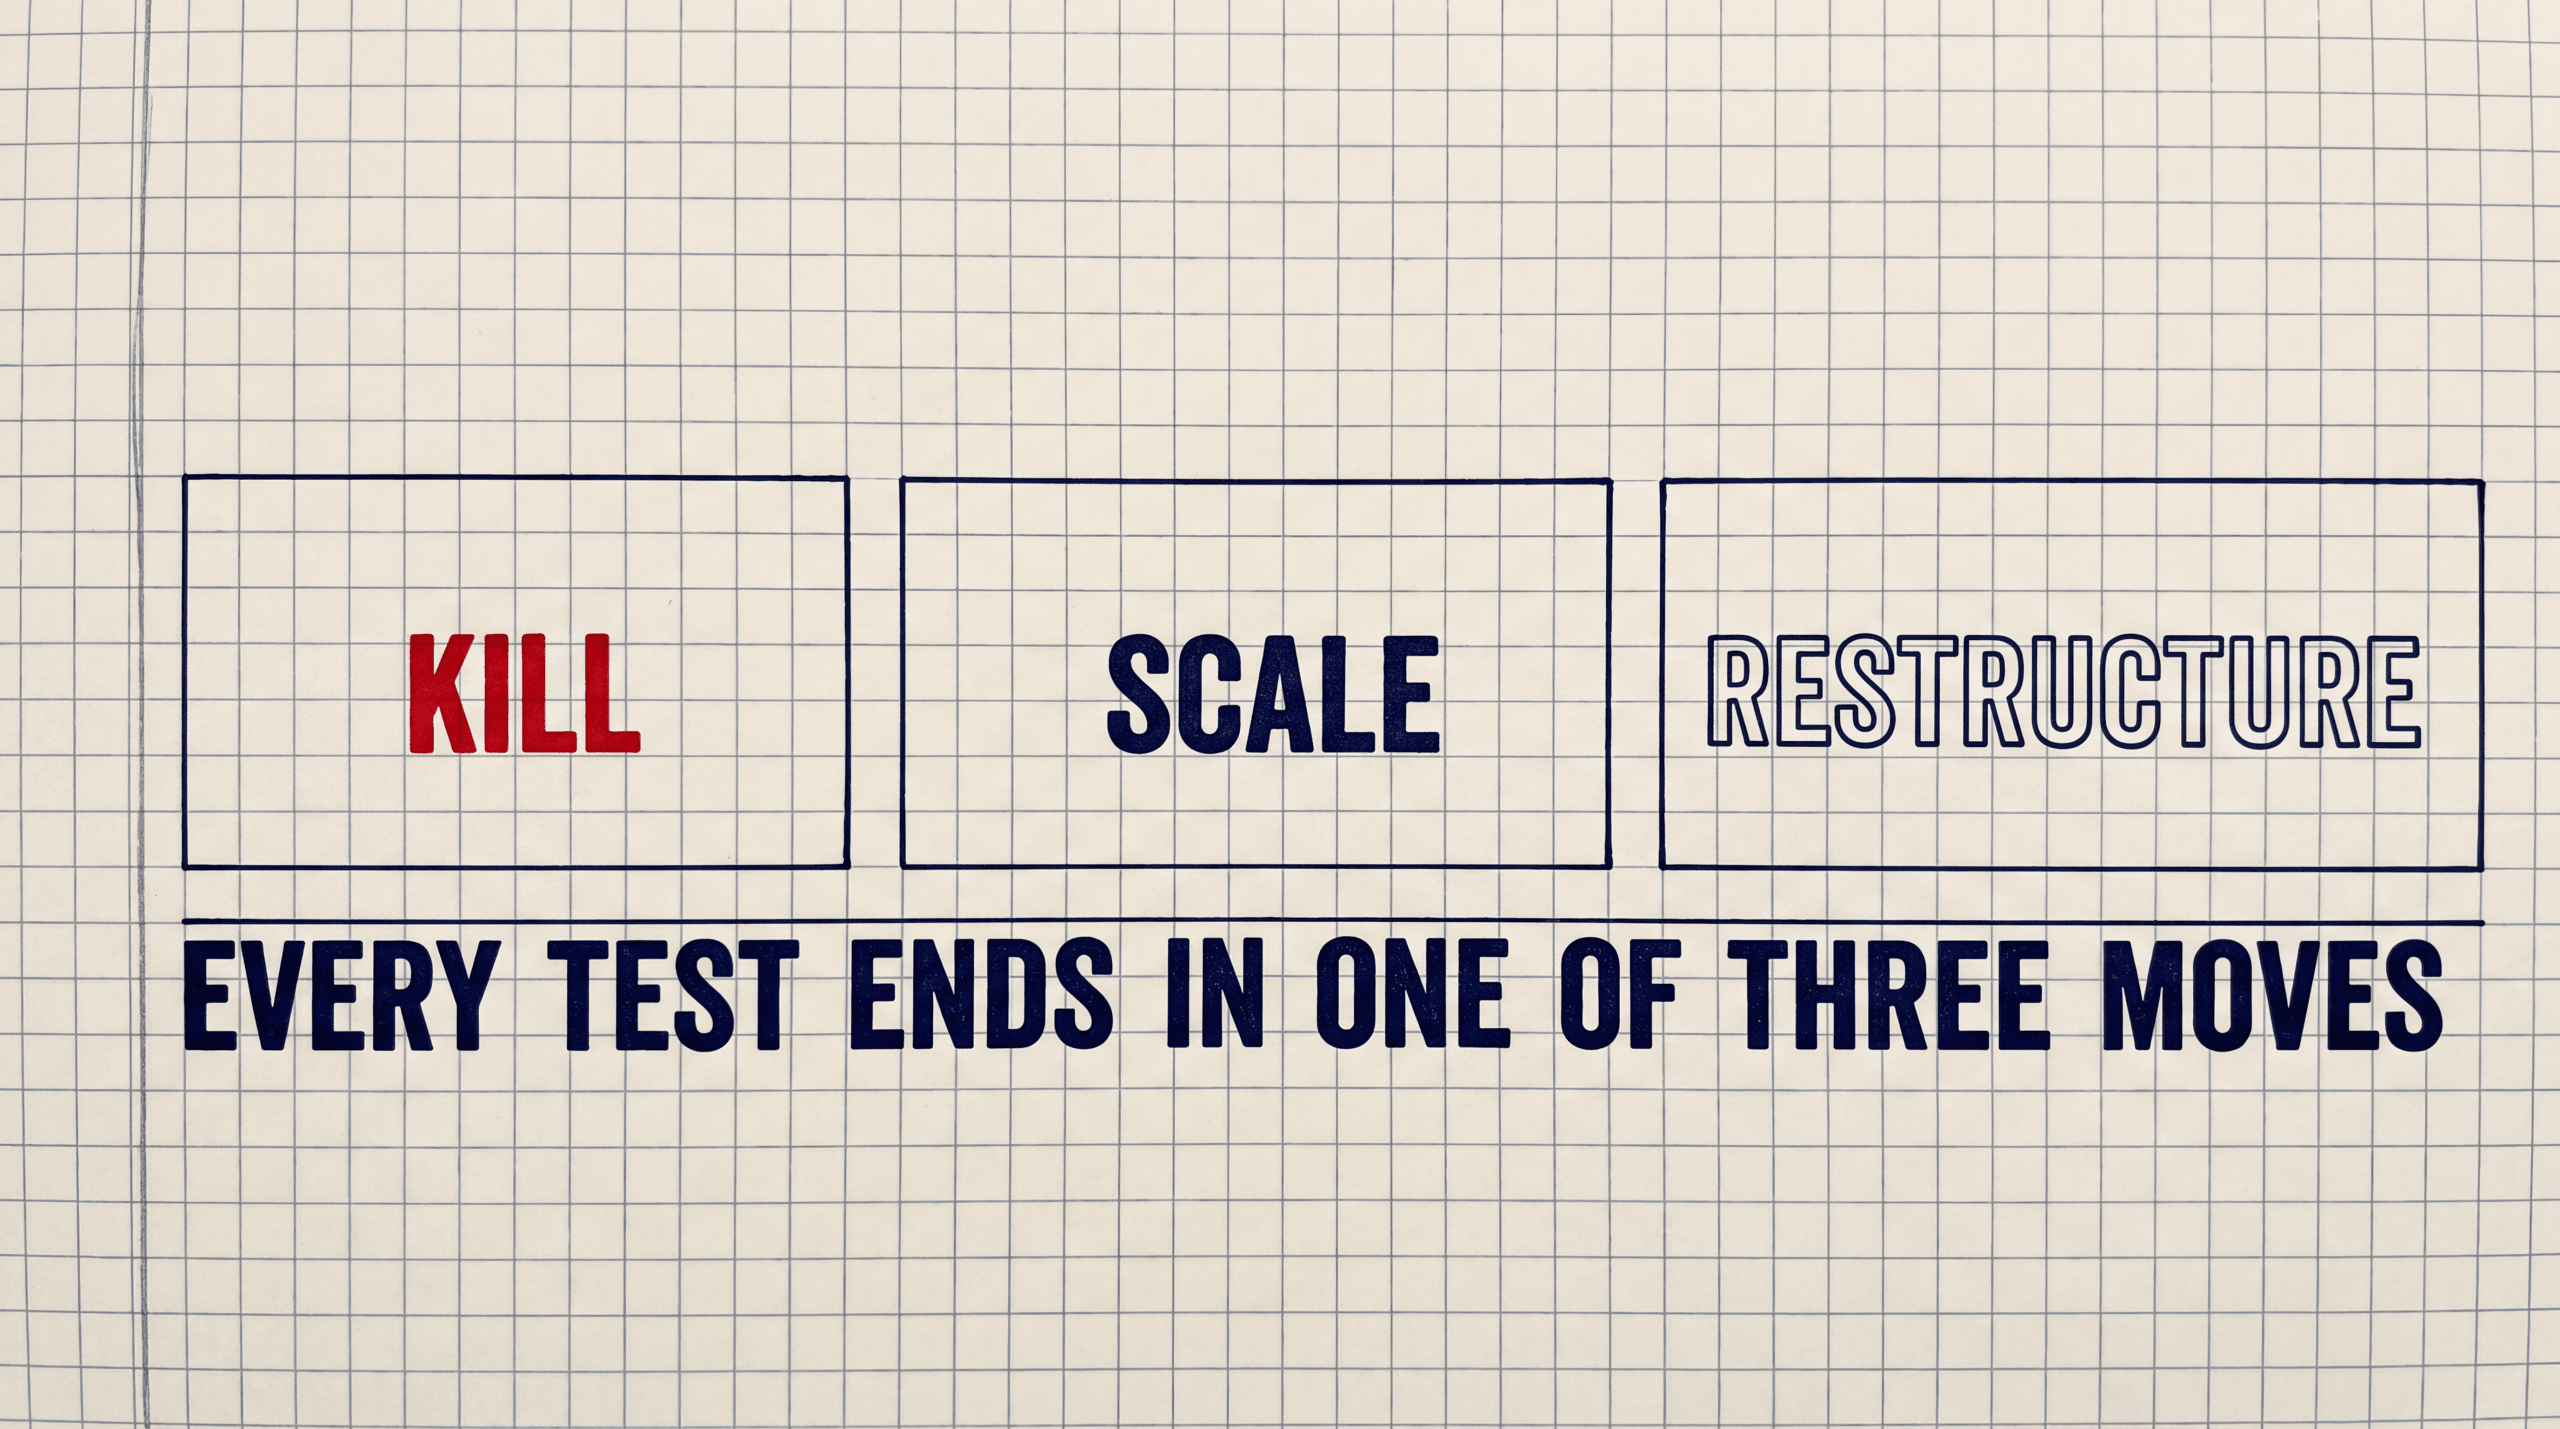
A clean lift report puts you in one of four decision boxes. Here’s the rule of thumb I use. Not a published threshold, just a framework that’s held up across the tests I’ve watched run.
Lift greater than 30% (rule of thumb: scale). The channel is producing more real revenue than the dashboard credits. Raise budget 20 to 30% over the next month and rerun in 90 days to confirm the lift holds at higher spend.
Lift between 15% and 30% (rule of thumb: maintain). The channel is roughly as reported. Don’t add. Don’t cut. Run a creative or audience test next.
Lift between 0% and 15% (rule of thumb: restructure). Most conversions are intercept. Test a different creative angle, audience cut, or bidding strategy. Rerun in 60 days.
Lift at or below 0% (rule of thumb: kill or pause). Pause for 30 days. Every dollar is going to customers who would have bought without the ad. The hard version: the channel might be making your reported ROAS look good while contributing nothing real.
Run one test per major channel per quarter. Four tests a year on Meta, Google, TikTok, and your top affiliate. Each test improves the next budget call. The gains compound across quarters, not because of any single hero number, but because every test removes a question mark from your media plan.
Teams that ship one test never go back to running on reported ROAS alone. Once you’ve seen the gap between what a platform reports and what actually drives sales, you can’t unsee it.
If you’re picking your first test and you only have time for one this quarter, run audience holdout on your largest paid social channel. That’s where the most budget moves on the thinnest evidence. A 15% holdout, 21-day window, single creative cohort. Set the kill-or-scale threshold before the test starts. Write it down. Tape it to your monitor. The number you read when the window closes will either confirm what you already believed or break it. Either way, the next quarter’s budget gets one less guess inside of it. That’s the entire game. One real answer per quarter, four per year, sixteen across the next four years. Most teams never run one.
See incrementality testing run on your real ad data. [Book a demo.](https://hyros.com/book-a-call)
FAQ
What is incrementality testing in simple terms?
Incrementality testing measures whether a marketing channel is actually causing sales or just taking credit for sales that would have happened anyway. You split your audience or geography into two groups. One sees the ads. The other doesn’t. After 14 to 28 days, you compare conversions. The difference is your incremental lift.
Do I need a data scientist to run incrementality testing?
No. The math is complex, but modern attribution tools have absorbed it into the dashboard. Inside Hyros, a marketer can set up a clean holdout test in under 30 minutes: pick a channel, choose audience or geo holdout, set the holdout size, define the window, read the lift report when it closes. No R, no Python, no engineer handoff.
How big should my holdout group be?
For most accounts, 15% is the right starting size. Under 10% produces a confidence interval so wide the result is useless. Channels with under 200 monthly conversions need a 25% holdout. Channels with over 2,000 conversions can run on 10%.
How long should an incrementality test run?
Match the window to your channel’s purchase cycle. Branded paid search runs 14 days. Paid social, 21. Video and YouTube, 21 to 28. Brand, podcast, and PR, 28 to 60. Stopping early to peek is the fastest way to invalidate the test.
What’s the difference between incrementality testing and multi-touch attribution?
Multi-touch attribution maps the customer journey and assigns fractional credit to every touchpoint. It answers “who contributed to this sale.” Incrementality testing runs a controlled experiment to measure causation. Use MTA for ongoing budget allocation. Use incrementality testing periodically to validate that the channels MTA is crediting are actually producing real lift.
Related in This Series
Silo: Attribution Fundamentals