

Churn Attribution: How to Know Which Ads Are Bringing in Customers Who Cancel
Acquisition channel predicts churn. Customers acquired through paid social prospecting cancel at up to 2.6x the rate of customers who arrive through organic search. If you keep scaling the lowest-CPA campaign without tracking what those customers do after purchase, you are optimizing for volume in a leaky bucket, and the leak is funded by your own ad spend.
Key Takeaways
- Paid ad customers churn at 8% per month on average; organic search customers churn at 3% per month. That gap produces a 2.6x LTV difference from channel alone (Lucid.now SaaS unit economics analysis, 2024).
- Referral-acquired SaaS customers churn 20% lower than paid-acquired customers and carry 16 to 25% higher LTV (Harvard Business Review and ProfitWell via GrowSurf aggregation, 2024).
- Discount-acquired customers (greater than 40% off) churn at 2.3x the rate of full-price customers at renewal (ChartMogul analysis, 2023 to 2024).
- Reducing churn from 5% to 3% monthly produces a 67% increase in LTV. A 50% churn reduction yields a 300% LTV increase (Lucid.now, 2024).
- The lowest-CPA campaign is often the most expensive campaign in your account. You only know which is which once churn data is tied back to the original ad source.
Table of Contents
- Why Acquisition Channel Predicts Churn
- How to Identify Your High-Churn Ad Sources
- The Hidden Cost of Optimizing for CPA Alone
- What to Do Once You Find Your Churn Sources
- FAQ
Why Acquisition Channel Predicts Churn
 Most advertisers stop measuring at ROAS. They know what it costs to acquire a customer. They do not know how long that customer stays or how much revenue that customer produces across a 12-month window. CPA optimization, in that posture, is a partial picture at best. At worst, it becomes a mechanism for scaling the worst customers in the account faster than the best.
Lucid.now’s 2024 SaaS unit economics analysis documents paid ad customer churn at 8% per month versus organic search customer churn at 3% per month. At $100 ARPU and 80% margin, that produces LTV of $800 for paid customers and $2,666 for organic customers, a 2.6x LTV gap from channel alone. That is the strongest channel-differentiated churn number available in published research, and it sets the frame for everything else in this article.
Layer in the referral data. GrowSurf’s aggregation of Harvard Business Review and ProfitWell research shows referral-acquired SaaS customers churn 20% lower than paid-acquired customers and carry 16 to 25% higher LTV. That gives you a three-channel hierarchy: paid is worst, organic is middle, referral is best. The acquisition cost order inverts. Referral CAC averages roughly $150 versus paid search CAC near $802 (Wearefounders.uk, 2025), so the best customers are also the lowest-cost to acquire when retention is included in the math.
A quick definitional note before going further. Customer churn (or logo churn) is a count of customers lost over total customers. Revenue churn (or dollar churn) is MRR lost divided by total MRR. Gross Revenue Retention excludes expansion and caps at 100%. Net Revenue Retention includes expansion and can exceed 100%. The 82% B2B median NRR and 49% B2C median NRR referenced later in this piece are NRR figures from ChartMogul’s AI Churn Wave report (2024 to 2025). Conflating these metrics is one of the most common attribution mistakes operators make, and it hides channel-level problems behind blended numbers.
For more on why standard attribution models miss this kind of post-acquisition behavior, see how attribution models miss post-acquisition behavior.
High-intent channels and what they produce
Branded search, referral programs, and SEO-driven organic traffic deliver customers who sought the product deliberately. They understand the offer before they convert. They experience fewer buyer’s remorse cancellations. Their 90-day and 180-day retention rates run systematically higher than paid prospecting cohorts at every price point.
This is measurable, not instinct. Customers who refer others are 3x less likely to churn themselves (Wharton research, via GrowSurf aggregation). Once Hyros connects customer lifecycle events back to acquisition source, the pattern shows up plainly in the account data.
Low-intent channels and the acquisition trap
Broad audience social prospecting, discount-led offers, and top-of-funnel video retargeting produce high conversion volume at low CPA, paired with high churn. The customer converted because the ad was compelling or the offer was aggressive, not because they had genuine product-market fit.
RevenueCat’s State of Subscription Apps 2025 report (29,000+ apps) draws a useful distinction between “tourists,” promotional users who churn quickly, and “locals,” full-price core users who stick. App Store drives 17.6% offer utilization versus 7.3% on Google Play, and introductory offers represent 13.5% of App Store transactions. Those promotional cohorts convert on price, not on product fit, and the churn that follows is predictable rather than mysterious.
Offer structure as an independent churn predictor
ChartMogul analysis shows customers acquired with discounts greater than 40% off churn at 2.3x the rate of full-price customers at renewal. Offer structure predicts churn independently of acquisition channel. When you track both variables against the churn outcome, channel and offer type, you get a granular picture of which channel-offer combinations are producing keepers versus tourists.
Billing cadence works the same way. Annual contracts run roughly 8.5% annual churn while month-to-month agreements run 16% (aggregated SaaS research 2024 to 2025). That is partly a retention effect from longer commitment windows, and partly a selection signal: advertisers who push free-trial-to-monthly conversion are systematically acquiring the higher-churn cohort by design.
How to Identify Your High-Churn Ad Sources
This is the diagnostic section. What does churn attribution actually require to set up, and what does it typically reveal once it is in place?
What churn attribution requires technically
Four things need to be in place:
- Customer-level acquisition source tracking, so each customer is tied to the ad, campaign, and channel that drove the original conversion.
- Post-acquisition event tracking, so cancellations, refunds, lapsed payments, and non-renewals all flow into the same data layer.
- A minimum 90-day post-acquisition window so churn patterns become statistically visible rather than noisy.
- An attribution layer that preserves the customer-to-source link beyond the first purchase event.
Most standard attribution tools lose the customer-to-source connection after the first recorded conversion. Churn attribution needs a tool that follows the full customer lifecycle, which is where Hyros’s cohort report for returning vs. churned customers does the work. Hyros is built for this, tracking subscriptions, upgrades, downgrades, refunds, and cancellations, all attributed back to the exact ad or link that created each customer (Hyros for SaaS, self-reported product capability).
What the data typically shows
Recurly’s 2024 benchmarks across 2,000+ businesses report overall voluntary churn at 2.41%, involuntary churn at 0.86%, and total churn at 3.27%. B2B software runs around 3.8% on average. DTC and consumer subscription categories run 6.5% on average. Education sits near 4.2%. These are blended industry averages, useful only as a baseline against which your channel-level numbers should be measured.
Industry segmentation sharpens the picture. SMB SaaS churn runs roughly 8.2x higher than enterprise SaaS. SMB targets sit under 3% monthly while enterprise targets sit between 0.5% and 0.75% monthly (ChartMogul and OpenView aggregated benchmarks, 2025). A business acquiring heavily from broad paid social prospecting is structurally pulling in more SMB-profile customers, which is the highest-churn segment, before any creative or onboarding work even enters the picture.
The LTV-adjusted ROAS that changes budget decisions
Standard ROAS gives every customer equal weight. LTV-adjusted ROAS does not. If Campaign A acquires customers at $80 CPA with 40% 90-day churn, the effective return is radically different from Campaign B at $120 CPA with 10% 90-day churn, even when first-purchase revenue looks identical on the dashboard.
Lucid.now’s unit economics model captures the financial consequence. At $1,000 CAC and 10% monthly churn, LTV:CAC ratio sits at 0.8x. Every customer acquired is a structural loss. At 6% monthly churn, the same CAC produces a 1.3x ratio, technically positive but with 18+ month payback periods that force the business to operate on forward credit rather than current cash flow. This is the bill that comes due when CPA is optimized without churn visibility.
Want to see what your attribution actually looks like? Book a Hyros demo →
The Hidden Cost of Optimizing for CPA Alone
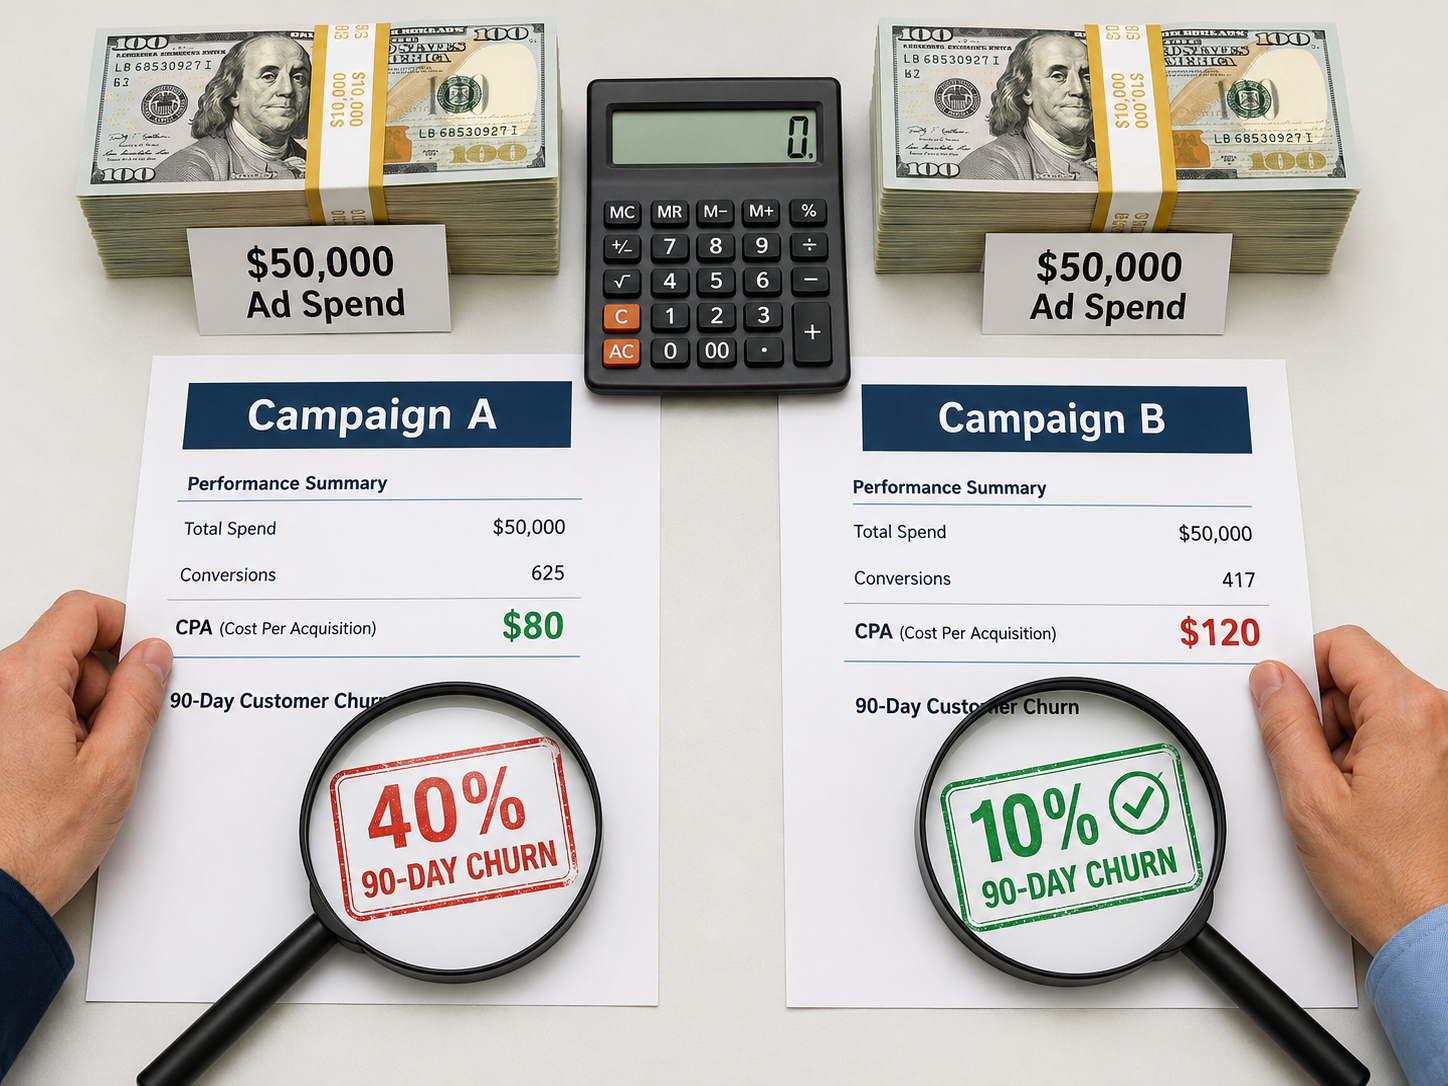 This is where the financial argument becomes concrete. Two illustrative campaigns, same budget, very different outcomes.
Campaign A runs at $80 CPA with 40% 90-day churn, $100 ARPU, 80% margin. Average customer life at that churn rate is roughly 2.5 months. Revenue generated per customer before churn comes to about $200, netting $120 per customer after CAC, before any other costs. Scaled at $50,000 per month in ad spend, you are acquiring 625 customers, and 250 of them cancel within 90 days.
Campaign B runs at $120 CPA with 10% 90-day churn, identical ARPU and margin. Average customer life stretches to about 10 months. Revenue per customer before churn is around $800, netting roughly $680 per customer. At the same $50,000 monthly budget, you acquire 417 customers, and only 42 of them cancel within 90 days.
Campaign A wins on every native platform dashboard. Campaign B produces three to four times more total revenue on the same budget once retention is included. That is the churn attribution gap, and it is the single biggest reason platform-native reporting steers serious operators in the wrong direction.
Lucid.now quantifies the LTV math behind the same dynamic. Reducing churn from 5% to 3% monthly produces a 67% increase in LTV. A 50% churn reduction produces a 300% LTV increase (Lucid.now, 2024). These are not incremental improvements. They are business model-level shifts driven entirely by which customers you bring in. For background on how churn data feeds CAC reduction decisions, see how churn data feeds CAC reduction decisions.
Churn compounds the misallocation
Every dollar scaled into a high-churn campaign produces more churners and reduces budget available for low-churn campaigns. The compound effect is what makes this dangerous at scale. Operators end up scaling the worst-performing segment of the customer base while starving the best, and the trend accelerates as account spend grows.
ChartMogul’s AI Churn Wave Retention Report (3,500 software companies with a $250K ARR minimum, 2024 to 2025) puts median B2B SaaS NRR at 82%. NRR below 100% means existing customers are churning or downgrading faster than they are expanding. Every new customer acquired into that environment has to work harder to compensate for revenue leaking out the back. When the new customer cohort is itself biased toward the highest-churn channels, the back-end leak gets worse, not better.
What to Do Once You Find Your Churn Sources
Diagnosis is only useful when it changes the budget. Here is what to do with churn-by-source data once it is visible.
Cut or reposition high-churn campaigns
Cutting is rarely the right first move. A high-churn campaign often produces real customers alongside the churners, with the creative or offer attracting a mixed audience. A better starting move is to reposition the creative and offer toward higher-intent buyers. Adjust targeting to exclude lookalike audiences with known low-retention profiles once LTV data makes those profiles visible.
Use churn data by ad source to inform new creative development. What messaging, value proposition, and offer structure consistently brings in customers who stay past 90 days? That answer should drive your next round of creative tests, not platform engagement metrics. For the full decision tree on this kind of judgment call, see the framework for deciding which campaigns to cut or scale.
Invest more in verified low-churn sources
Low-churn campaigns with higher CPA tend to be underinvested because they look expensive on a per-acquisition basis. They are inexpensive on a per-retained-customer basis. Shift budget toward them at the higher CPA and measure the change in revenue per dollar spent over 90 and 180 days, not the change in first-purchase ROAS over seven days.
Referral programs remain the strongest available case. Referral CAC averages roughly $150 versus paid search CAC around $802 (Wearefounders.uk, 2025), and referral-acquired customers churn 20% lower with 16 to 25% higher LTV. The economics are better on every dimension once LTV is folded in. For the call-funnel and high-ticket variant of this same problem, where ad source determines not just retention but call show rate and closed-deal value, see Call Funnel LTV Tracking: How to Identify Which Ads Produce Your Highest-LTV Customers.
Use churn data to improve onboarding for high-churn segments
If you cannot immediately cut high-churn acquisition sources, you can usually improve the onboarding experience for customers acquired through them. Early engagement intervention works as a second line of defense, particularly for cohorts that converted on price rather than product fit.
Hyros frames its product around this exact problem. The company describes its tool as a way to “know who pays more, churns less, and stays longer, and get more of them” (Hyros for SaaS). That is the layer that makes churn-by-source visible in the first place. Without it, creative changes and onboarding tweaks are speculative rather than measurable.
The three actions above are not mutually exclusive. Most operators run all three in parallel once they can see the channel-level data clearly. The ones who never see that data keep optimizing for the wrong signal and keep scaling the wrong customers.
FAQ
Does the acquisition channel affect customer churn?
Yes. Acquisition channel is one of the strongest predictors of post-purchase behavior. Paid ad customers churn at roughly 8% per month on average; organic search customers churn at 3%. Referral-acquired SaaS customers churn 20% lower than paid-acquired customers (Lucid.now and GrowSurf research, 2024). The gap between best and worst sources often reaches 2x to 4x.
How do I find out which ads produce customers who cancel?
Churn attribution requires tracking three things together: the original ad source for each customer, post-purchase cancellation or non-renewal events, and the time elapsed between acquisition and churn. Standard attribution tools lose the customer-to-source link after the first event. A tool like Hyros maintains that link and ties cancellations back to the original campaign.
What is the relationship between ad source and customer LTV?
Ad source predicts LTV because different sources attract customers at different intent levels and product-fit levels. Organic search customers at 3% monthly churn produce 2.6x more LTV than paid social customers at 8% monthly churn, at identical ARPU. The LTV gap between sources frequently exceeds the CPA gap, which makes channel the most important attribution dimension for recurring revenue.
How do I reduce churn from paid ads?
Three approaches work in combination. Identify high-churn sources through churn attribution and reposition or cut spend. Invest more in verified low-churn sources even at higher CPA. Improve early onboarding for cohorts acquired through high-churn sources to reduce first-30-day abandonment. Accurate churn attribution by ad source is the prerequisite for all three.
How does Hyros track customer lifetime value?
Hyros tracks customer revenue over time and ties it back to the original ad source, including subscriptions, upgrades, downgrades, refunds, and cancellations (Hyros for SaaS). When a customer cancels, Hyros attributes that event to the acquisition campaign. Over time this produces churn rate and LTV data segmented by ad source, campaign, creative, and channel, which platform-native reporting cannot match.
What is the difference between customer churn and revenue churn?
Customer churn (or logo churn) counts customers lost over total customers. Revenue churn (or dollar churn) measures MRR lost over total MRR. A business can lose 10% of logos while losing only 3% of revenue if the churned customers were all small accounts, so the two metrics should never be conflated when evaluating channel performance.
Stop Guessing Which Campaigns Are Subsidizing Cancellations
Stop optimizing for what the platforms tell you. Start optimizing for what is actually driving revenue.
Book your Hyros demo → or See how it works →