
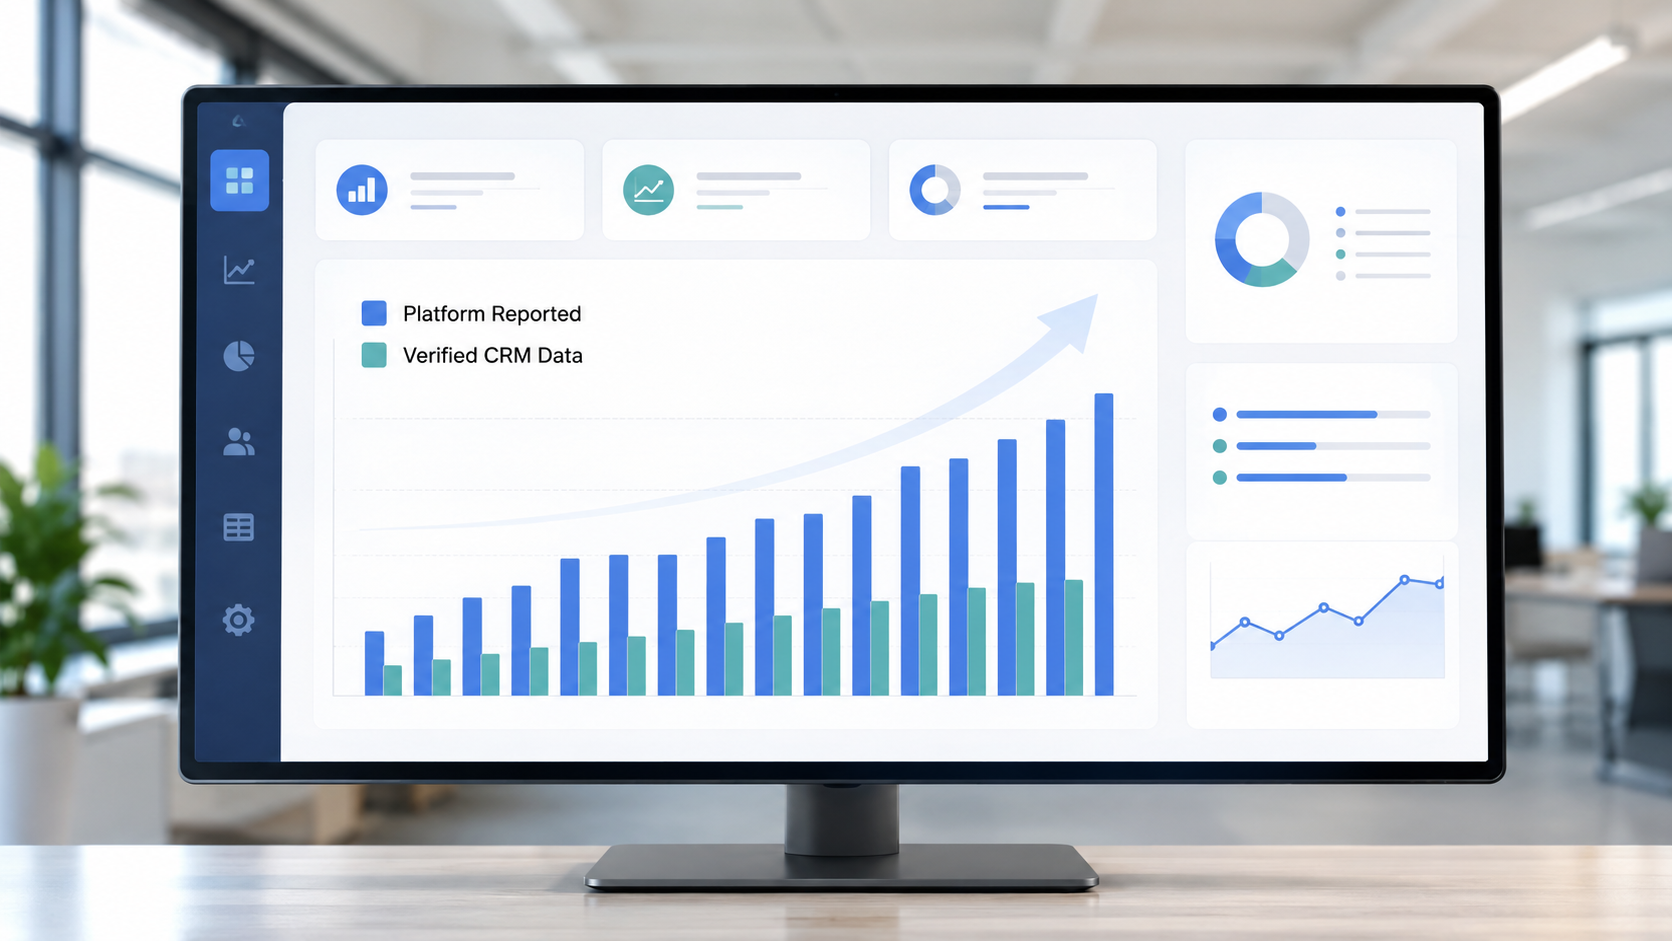
How Better Attribution Reduces Your Customer Acquisition Cost (Without Cutting Budget)
Customer acquisition cost optimization rarely fails because operators are spending too much. It fails because they are scaling campaigns based on platform data that overstates performance. Accurate attribution identifies which campaigns produce verified customers at the lowest real cost, then shifts budget toward them. Total spend holds. CAC drops.
Key Takeaways
- $75 billion in ad spend was wasted on invalid traffic globally in 2024, a 33% increase from 2022 (Lunio Wasted Ad Spend Report 2024). That waste inflates reported conversions and makes real CAC invisible.
- One agency measured a 57% gap between Shopify sales data and Facebook-reported conversions after iOS 14.5 rolled out in April 2021 (Elumynt, 2021). The mechanics that produced that gap have not gone away.
- A national telecom company working with AMP Analytic reduced CAC from $163 to $64 per new line, a 61% drop, through targeting reallocation alone, with no budget cut (AMP Analytic case study).
- Multi-touch attribution improves CPA efficiency by 14% to 36% depending on channel mix, and organizations moving from single-touch to multi-touch see a 22% average increase in budget efficiency (Marketing LTB, 2025, industry survey level, use directionally).
- Lower CAC is not about spending less. It is about spending on what is actually working.
Table of Contents
- Why Your Real CAC Is Higher Than Your Platform Reports
- The Three Budget Leaks That Inflate CAC
- How Attribution Data Identifies and Closes Each Leak
- What CAC Looks Like After Attribution Is Accurate
- Frequently Asked Questions
Why Your Real CAC Is Higher Than Your Platform Reports
Platform-reported CPA uses platform-attributed conversions as the denominator. When platforms over-attribute through view-through credit, double-counting across channels, and modeled conversions, that denominator inflates. CPA looks lower than it is. The operator optimizes to a number that does not exist. This is the same compounding problem that surfaces when you push spend higher without an independent measurement layer, which we cover in detail in our piece on how attribution errors compound as you scale.
After iOS 14.5 rolled out in April 2021, one agency reported a 57% gap between Shopify sales data and Facebook-reported conversions, with Facebook ROAS falling from 3.13 (February to April 2021) to 1.93 (July to September 2021) (Elumynt, 2021). The iOS 14 window was historical, but the underlying mechanics, view-through inflation and cross-platform double-counting, are still active in 2026 under Meta’s current 7-day click and 1-day view default.
Platform CPA vs. Real CAC: What the Gap Looks Like
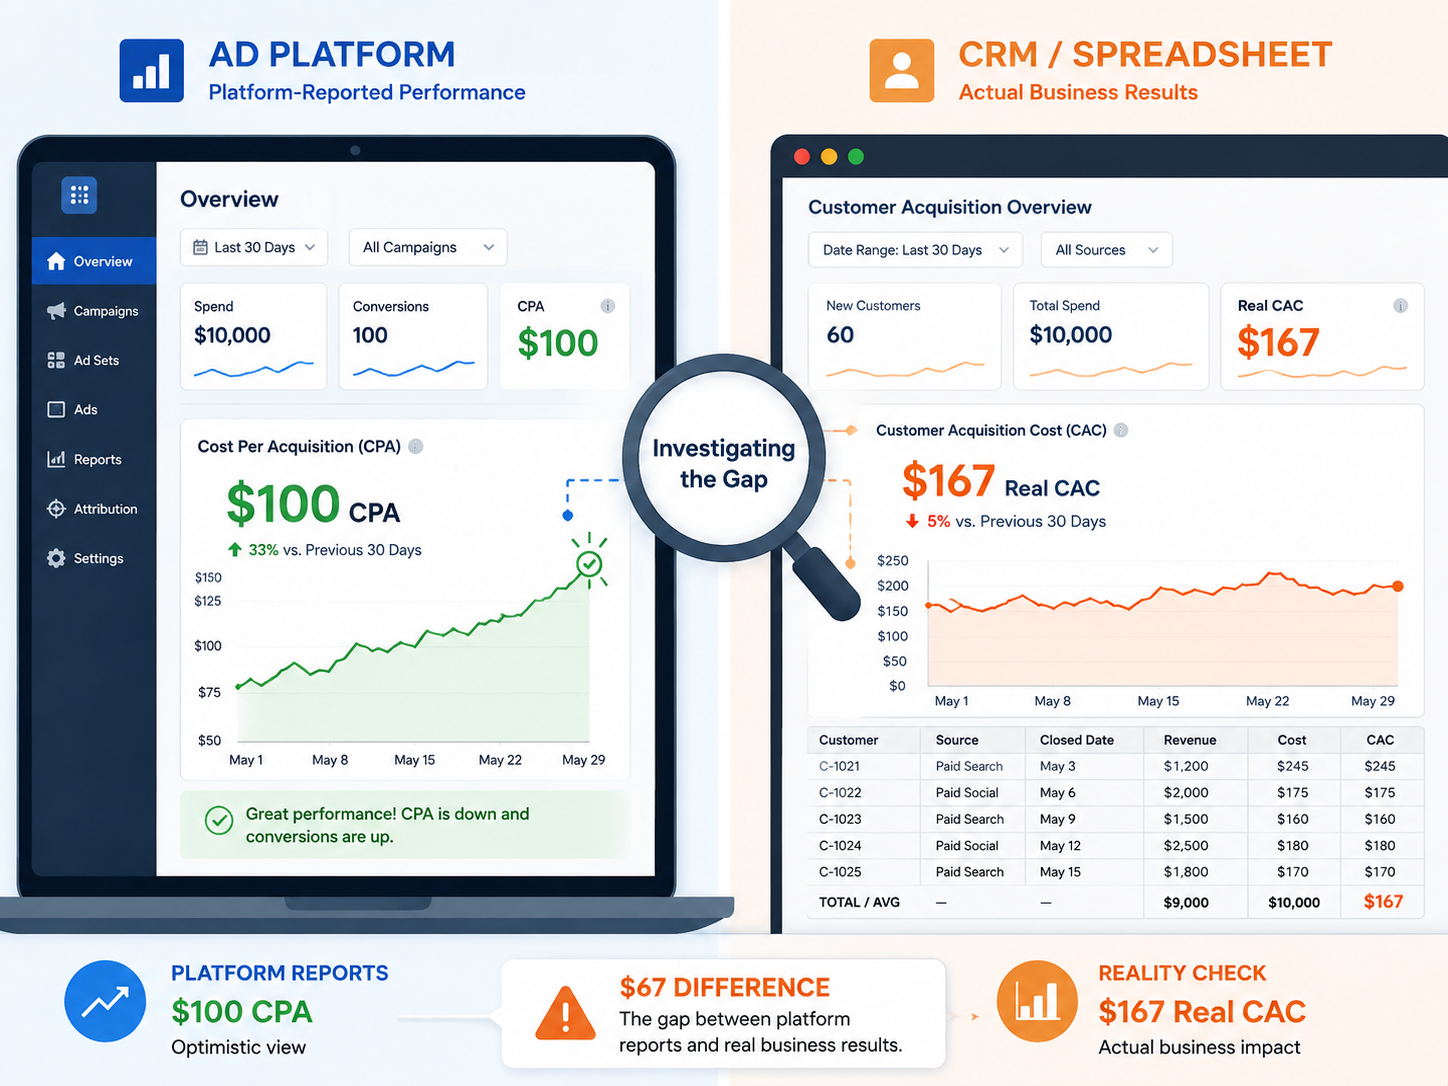 Walk through the math. Meta reports 100 conversions on $10,000 in spend. Platform CPA reads $100. Your CRM, on the other hand, shows 60 verified purchases tied to that campaign. Real CAC is $167. That is 67% higher than what Ads Manager shows. The operator optimizing to the $100 number is optimizing to a fiction.
True CAC is total ad spend divided by the number of verified new customers acquired in the same period. The denominator must come from a CRM or payment processor, not a platform pixel. If you have never reconciled platform numbers against back-end revenue, you are almost certainly working with an inflated picture of efficiency. That gap is exactly what platform over-reporting actually costs operators once the dollars are added up.
What “Verified Purchases” Means in Practice
Verified purchases are revenue events confirmed in a CRM, payment processor, or order management system. They are not conversion events reported by a platform pixel. For most operators running multi-channel campaigns, real CAC is meaningfully higher than platform-reported CPA because of attribution over-counting. The size of the gap varies by channel mix, funnel length, and iOS signal loss. The gap itself is always present.
Two CAC numbers matter, and they are not interchangeable. Blended CAC is total marketing spend divided by total new customers. Paid CAC is paid spend divided by paid-attributed customers. For an operator spending $20,000 or more per month on paid acquisition, the blended CAC problem is almost entirely a paid attribution problem. Fix the paid measurement layer and blended CAC moves with it.
The Three Budget Leaks That Inflate CAC
Each leak below is concrete. There is a mechanism and a fix, no hand-waving. The macro context: $75 billion in ad spend was wasted on invalid traffic globally in 2024 (Lunio Wasted Ad Spend Report 2024). That figure represents 8.5% of all paid traffic across major channels, or roughly one in every 12 visits. Non-Google channels averaged 17.5% invalid traffic. Google averaged 5.5%. LinkedIn hit 25% invalid. TikTok hit 24.2%. X came in at 12.79%. Invalid traffic registers as conversions inside platform reporting, which is part of why platform CPA looks better than verified CAC.
Leak 1: Scaling Campaigns With Inflated ROAS
When a campaign’s ROAS is inflated by view-through attribution or modeled conversions, it gets more budget. That additional budget is not producing the revenue the platform claims. Real CAC on the campaign is higher than reported, and pouring spend into it accelerates the gap.
The fix is to verify ROAS against back-end revenue before scaling any campaign. A SaaS startup that flagged a campaign with CAC 30% above account average reallocated budget and produced a 12% blended CAC reduction (Zigpoll citing ProfitWell, illustrative pattern, no named company).
Leak 2: Retargeting Customers Who Would Have Bought Anyway
Retargeting converts users with high existing purchase intent, including users who would have purchased without the ad. Platforms credit those conversions to retargeting and report artificially low CPAs. Incrementality testing reveals the gap between what retargeting claims and what it actually drives.
Channel-level LTV: CAC tells the same story from a different angle. A brand with a blended LTV: CAC of 3.8:1 can have Meta prospecting running at 2.4:1 and Google Brand running at 9:1 inside the same account (Finsi.ai, 2025, Scentbird referenced as illustrative). The blended number hides that a meaningful portion of prospecting is below the sustainable threshold. Shifting 15% to 20% of spend from under-performers to strong performers moves the blended ratio more than any creative test.
Leak 3: Misallocating Spend Across Channels
Budget allocated to a channel that is not actually driving conversions reduces budget available for channels that are. When attribution is wrong, channel allocation is wrong. The highest-CAC channel often receives disproportionate budget because it is best at claiming credit from the platform’s perspective.
The anchor example here is AMP Analytics’ national telecom client. The company reduced CAC from $163 to $64 per new line, a 61% drop, by switching from broad direct mail lists to prospect lists built with localized demographic modeling (AMP Analytic). No budget cut. The mechanism was targeting reallocation based on better data. The channel was direct mail, not paid social, but the principle is the same: when measurement gets sharper, dollars move toward what actually produces customers, and CAC drops without total spend changing.
Want to see what your attribution actually looks like? Book a Hyros demo →
How Attribution Data Identifies and Closes Each Leak
This is where the reader moves from understanding the problem to seeing the operational fix. Each leak above has a measurable counter.
Fix for Leak 1: Verify ROAS Before Scaling
With a third-party attribution layer, you compare what each platform claims against what your back-end confirms. Campaigns that do not survive that reconciliation do not get more budget. Server-side tracking improves data accuracy by 13% to 27% versus browser-based pixel tracking (Marketing LTB, 2025, directional). That accuracy gain is what makes the reconciliation reliable enough to act on.
The practical workflow is to set a verification threshold. If platform-reported ROAS exceeds back-end ROAS by more than a defined margin, the campaign goes on hold for review before any budget increase. We walk through a full version of that decision logic in our data-driven framework for cut-or-scale decisions.
Fix for Leak 2: Multi-Touch Attribution to Right-Size Retargeting
Multi-touch attribution improves CPA efficiency by 14% to 36% depending on channel mix, and organizations transitioning from single-touch to multi-touch realize an average 22% increase in budget efficiency (Marketing LTB, 2025, directional). With cross-channel attribution in place, retargeting audiences get evaluated on incrementality, not on click-through credit. Spend on retargeting cohorts that would have purchased anyway gets cut or capped, and that budget moves to prospecting that is genuinely producing new customers.
Fix for Leak 3: Channel-Level Attribution for Reallocation
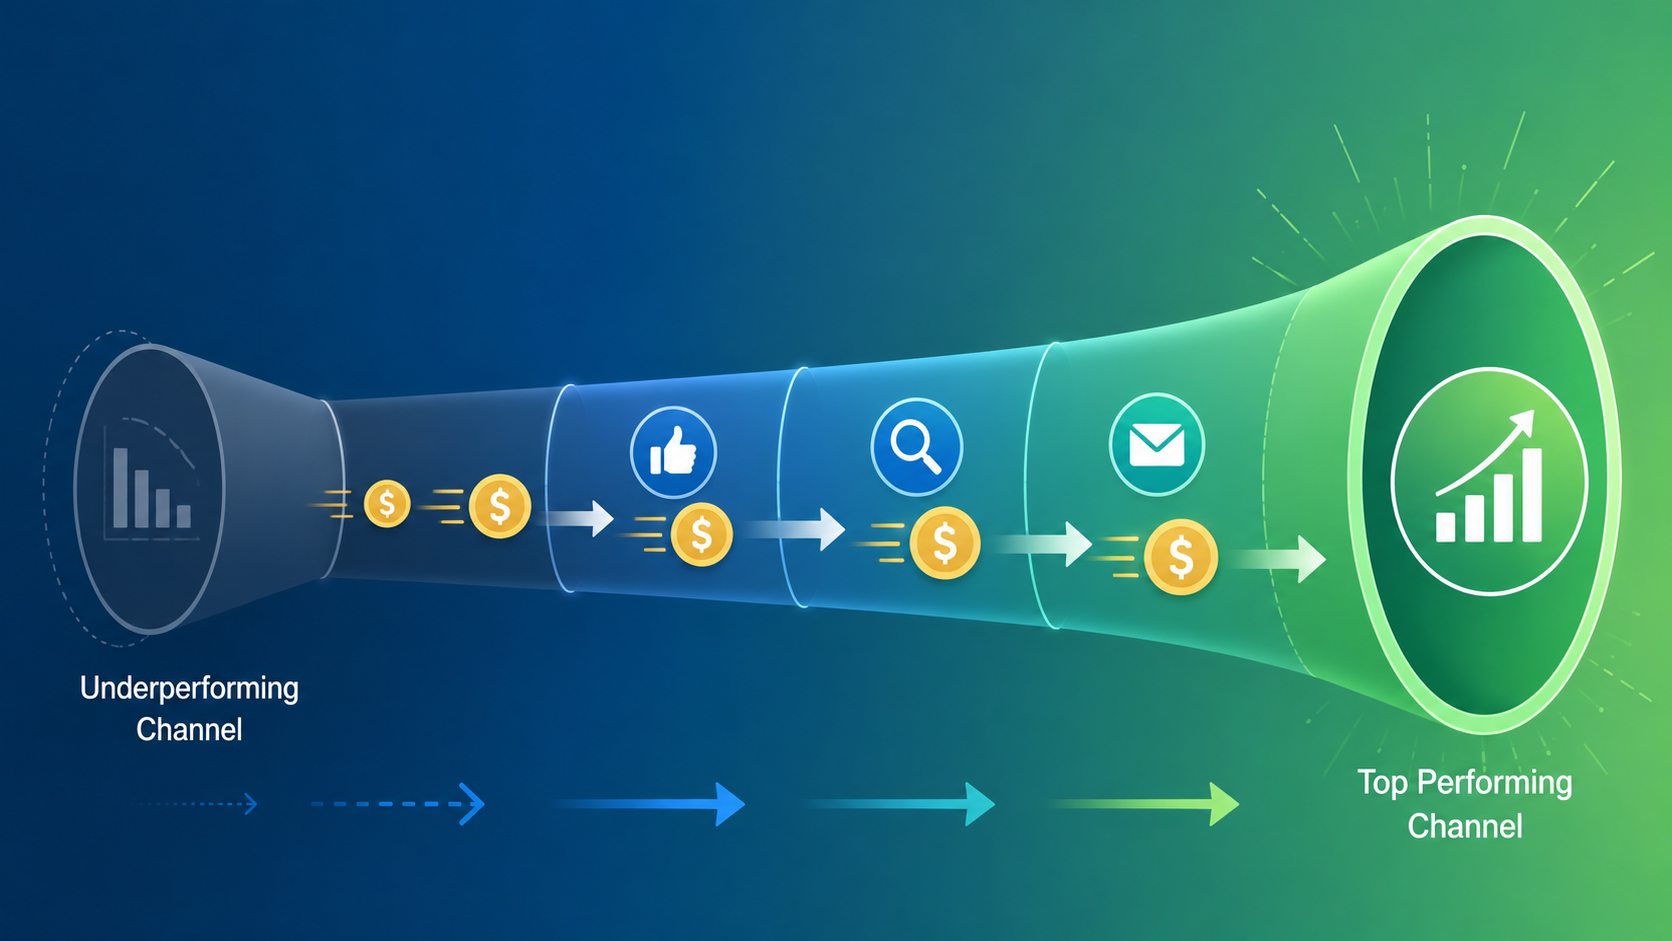 Cross-channel attribution shows what each channel actually contributed to verified purchases, not what each platform claims. Industry research shows proper attribution reduces wasted ad spend by 27% on average and improves budget accuracy by 19% (Marketing LTB, 2025, directional). Once the picture is accurate, reallocation is straightforward: dollars move from over-claimers to under-claimers.
The published benchmarks for sustainable economics are well-known. The 3:1 minimum LTV:CAC ratio holds across most industries. SaaS healthy range is 3:1 to 5:1. The e-commerce healthy range is 2:1 to 4:1 (Prefinery, 2024). Above 5:1 may indicate under-investment in growth. Attribution data is what makes these ratios calculable per channel rather than only at the blended level.
What CAC Looks Like After Attribution Is Accurate
The macro pressure on CAC is real. Median SaaS CAC payback period was 18 months in 2024, up from 14 months the year before, a 29% YoY increase (Benchmarkit 2025 via First Page Sage). Google Shopping CPCs rose 33.72% year over year to $3.49 per click in 2025 (WordStream 2025). CAC across tracked industries is up 222% over eight years (Paddle and SimplicityDX via Genesys Growth, directional). The macro environment is inflating CAC. Better attribution is not a nice-to-have against that backdrop. It is the only lever operators control.
Ninety days after implementing accurate attribution, a typical account looks like this:
- Some campaigns get cut because they were scaling losses.
- Some campaigns get more budget because they were under-credited.
- Retargeting budgets get rightsized against incrementality, not click-through credit.
- Channel allocation shifts toward verified performers.
- Net result: same or lower total spend, same or higher verified revenue, lower real CAC.
Hyros reports at least a 15% AD ROI increase on average for its customers (Hyros, company-reported). One Hyros customer, the CEO of Regenalight, identified $80,000 to $100,000 per month in wasted Facebook ad spend after implementing Hyros, then grew revenue from $1 million to $3 million per month in Q4 after reallocating (Hyros published results, self-reported, no independent audit). Hyros also captures up to 50% more ad attribution depending on funnel and channel mix (Hyros call tracking, company-reported).
The pattern across these examples is consistent. Better attribution does not lower CAC by lowering spend. It lowers CAC by exposing which spend was producing customers and which was producing platform-reported conversions that never showed up in the CRM. That visibility is what lets operators cut wasted ad cost without slashing budget.
Frequently Asked Questions
What is a good customer acquisition cost for paid ads?
Benchmarks vary by industry, margin, and LTV. For DTC ecommerce, blended CAC typically falls between $53 and $91 by vertical (First Page Sage, 2025). For B2B SaaS, median CAC payback hit 18 months in 2024. More important than the absolute number: is your reported CAC based on verified purchases or platform-attributed conversions?
How does attribution data reduce customer acquisition cost?
Accurate attribution identifies which campaigns produce verified purchases at the lowest cost and which claim credit for conversions they did not drive. Budget shifts toward verified performers. That reallocation, not additional spend, is how attribution reduces CAC. The same or lower budget produces more real conversions, which lowers your verified cost per customer.
Why is my customer acquisition cost increasing?
CAC rises when you scale budget based on platform data that overstates performance. As spend grows on campaigns that are not actually producing conversions, real CAC climbs while platform-reported CPA stays flat. The gap between Ads Manager CPA and verified CAC is the indicator. If the gap is growing, attribution is the issue.
How do I calculate real CAC across multiple channels?
True CAC is total ad spend across all channels divided by the number of verified new customers acquired in the same period. The denominator must come from your CRM or payment processor, not platform-reported conversions. For multi-channel accounts, a third-party attribution layer that deduplicates conversions across all platforms makes this calculation systematic rather than manual.
What is the difference between CAC and CPA?
CPA is platform-reported: spend divided by the conversions a platform claims. CAC is verified: spend divided by actual new customers confirmed in your back-end systems. For most multi-channel accounts, real CAC runs meaningfully higher than platform CPA because of attribution over-counting through view-through credit, modeled conversions, and cross-platform double-counting.
Stop Optimizing for the Wrong Number
Stop optimizing for what the platforms tell you. Start optimizing for what is actually driving revenue. Hyros is built for operators who are serious about their data. Book your Hyros demo → or See how it works →.