
First-Touch vs. Last-Touch vs. Linear Attribution: Which Model Is Right for Your Funnel?
Switch attribution models inside Google Ads and your top campaigns reshuffle. The "winners" become "losers." First-touch, last-touch, and linear attribution each assign conversion credit differently, which produces different pictures of funnel performance and different budget decisions. There is no universally correct model. The right choice depends on funnel length and touchpoint count. For complex, multi-channel funnels, multi-touch and data-driven attribution are the correct direction.
Key Takeaways
- As of September 2023, Google deprecated four rule-based attribution models (First Click, Linear, Time Decay, Position-Based) across Google Ads and GA4. Only two remain selectable: Data-Driven (the default) and Last Click. (Search Engine Land, 2023)
- Meta’s default attribution window in 2026 is 7-day click and 1-day view. The 7-day view and 28-day view windows were permanently removed on January 12, 2026. On March 3, 2026, Meta tightened click-through attribution to require an actual link click. (Dataslayer, 2026; Jon Loomer Digital, 2026)
- The same three-touchpoint customer journey produces four entirely different credit assignments under four models. Model selection is a budget decision, not just a reporting preference.
- Do not pick a “best” model. Pick the one that answers your specific business question. Multi-touch or data-driven attribution is the right direction for any funnel with more than three touchpoints and a consideration cycle longer than seven days.
- Platform-native models cannot see cross-channel paths. That is a structural limit of walled-garden attribution, not a model configuration problem.
Table of Contents
- How Each Attribution Model Works (and Who It Favors)
- The Same Customer Journey Through Multiple Models
- Which Model Fits Your Funnel Type
- Beyond Single-Model Attribution: The Case for Data-Driven
- FAQ
How Each Attribution Model Works (and Who It Favors)
Attribution model selection always has a winner and a loser inside your campaign portfolio. Change the model and you change which campaigns look profitable, which look weak, and which ones quietly get the budget cut. That is also why this question affects how model selection affects reported CAC before any optimization work begins.
Six models dominate the conversation. The definitions below are the ones to use:
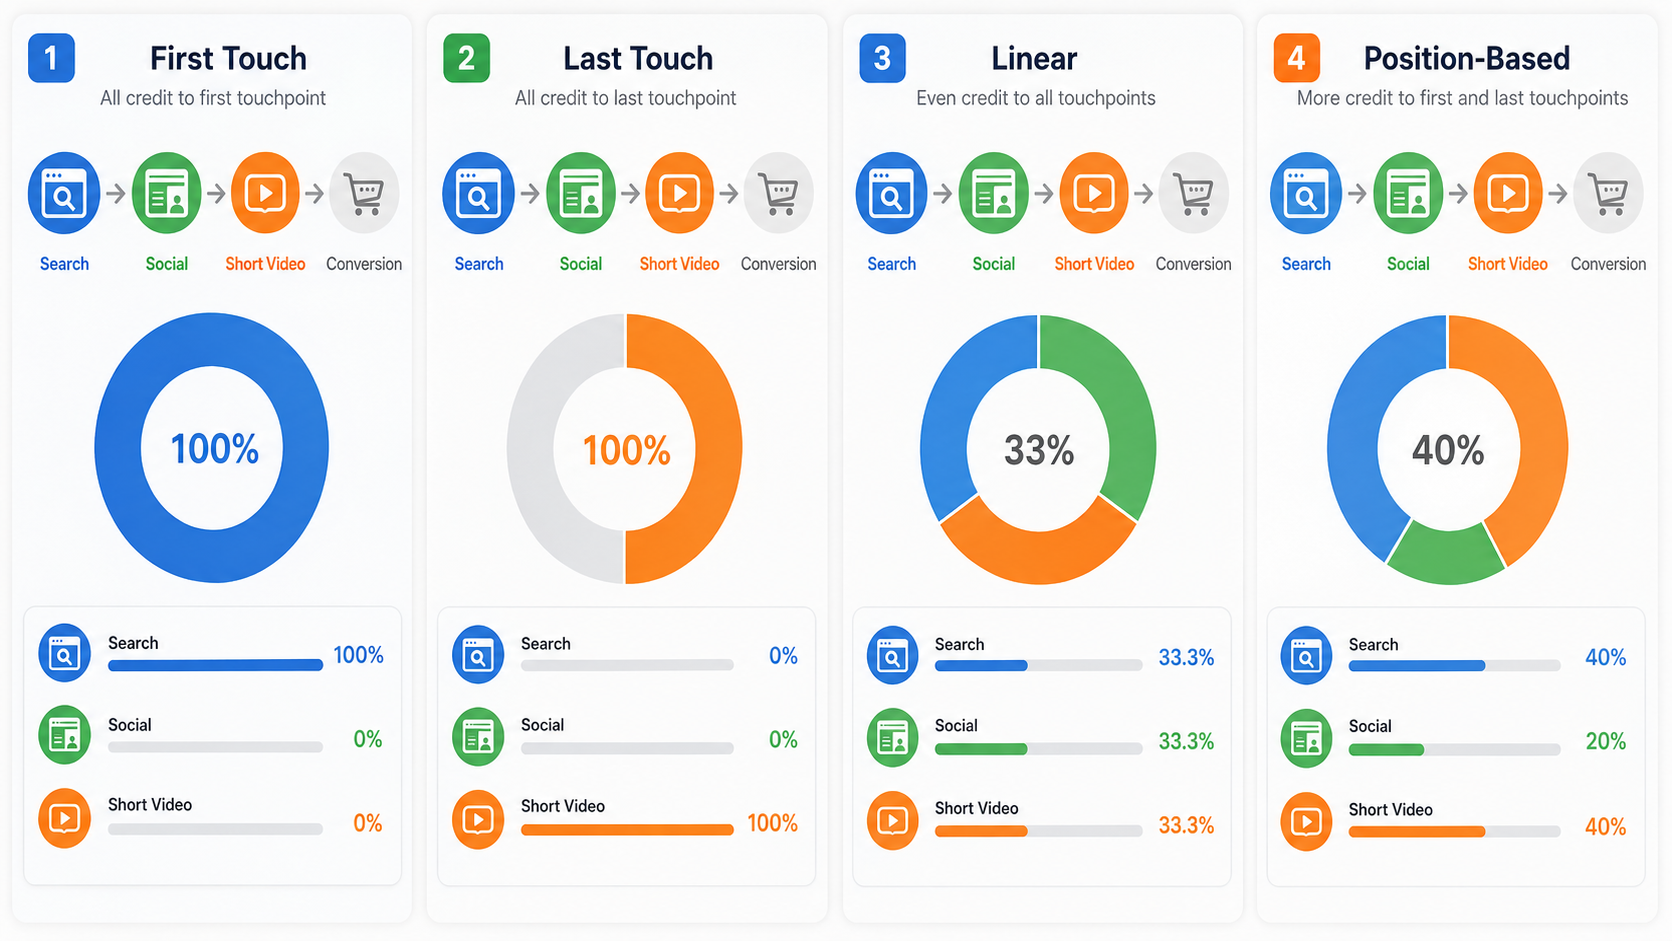
- First-touch: 100% credit to the first ad the customer ever clicked or saw.
- Last-touch: 100% credit to the last ad before conversion.
- Linear: Credit distributed equally across every touchpoint.
- Time-decay: More credit to touchpoints closer to conversion.
- Position-based (U-shaped): 40% to first touch, 40% to last touch, 20% split across middle.
- Data-driven: ML model assigns credit based on historical conversion path patterns.
First-touch attribution
First-touch gives 100% credit to the first ad the customer ever clicked or saw. The ad, channel, or content that introduced the customer to the brand takes everything. Everything that happened after that gets ignored.
Who it favors: awareness campaigns, podcast ads, top-of-funnel social, and brand spend. First-touch models consistently overvalue awareness and undervalue conversion-stage campaigns.
When it is defensible: when the question you are actually trying to answer is “which channel is driving initial awareness and new pipeline?” Used in isolation for budget allocation, first-touch produces poor decisions. It ignores everything that happened between the first impression and the sale.
Last-touch attribution
Last-touch gives 100% credit to the last ad before conversion. The final touchpoint, the one closest to the purchase, takes everything.
Who it favors: retargeting, branded search, bottom-of-funnel offers. Last-touch models consistently overvalue conversion-stage campaigns and undervalue the upper-funnel spend that warmed the buyer in the first place.
When it is defensible: for direct-response, single-channel campaigns where the consideration cycle is short and the path is simple. Think one to three touchpoints, conversion within one to three days. For complex multi-touch funnels, last-touch systematically undervalues the channels that did the real work.
Important Google Ads context: Google deprecated Last Click as the default and migrated all accounts to data-driven attribution in September 2023.
Last Click is still selectable, but Google’s own stated rationale was that fewer than 3% of conversion actions were still using the deprecated rule-based models at the announcement (Ruler Analytics, 2023). On Google, the single-touch debate is largely settled.
Linear attribution
Linear distributes credit equally across every touchpoint. Three touchpoints means 33.3% each. Five touchpoints means 20% each.
Who it favors: no campaign type specifically, which is why people often describe linear as “fair.” It is also imprecise. Linear assumes every touchpoint contributed equally, and that is almost never true. A customer who saw five brand impressions before clicking one search ad did not have the same journey as a customer who clicked the same search ad twice and converted.
When it is defensible: as a baseline. Running linear alongside first-touch and last-touch reveals how much model choice alone is reshaping your budget signals without pretending linear is the “right” answer.
Time-decay attribution
Time-decay gives more credit to touchpoints closer to conversion. Earlier touches still receive some credit, but at a diminishing rate relative to recency.
Who it favors: conversion-stage campaigns and channels that show up late in the journey. It undervalues awareness campaigns that appear early. Time-decay is useful for funnels where the final two or three touchpoints genuinely carry more decision weight than the earlier exposures.
Position-based (U-shaped) attribution
Position-based gives 40% to first touch, 40% to last touch, 20% split across middle. The discovery moment and the close each get heavy weighting, with the nurture touchpoints sharing the remainder. Hyros’s U-shaped attribution model applies this same weighting across the full cross-channel path.
Who it favors: awareness campaigns and conversion campaigns at the same time. U-shaped acknowledges that both the discovery moment and the close matter, while still recognizing the middle of the funnel. It is a reasonable middle ground for funnels where both awareness and direct-response spend are material.
Data-driven attribution
Data-driven attribution is an ML model that assigns credit based on historical conversion path patterns across the advertiser’s own account data. There is no fixed formula. Weights vary per account and update as new conversion data comes in.
Who it favors: in theory, the channels and touchpoints that genuinely contribute to conversion. In practice, the model needs enough conversion volume to detect meaningful patterns. Google’s own stated finding is that switching to data-driven attribution typically yields a 6% conversion increase for advertisers (Search Engine Land citing Google, 2023). Treat that figure with the caveat that it is Google’s own number, not independent research.
The Same Customer Journey Through Multiple Models
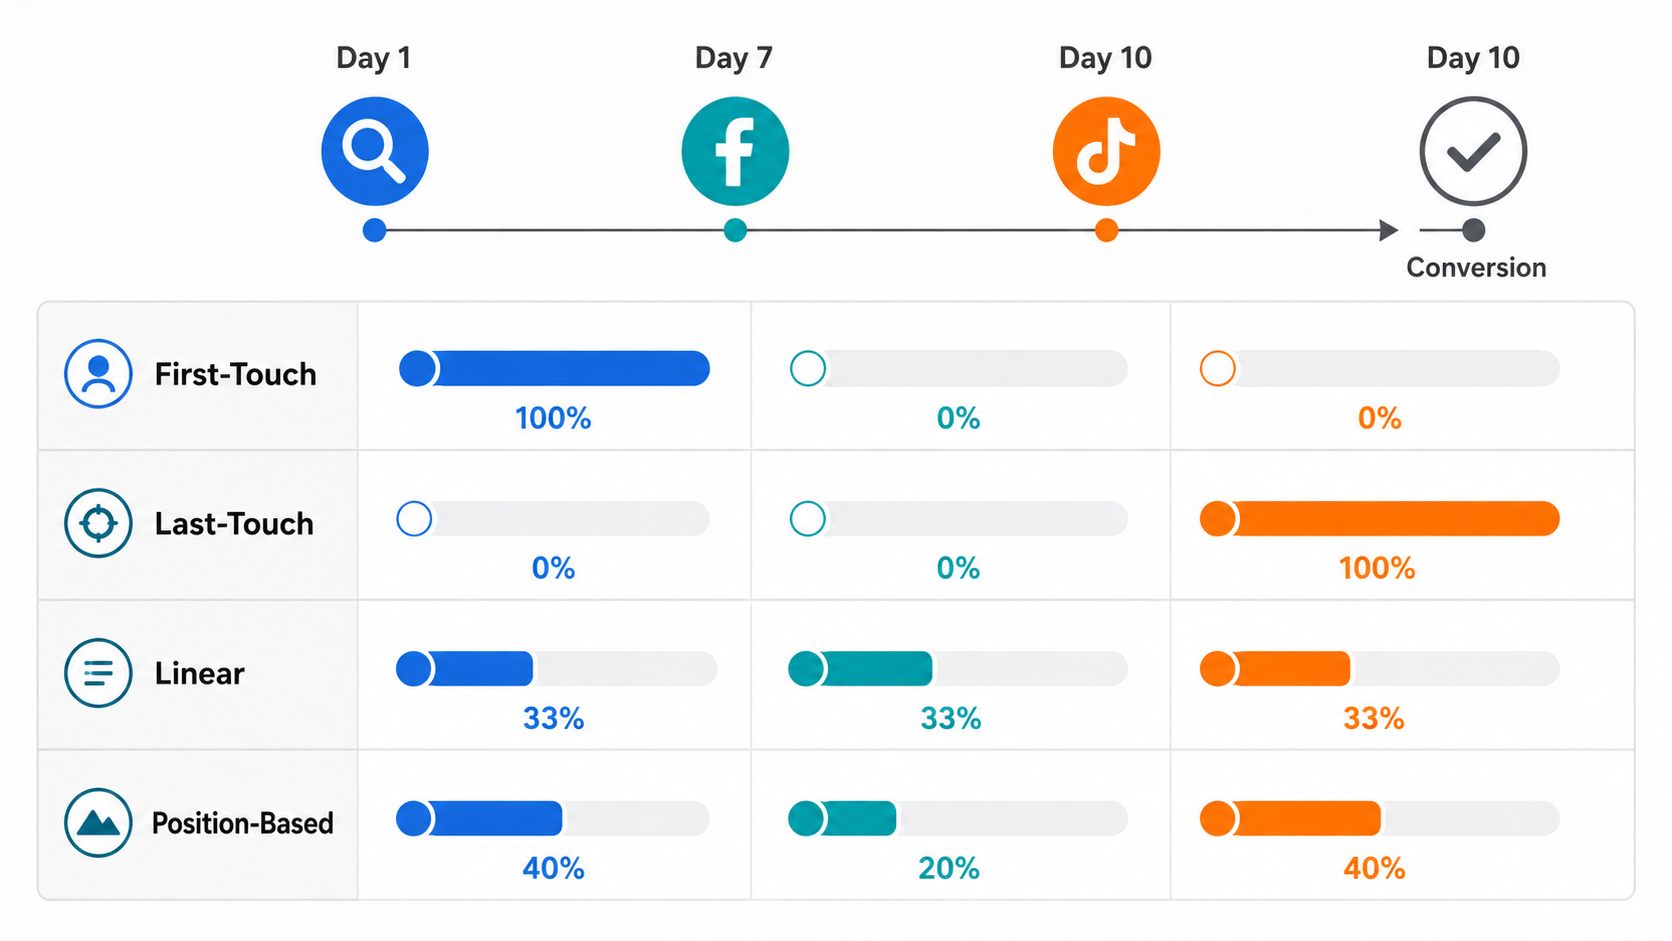 The clearest way to see why model selection matters is to run one path through several models and watch the budget conclusion change.
A real example from Amplitude follows a single customer across three paid channels:
- May 1: Google ad click
- May 7: Facebook ad click
- May 10: TikTok ad click
- Sign-up
Same three clicks. Same one conversion. Four different answers.
Comparison Table: One Three-Touchpoint Journey, Six Models
Credit assignment for the first four models comes directly from Amplitude’s example (Amplitude Blog). The position-based and data-driven rows apply the same verified definitions to the same path.
The implication is structural. Under first-touch, Google gets every dollar of credit and a media planner might cut Facebook and TikTok. Under last-touch, TikTok takes everything, and Google is the cut. Under linear, all three channels stay in the picture. The same three ad clicks produce three completely different budget plans depending on which model the reporting layer happens to be using that month.
Now stretch the journey out. A five-touchpoint funnel with a $1,000 order looks like this: a Facebook video view on Day 1, a Google Display click on Day 5, an organic search visit on Day 10, a retargeting ad click on Day 18, an email click on Day 20, and the conversion.
Organic and email are real touchpoints, but platform-native models only credit their own paid interactions. This is illustrative, not a cited case study, and the dollar split follows the verified definitions above.
A planner on last-touch scales email and cuts Facebook video. A planner on first-touch does the opposite. U-shaped protects investment in both awareness and close. None of these models is technically wrong. Each answers a different question.
Want to see what your attribution actually looks like? Book a Hyros demo.
Which Model Fits Your Funnel Type
There is no universal winner. Model selection depends on funnel structure, consideration cycle length, and the business question you are trying to answer. Funnel length is the single biggest variable.
Source basis: Improvado Attribution Guide; Forrester (Brett Kahnke); Analytic Partners.
The funnel length test
If your customer typically converts within one to three days of first ad exposure, last-touch is defensible. If conversion typically happens 14 to 45 days after first exposure across multiple touchpoints, last-touch is dramatically undervaluing your upper-funnel spend. Funnel length is the primary variable in this decision.
The B2B average is five to seven touchpoints before a purchase decision (Demand Gen Report via 6sense, 2023). Rule-based single-touch models were not designed for that path. Multi-touch attribution is now more prevalent than either first-touch or last-touch in B2B (6sense 2024 B2B Marketing Attribution Benchmark). The market has moved. This also intersects directly with how attribution windows interact with model selection, because a 1-day window on a 30-day funnel will lie to you regardless of the model on top of it.
What platform deprecations mean for model selection in 2026
Google Ads has effectively settled the single-model debate. Final migration to data-driven attribution completed in September 2023. The timeline: May 2023, deprecated models became unavailable for new GA4 conversion actions. June 2023, unavailable for new Google Ads conversion actions. September 2023, all remaining conversion actions were automatically migrated to DDA. Only Data-Driven and Last Click are selectable now (Google Ads Help; Search Engine Land, 2023; Ruler Analytics, 2023).
Meta has gone the other direction by tightening the window itself. The 2026 default is 7-day click and 1-day view. On January 12, 2026, Meta permanently removed 7-day view and 28-day view options from the Ads Insights API. Advertisers who had relied on longer view windows reported conversion drops of 15 to 30 percent after that date, with the steepest impact in B2B, luxury goods, high-ticket ecommerce, and real estate (Dataslayer, 2026). On March 3, 2026, Meta also tightened click-through attribution to require an actual link click. Likes, comments, and shares no longer count as attribution-eligible interactions (Jon Loomer Digital, 2026).
The practical consequence is straightforward. Cross-channel attribution decisions cannot be made inside any single platform. Meta cannot see your Google conversions. Google cannot see your Meta conversions. Both platforms grade their own homework. For a deeper breakdown of how Google and Facebook use attribution models differently, the structural picture matters more than the surface settings.
Beyond Single-Model Attribution: The Case for Data-Driven
For complex, multi-touch, multi-channel funnels, none of the six models above is adequate on its own. The practical path forward is a cross-channel attribution layer that can apply multiple models and weight them against the business question being asked.
Analytic Partners’ ROI Genome research found that multi-touch attribution overweights bottom-funnel click-based channels. In their sample, 50% of brands should decrease paid search budgets, and 8 of 10 brands should allocate more to CTV and streaming video, both of which are systematically undervalued because of low click-through rates (Analytic Partners). The recommended use is high-frequency tactical optimization inside a single channel, not strategic budget allocation across channels.
Forrester’s position, from principal analyst Brett Kahnke: “no attribution model is capable of generating a precise value for the return from one individual tactic in a complex system like a B2B sales cycle.” Models deliver relative performance insights, not exact calculations. The best practice is to leverage multiple purpose-built models to answer different business questions (Forrester Blog).
That is the shape of the problem. Single-model attribution gives you a single answer to a multi-variable question. Multi-model, cross-channel attribution gives you a range, weighted by what the actual journey looks like.
Hyros operates as a cross-channel data layer that captures touchpoints across Google, Meta, TikTok, and other channels that platform-native attribution cannot cross. The structural issue with platform-native models is silo’d reporting. Meta cannot credit Google touchpoints and vice versa. Hyros provides the cross-channel path data that makes meaningful model comparison and algorithmic attribution possible in the first place. Hyros markets pixel-independent tracking and multi-touch attribution (the Hyros platform), with reported figures including up to 50% more ad attribution (Hyros call tracking) and at least a 15% AD ROI increase (see how Hyros works). Those are company-reported numbers, not third-party audits.
Hyros is built for operators who are serious about their data, which is the only point at which model selection stops being theoretical. Once you can see the full path, the model becomes a question of what you want to learn, not a structural limit on what you can see. That is the connection to applying attribution data to cut-or-scale decisions, where model choice directly determines which campaigns survive the next budget review.
FAQ
What is the difference between first-touch and last-touch attribution?
First-touch gives 100% of conversion credit to the first ad or channel a customer ever interacted with. Last-touch gives 100% to the final touchpoint before purchase. Both are binary. One touchpoint receives everything, all others receive nothing. For multi-step customer journeys with three or more touchpoints, both models produce misleading budget allocation signals.
What is linear attribution in marketing?
Linear attribution distributes equal credit across every touchpoint in the customer journey. A customer with four touchpoints gives each 25%. It is more equitable than first- or last-touch, but it still assumes all touchpoints contributed equally, which is rarely true. Most operators use linear as a baseline comparison rather than a primary decision-making model.
Which attribution model is most accurate?
No model is universally most accurate. Data-driven attribution is the most sophisticated because it uses actual conversion data to weight touchpoints by influence rather than position. It requires meaningful conversion volume to function well and a data layer that can see cross-channel paths. For $20K+ per month multi-channel operators, data-driven attribution is the correct direction.
When should I use first-touch attribution?
First-touch is useful when the primary question is “which channel is generating initial awareness?” For example, evaluating whether to invest in a new awareness channel. It should not be used as the primary allocation model for budget decisions because it systematically undervalues conversion-stage campaigns that close the sale after upper-funnel spend did the initial work.
What is data-driven attribution?
Data-driven attribution uses machine learning to assign credit based on which touchpoints in your account’s actual conversion paths influenced outcomes. It does not apply a fixed rule. Weights update as conversion data accumulates. It has been the default model in Google Ads since September 2023 and works best with meaningful conversion volume.
Stop Optimizing for the Platforms. Start Optimizing for Revenue.
Stop optimizing for what the platforms tell you. Start optimizing for what is actually driving revenue.