

Multi-Touch Attribution Explained (With Examples)
TL;DR
- Multi-touch attribution (MTA) is a measurement method that splits conversion credit across every marketing touchpoint a customer interacted with before purchasing.
- MTA reveals which channels start conversations, which ones keep them going, and which ones close the sale, instead of handing all credit to one click.
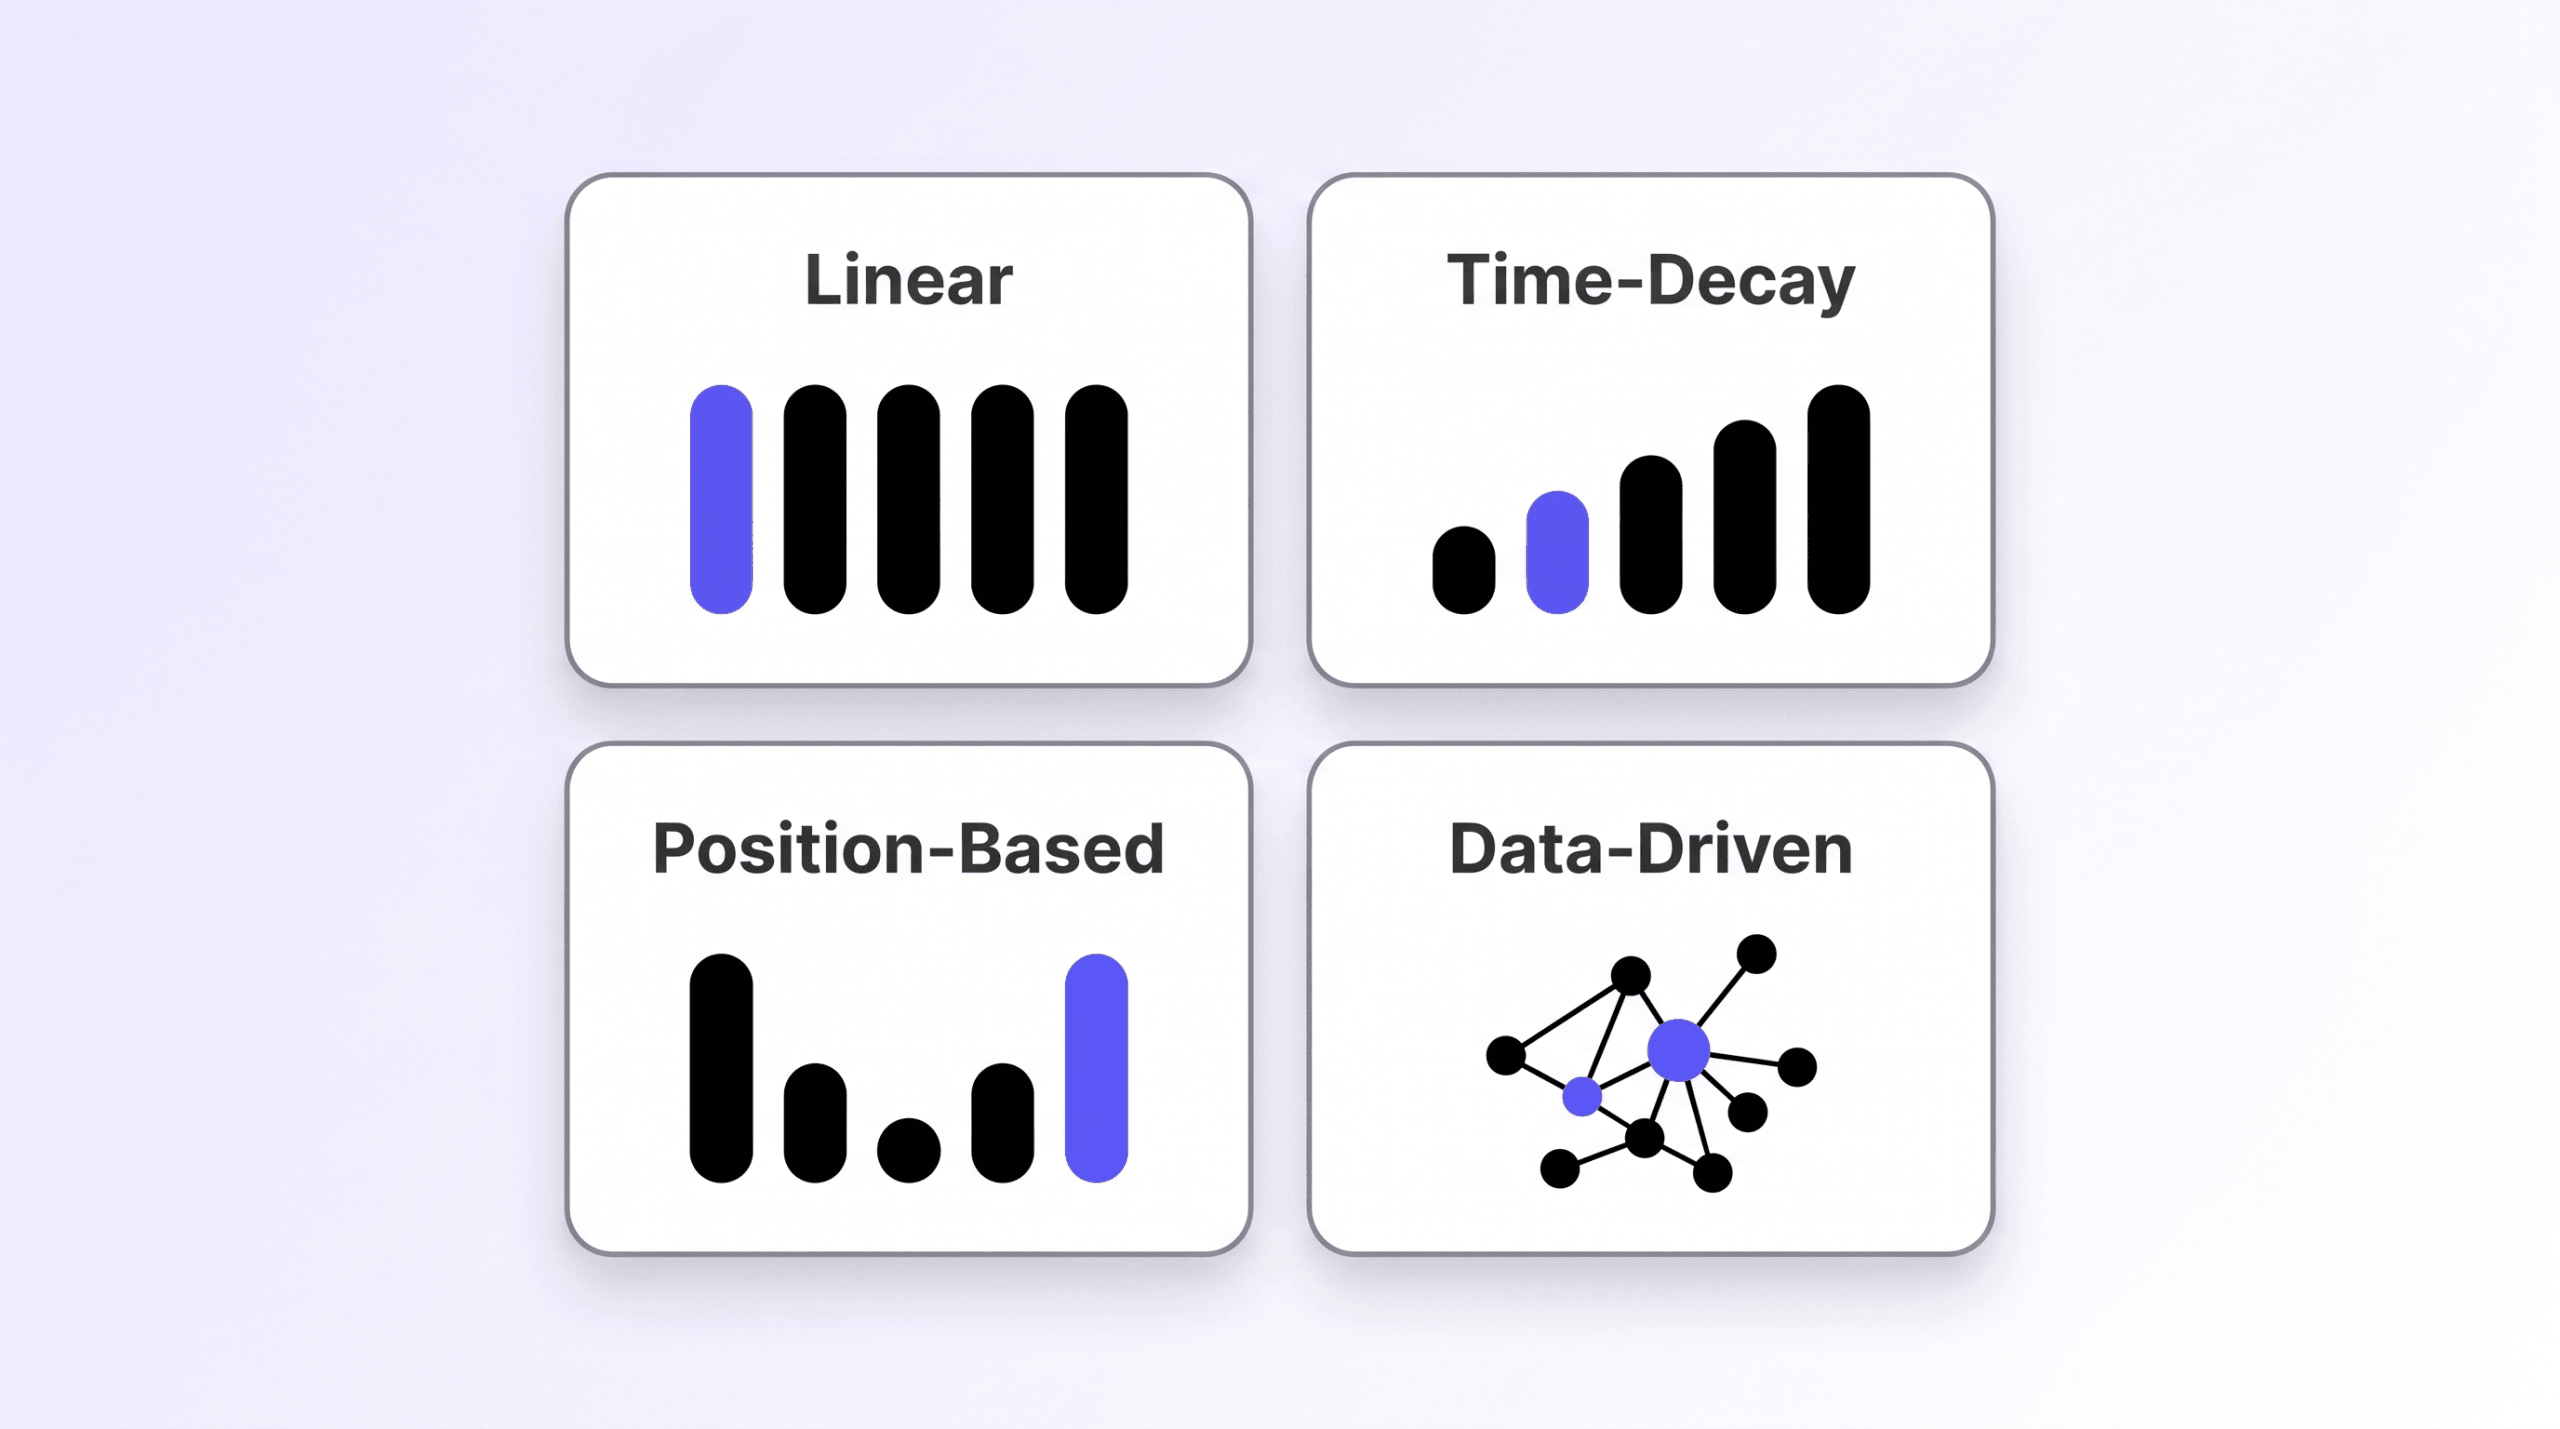
- The four main models are linear (equal credit to all touches), time-decay (recent touches get more credit), position-based / U-shaped (first and last touches get the largest share), and data-driven (algorithms like Markov chains or Shapley values calculate credit from observed data).
- Use linear for a quick baseline with no setup; use time-decay for short sales cycles; use position-based when discovery and closing both matter.
- Use data-driven when you have enough conversion volume to feed the model and you want the highest accuracy.
What Is Multi-Touch Attribution?
Most marketers think multi-touch attribution is just a model selection problem. It isn’t. It’s a data-collection problem. If you’re solving the wrong problem, no model in the world will fix your numbers.
I’ve spent years running ads for Hyros and watching businesses make expensive decisions on broken data. Multi-touch attribution is a measurement method that distributes conversion credit across every marketing touchpoint a customer interacted with before buying, instead of giving all credit to a single click. A multi-touch model might assign 40% of a sale to the Facebook ad that introduced the brand, 20% to a retargeting email, and 40% to the Google search click that closed the sale. But here’s the thing: none of that math matters if the platform you’re measuring through isn’t seeing the full picture.
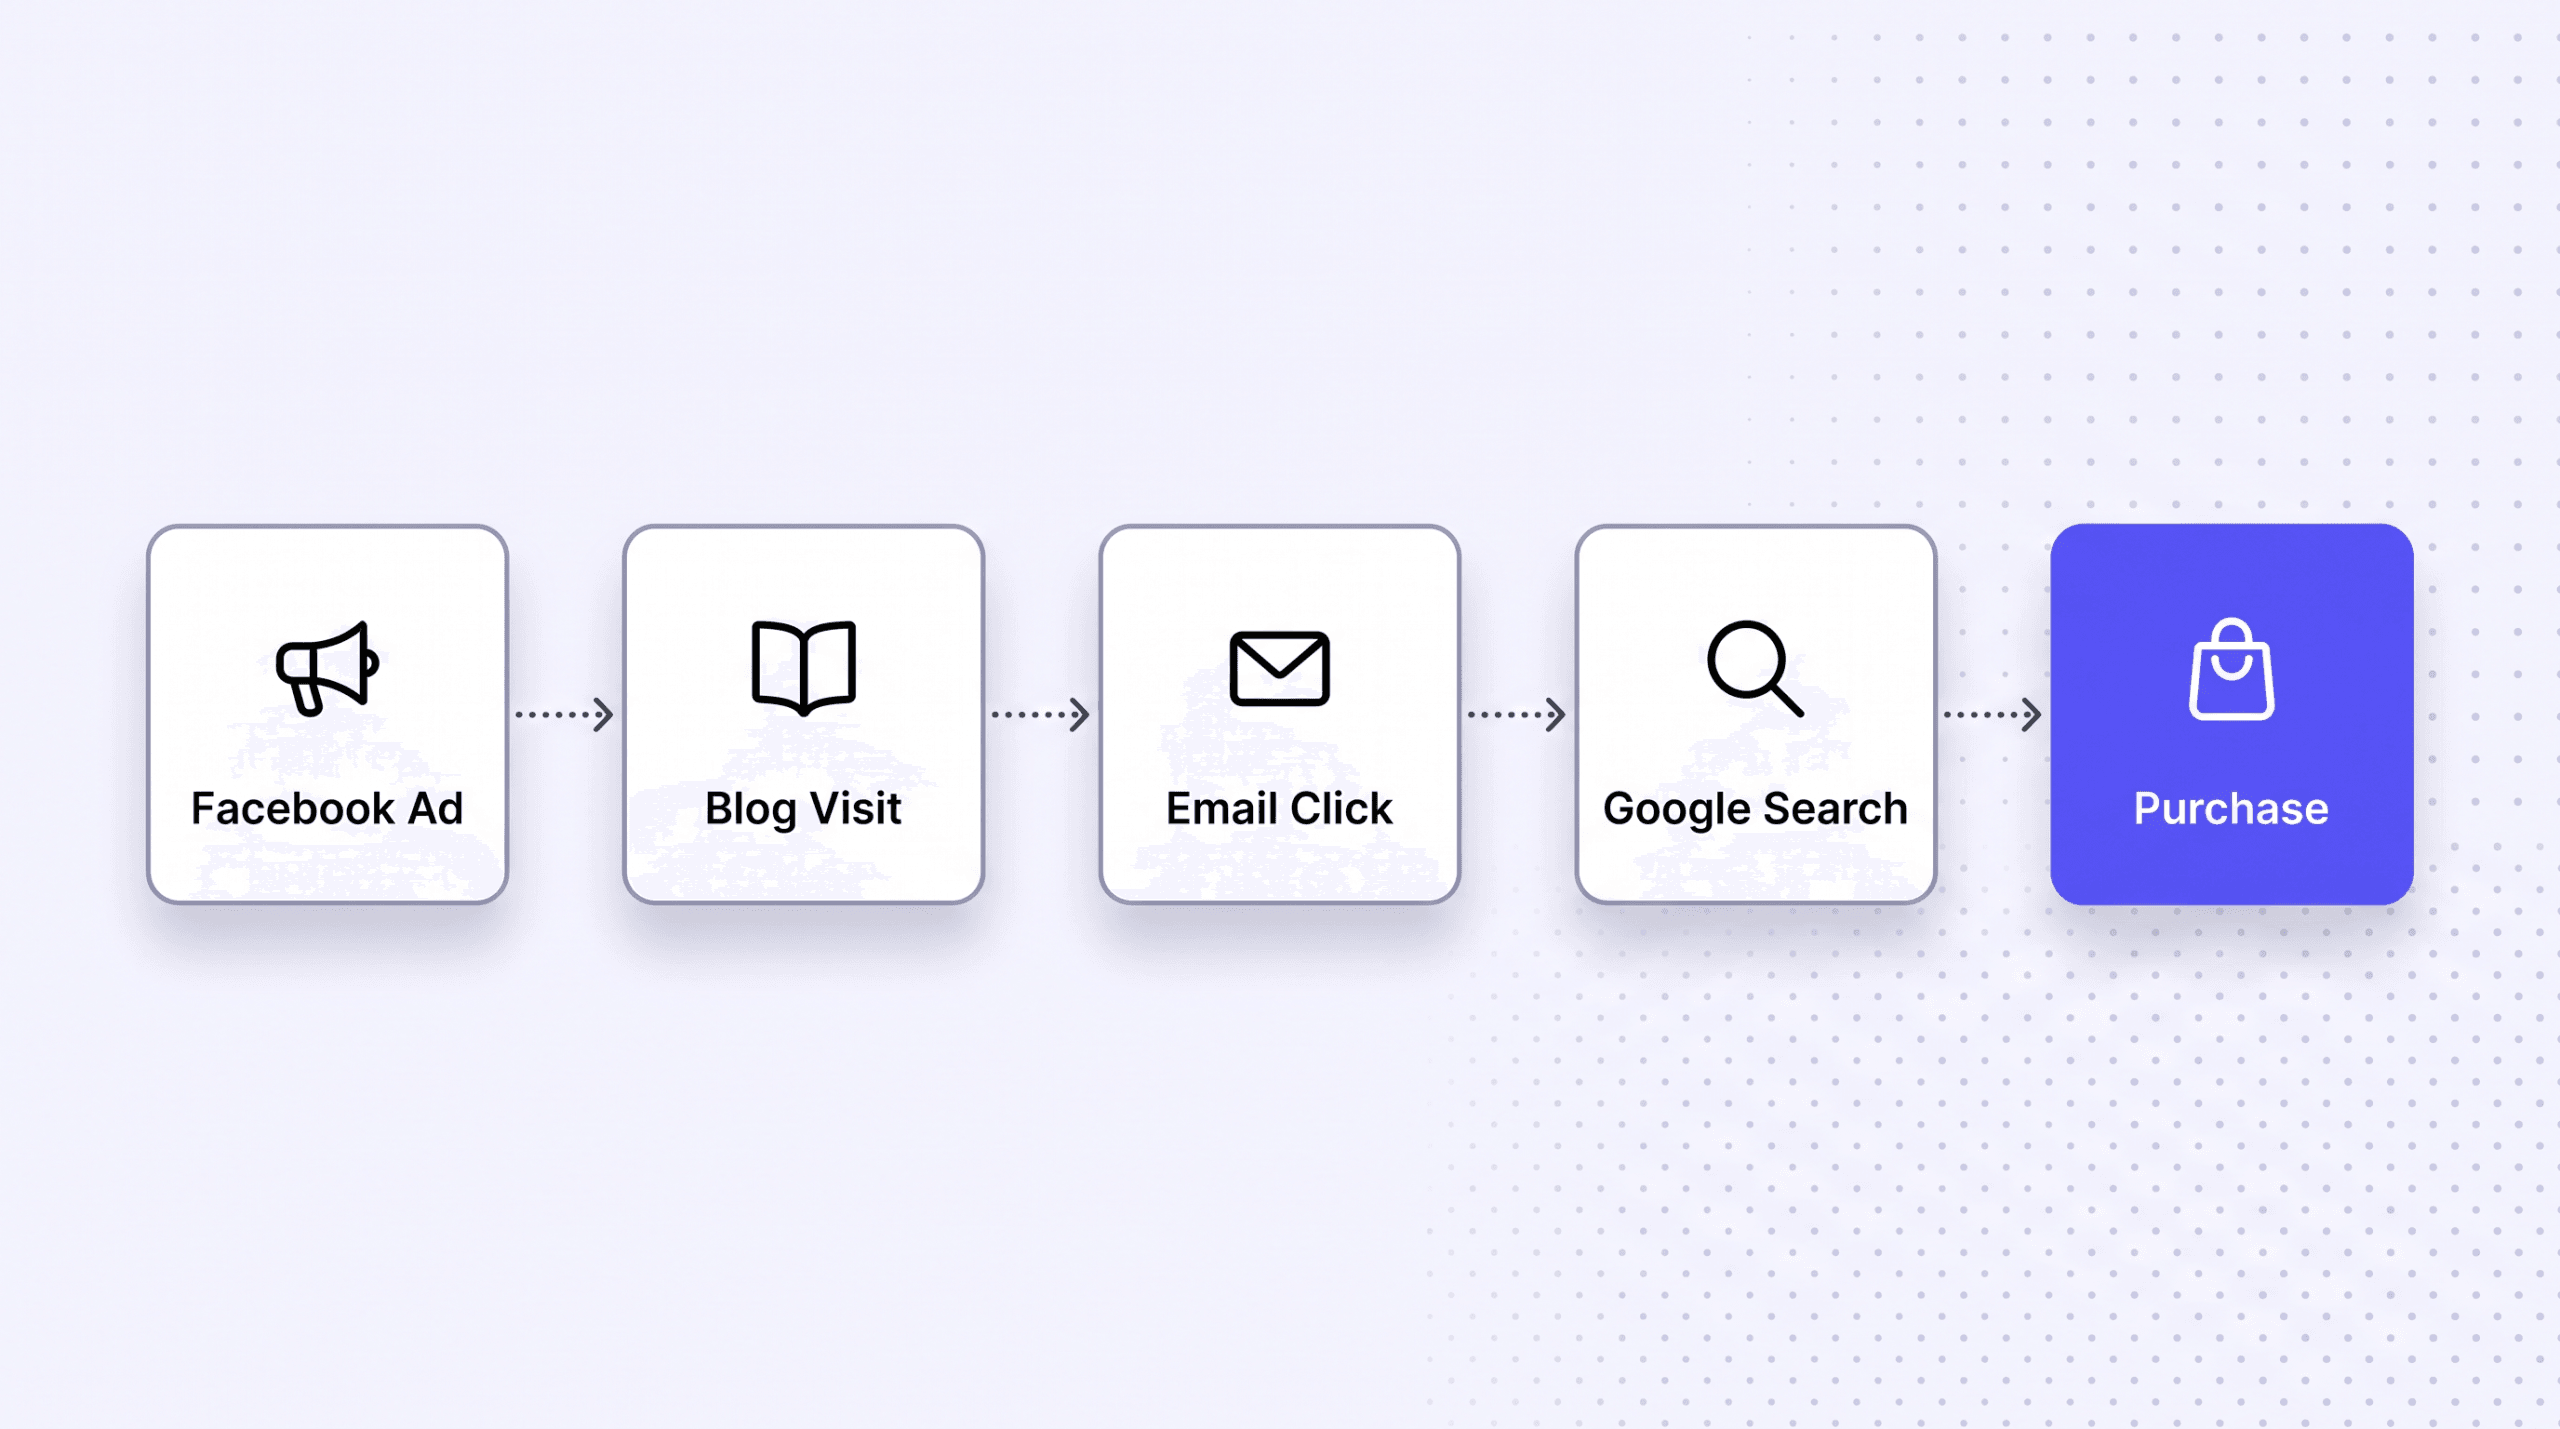
The concept exists because customer journeys aren’t straight lines. A buyer might see a Meta ad on Monday, read a blog post on Wednesday, open an email on Friday, search the brand name on Google on Saturday, and buy on Sunday. Single-touch models (first-click or last-click) would credit one of those five interactions and ignore the other four. That creates blind spots. Teams overfund the credited channel and underfund the ones that actually moved the customer forward.
Multi-touch attribution fixes that by mapping the full path and assigning fractional credit to each step. The result is a more complete picture of which campaigns, channels, and creatives contribute to revenue. Marketing teams use this picture to reallocate budget, cut waste, and scale the combinations that produce results.
The cost of not doing this is steep. According to LayerFive’s research on marketing waste, nearly half of marketing spend is wasted due to poor attribution. That isn’t a rounding error. Half of every dollar goes to the wrong place because the measurement model credits the wrong touchpoint.
According to a 2024 Forrester report on B2C marketing measurement, a growing number of B2C marketers now treat multi-touch attribution as a core measurement method. The shift accelerated after iOS 14.5 broke pixel-based tracking in 2021, forcing brands to rethink how they measure ad performance.
This article covers how MTA works, the four main models, a worked example with real numbers, where MTA breaks down, and how Hyros approaches the problem with AI-powered tracking.
Related reading: What Is Ad Attribution? covers the foundations if you’re starting from scratch.
How Does Multi-Touch Attribution Work?
Multi-touch attribution starts with data collection. Every interaction a customer has with your marketing gets logged: ad impressions, clicks, email opens, website visits, form fills, chat conversations, phone calls, and purchases. Each interaction’s a touchpoint. If you’re not logging all of them, you don’t have attribution, you have guesswork.
Step 1: Identify the Customer
The system needs to recognize the same person across sessions and devices. A visitor who clicks a Facebook ad on their phone and later buys on their laptop must be stitched into a single identity. It’s done through first-party cookies, email matching, login data, phone numbers, or device fingerprinting. Without identity resolution, multi-touch attribution falls apart because each session looks like a different person, and you’re back to square one.
Step 2: Build the Journey
Once identities are resolved, the system constructs a timeline of every touchpoint in order. A typical journey might look like this:
- Day 1: Clicks a Facebook ad (first exposure)
- Day 3: Reads a blog post via organic search
- Day 5: Opens and clicks a retargeting email
- Day 7: Searches the brand name on Google, clicks a branded search ad
- Day 7: Returns to the site directly and purchases
That is five touchpoints across seven days. Each one played a role. The question is how much credit each one deserves.
Step 3: Apply a Model
The attribution model is the formula that distributes credit. Different models answer different questions:
- Linear asks: “What was the average contribution?”
- Time-decay asks: “What pushed the customer over the finish line?”
- Position-based asks: “What introduced the brand and what closed the deal?”
- Data-driven asks: “Based on thousands of similar journeys, what actually mattered?”
No model’s universally correct. The right choice depends on your sales cycle length, data volume, and what decisions you’re trying to make.
Step 4: Aggregate and Report
Individual journeys get rolled up into channel-level and campaign-level reports. Instead of seeing “Google Ads drove 200 conversions,” you see “Google Ads contributed 142.6 weighted conversions, with 68% of its credit coming from branded search in the last-touch position.” That granularity changes how you allocate budget.
What Are the Main Multi-Touch Attribution Models?
Linear (Equal Credit)
The linear model divides conversion credit equally across every touchpoint. If a customer touched five channels before buying, each channel gets 20% credit.
How it works: Take the conversion value and divide by the number of touchpoints. A $100 sale with five touchpoints assigns $20 to each one. That’s it.
Strengths: Simple to implement, easy to explain to stakeholders, and gives every channel some visibility. No touchpoint gets completely ignored.
Weaknesses: It treats a passing blog visit the same as the ad click that introduced the brand. A customer who glanced at your Instagram story for two seconds gets the same credit as the demo call that closed the deal. This flattening effect can distort budget decisions.
Best for: Teams that want a starting point and lack the data volume for algorithmic models. Also useful when your marketing mix is relatively even and you genuinely believe every touchpoint carries similar weight.
Time-Decay (Recent Wins More)
The time-decay model gives increasing credit to touchpoints that happened closer to the conversion. The idea: interactions near the purchase moment had more influence on the buying decision than ones that happened weeks earlier.
How it works: Credit is distributed on a decay curve, often using a half-life formula. A common setup uses a 7-day half-life, meaning a touchpoint 7 days before conversion gets half the credit of one that happened on the day of conversion. A touchpoint 14 days out gets one-quarter.
Strengths: Reflects the reality that recent interactions often carry more weight. A customer who saw your ad three weeks ago but forgot about you until a retargeting email last night probably converted because of the email, not the original ad.
Weaknesses: Undervalues top-of-funnel activity. Awareness campaigns that introduce customers to your brand get minimal credit even though nothing else would’ve happened without them. Over time, this’ll lead to cutting awareness budgets, which then reduces the pipeline that feeds bottom-of-funnel channels.
Best for: Short sales cycles (under 14 days), e-commerce, and businesses where the decision window is compressed. Also useful in B2B when you want to identify which late-stage touches move deals across the finish line.
Position-Based / U-Shaped (First and Last Get 40% Each)
The position-based model, often called U-shaped attribution, assigns the largest credit shares to the first touchpoint (which introduced the customer) and the last touchpoint (which closed the sale). The remaining credit is split equally among the middle interactions.
How it works: The standard split is 40% to the first touch, 40% to the last touch, and 20% divided among everything in between. On a $100 sale with five touchpoints, the first and last touches each get $40, and the three middle touches split the remaining $20 (roughly $6.67 each).
A variation called W-shaped attribution adds a third anchor point: the lead creation moment (like a form fill or email signup). W-shaped typically uses a 30/30/30/10 split across the first touch, lead creation touch, last touch, and everything else.
Strengths: Acknowledges that discovery and closing are the two most critical moments in most buyer journeys. Middle touches matter, but less so. This matches how most marketing teams think about their funnel.
Weaknesses: The 40/40/20 split is arbitrary. There’s no mathematical basis for choosing those exact numbers. It also assumes the first and last touches are always the most important, which isn’t universally true. In some industries, the mid-funnel nurture sequence does the heaviest lifting.
Best for: B2B and high-consideration B2C purchases where the discovery channel and closing channel are strategically important. Works well when you have distinct awareness and conversion campaigns and want to measure both.
Data-Driven (Algorithmic: Markov, Shapley)
Data-driven attribution uses statistical models or machine learning to calculate credit based on observed conversion patterns across all your customer journeys. No preset rules or fixed percentages. The data itself determines how credit is distributed.
Two dominant approaches power most data-driven attribution:
Markov Chain Models treat the customer journey as a sequence of states. The model calculates transition probabilities between touchpoints and then measures the “removal effect” of each channel. If removing Facebook ads from all journeys causes a 30% drop in conversions, Facebook gets roughly 30% of the credit. The removal effect quantifies each channel’s actual contribution to conversion probability.
Shapley Value Models come from cooperative game theory. The model examines every possible combination of channels and measures the marginal contribution of adding each channel to the mix. If adding email to a journey that already includes Facebook and Google increases conversion probability by 15%, email gets credit proportional to that lift. Shapley values guarantee a mathematically fair allocation where every channel’s credit reflects its true incremental impact.
Google Analytics 4 uses data-driven attribution as its default model, though Google’s implementation is limited to the data it can see within its own ecosystem.
Strengths: The most accurate of all models when fed sufficient data. No arbitrary rules. Credit reflects actual observed behavior. Adapts automatically as customer behavior changes.
Weaknesses: Requires high conversion volume to produce statistically significant results. Small advertisers with 50 conversions a month’ll get noisy, unreliable outputs. The models are also opaque. Explaining to a CMO why Instagram got 23.7% credit instead of 25% is harder when the answer’s “the Markov chain said so.” Implementation cost and complexity are higher than rule-based models.
Best for: Businesses with 500+ monthly conversions, multiple active channels, and the technical capacity to implement or buy an algorithmic attribution tool. This is where the industry is heading. If you have the data, use data-driven.
For a deeper comparison of simple models, see First-Click vs Last-Click.
How Does Multi-Touch Compare to Single-Touch Attribution?
Single-touch attribution picks one touchpoint and gives it 100% of the credit. The two most common versions are first-click (credits the channel that introduced the customer) and last-click (credits the channel that closed the sale). You’ve probably been running one of these without realizing it.
| Factor | Single-Touch | Multi-Touch |
|---|---|---|
| Credit distribution | 100% to one touchpoint | Split across all touchpoints |
| Setup complexity | Minimal | Moderate to high |
| Data requirements | Low | High (needs identity resolution) |
| Accuracy | Low for complex journeys | Higher for complex journeys |
| Channel bias | Extreme (ignores all but one touch) | Reduced (every channel gets measured) |
| Best use case | Simple funnels, single-channel businesses | Multi-channel campaigns, paid media optimization |
| Budget impact | Overfunds one channel, starves others | More balanced allocation |
The gap between single-touch and multi-touch grows as your marketing mix gets more complex. A business running ads on one platform with no email, no content, and no organic search might get away with last-click. A business running Meta ads, Google ads, TikTok, email sequences, blog content, and retargeting campaigns won’t. They’ll make bad budget decisions with single-touch models.
The double-counting problem makes this worse. According to a Databox analysis of cross-platform attribution, summing all platform-reported conversions produces 150-250% of actual closed customers. Every platform grades its own homework generously. Meta says the Meta ad drove the sale. Google says the Google ad drove the sale. Add those up and you’ve counted the same customer two or three times. Multi-touch attribution, when done with a single measurement layer above all platforms, eliminates the double-count.
Today’s customers interact with brands across an average of 9-10 touchpoints before converting. At that journey length, crediting a single click isn’t measurement. It is a guess.
For more on how tracking feeds attribution, read Ad Tracking vs Analytics.
What Does a $240 Sale Look Like Across 5 Touchpoints?
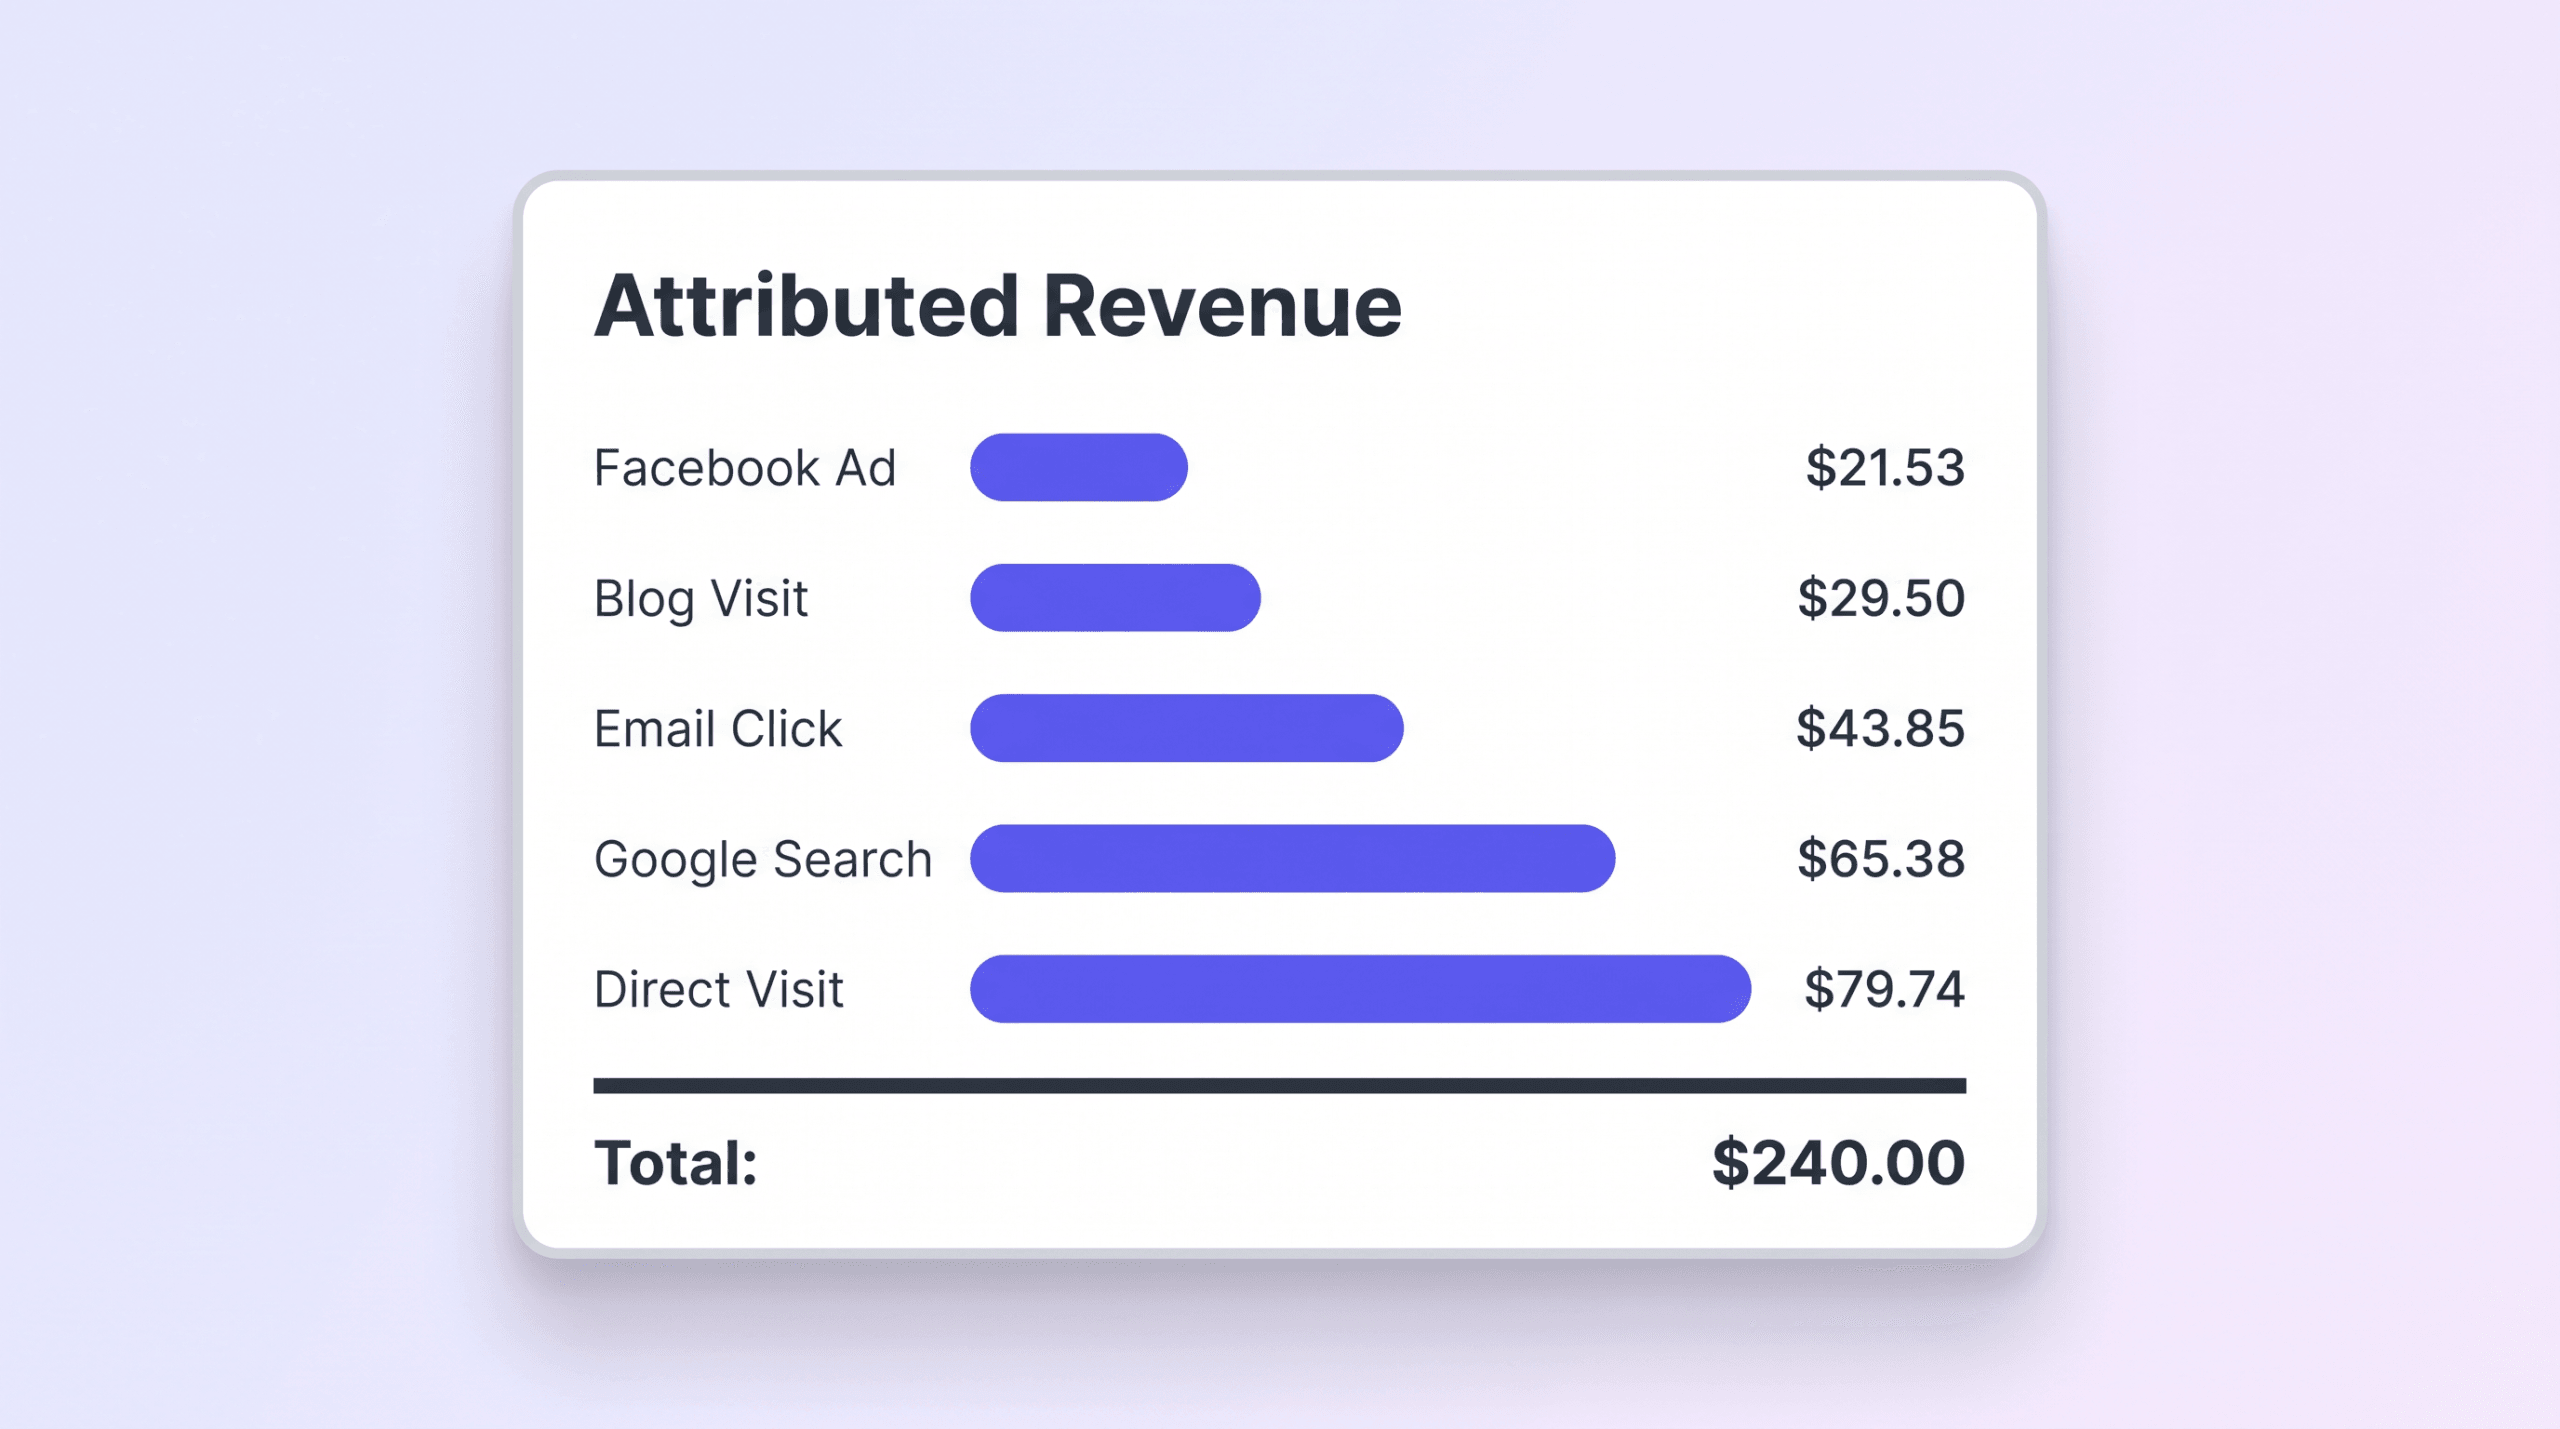
A customer buys a $240 product after the following journey:
- Facebook ad click (Day 1): first exposure to the brand
- Blog visit via organic search (Day 4): reads a product comparison article
- Email click (Day 8): opens a nurture email and clicks through to the product page
- Google branded search click (Day 12): searches the brand name, clicks a paid search ad
- Direct visit and purchase (Day 14): types the URL directly and buys
Here is how each model distributes the $240:
Linear
Every touchpoint gets equal credit: $240 / 5 = $48 each.
| Touchpoint | Credit |
|---|---|
| Facebook ad | $48.00 |
| Blog visit | $48.00 |
| Email click | $48.00 |
| Google search | $48.00 |
| Direct visit | $48.00 |
Time-Decay (7-day half-life)
Touchpoints closer to the conversion get more credit. Using a 7-day half-life, weights are calculated based on days before conversion:
- Direct visit (Day 14, 0 days before): weight = 1.00
- Google search (Day 12, 2 days before): weight = 0.82
- Email click (Day 8, 6 days before): weight = 0.55
- Blog visit (Day 4, 10 days before): weight = 0.37
- Facebook ad (Day 1, 13 days before): weight = 0.27
Total weight: 3.01. Normalize to distribute $240:
| Touchpoint | Weight | Credit |
|---|---|---|
| Facebook ad | 0.27 | $21.53 |
| Blog visit | 0.37 | $29.50 |
| Email click | 0.55 | $43.85 |
| Google search | 0.82 | $65.38 |
| Direct visit | 1.00 | $79.74 |
The direct visit and Google search together take 60% of the credit. The Facebook ad that started the journey gets less than 9%.
Position-Based (U-Shaped, 40/40/20)
First touch (Facebook) and last touch (Direct) each get 40%. The remaining 20% splits among the three middle touchpoints.
| Touchpoint | Credit |
|---|---|
| Facebook ad | $96.00 (40%) |
| Blog visit | $16.00 (6.7%) |
| Email click | $16.00 (6.7%) |
| Google search | $16.00 (6.7%) |
| Direct visit | $96.00 (40%) |
Data-Driven (Hypothetical Algorithmic Output)
A Markov chain model trained on 10,000 similar customer journeys calculates removal effects. Removing Facebook ads reduces overall conversions by 28%. Removing email reduces conversions by 22%. The model distributes credit based on each channel’s actual measured impact:
| Touchpoint | Credit |
|---|---|
| Facebook ad | $67.20 (28%) |
| Blog visit | $31.20 (13%) |
| Email click | $52.80 (22%) |
| Google search | $55.20 (23%) |
| Direct visit | $33.60 (14%) |
Notice how data-driven gives the blog visit and email more credit than position-based does. In this dataset, the nurture sequence (blog + email) influenced conversion rates more than the models with fixed rules could detect.
The same $240 sale. Four completely different stories about what worked. This is why model selection matters. It changes where your next dollar goes.
I’ve seen this play out across hundreds of ad accounts. In my own accounts, I found that 25-45% of winning ads were invisible to standard platform tracking. Campaigns delivering 200-500% ROI looked like losers in Facebook’s dashboard. Without multi-touch data to show the full journey, I would have killed those campaigns and left money on the table. The model you choose determines which version of reality you act on.
The Multi-Touch Journey That Most Platforms Can’t See
Let me show you what I mean with a real teaching scenario, not a hypothetical spreadsheet, but the kind of journey I see constantly when I look at ad accounts.
Picture this: a customer discovers your brand through a TikTok ad on a Tuesday. They don’t buy. Three days later, they’re searching for your category on Google. Your organic content shows up and they read a comparison article. Still no purchase. Saturday, they click an email you sent and land on your product page. They put it in the cart and abandon. Sunday, a Meta retargeting ad catches them. They click, they buy. A $197 product. Done.
Now here’s where it gets expensive. TikTok’s dashboard shows zero conversions because that customer didn’t buy on Tuesday. Google Analytics credits the email click because that’s the last tracked web session. Meta takes credit for the conversion because their retargeting fired. You’re looking at three different platforms each claiming the same $197 sale, and your total “reported conversions” across all platforms add up to $591 for a sale that happened once.
I’ve looked at this scenario play out across thousands of accounts running through Hyros. It’s not a corner case. It’s Tuesday.
The fix isn’t switching models. It’s getting a measurement layer that sits above every platform, one that tracks the TikTok impression, the Google visit, the email click, and the Meta conversion as a single unified journey. Then you apply whatever model makes sense for your business. Without that unified tracking, you’re distributing credit across a journey your tools can’t actually see.
When Does Multi-Touch Attribution Break Down?
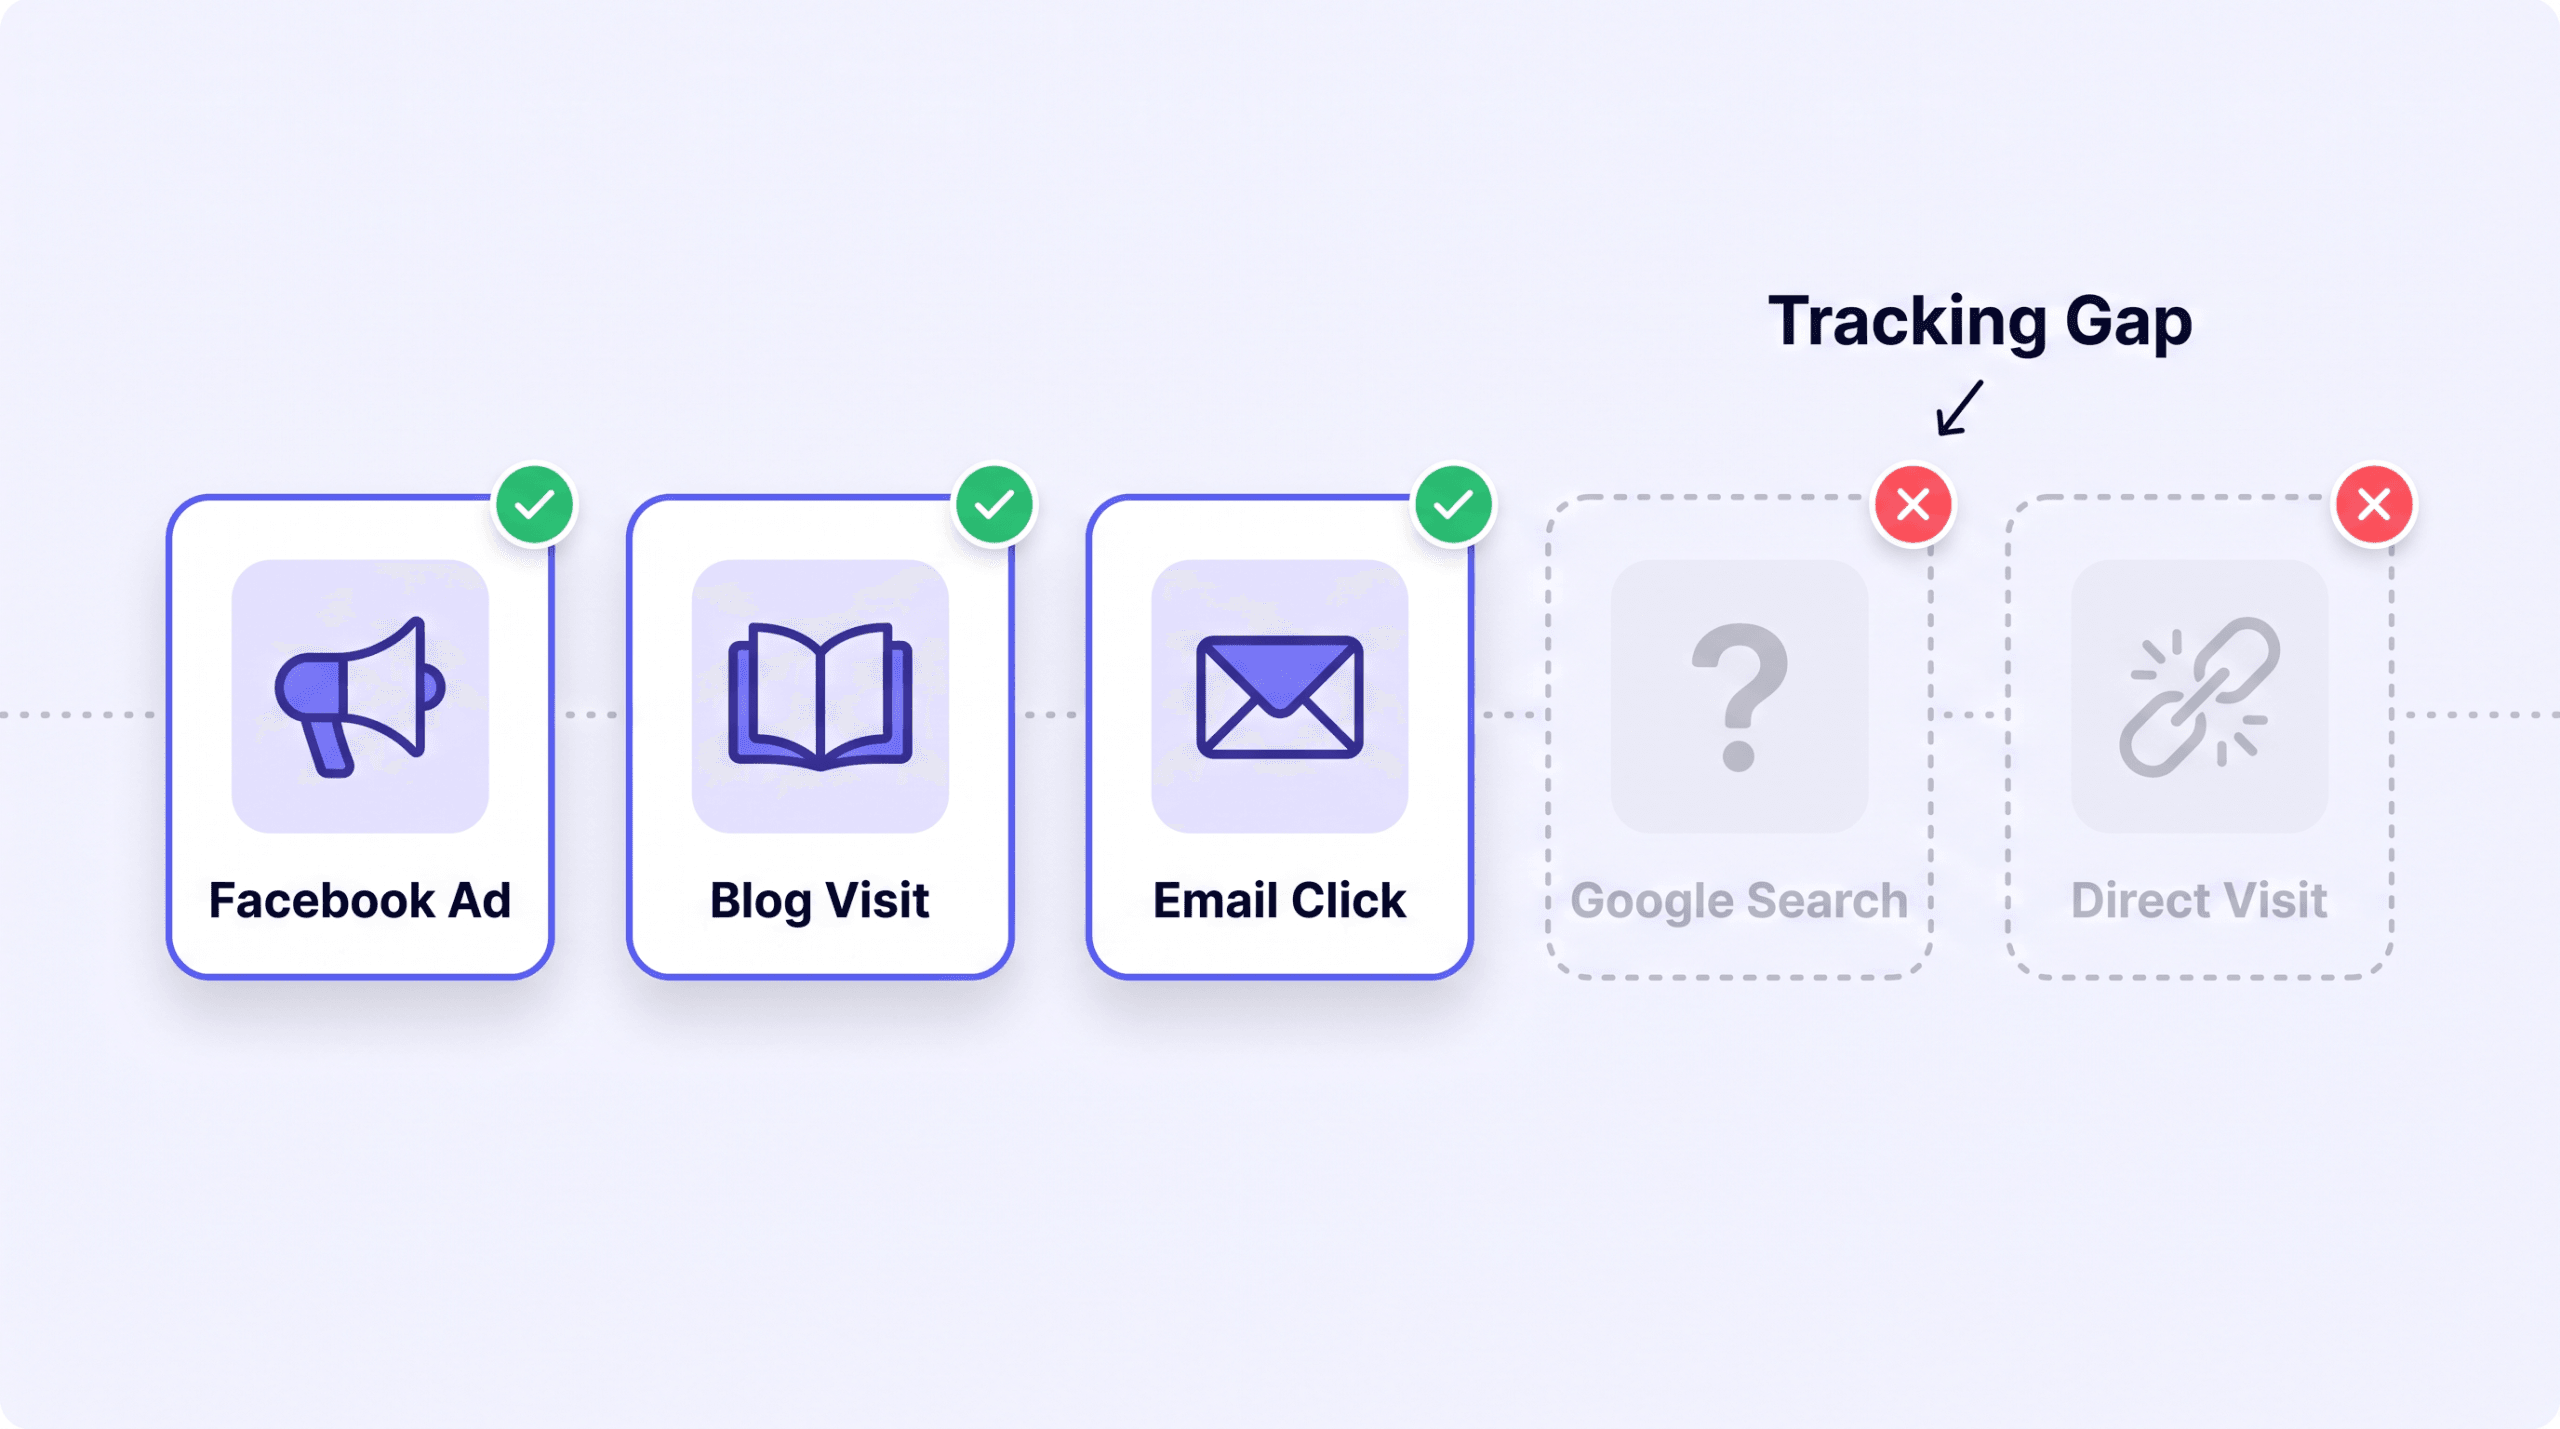
Multi-touch attribution is better than single-touch, but it isn’t perfect. There’re several real-world forces that’ll degrade its accuracy if you don’t account for them.
iOS 14.5 and App Tracking Transparency
Apple’s App Tracking Transparency (ATT) framework, introduced in iOS 14.5 in April 2021, requires apps to ask permission before tracking user activity across other apps and websites. Roughly 75-80% of users opt out. The result: Meta, TikTok, Snapchat, and other app-based ad platforms lost visibility into large portions of user journeys. Attribution conflicts’ve increased 47% after iOS 14.5, according to industry reporting.
For multi-touch attribution, this means the Facebook ad that started a journey often never gets logged. The customer clicked, but the tracking pixel couldn’t fire because the user opted out. The attribution model sees a journey that starts at the blog visit on Day 4 and hasn’t got any idea Facebook was involved. Credit shifts to whatever the first tracked touchpoint was, regardless of what actually happened.
The scale of this blind spot isn’t theoretical. Industry data shows roughly 84% of iOS users opted out of app tracking in the months after ATT launched (Flurry, 2021; opt-in has since risen to ~37%). Meta responded by collapsing its default attribution window from 28 days to 7 days, a 75% reduction in the measurement period. Any touchpoint that happened more than a week before the purchase simply vanished from Meta’s reporting.
Third-Party Cookie Loss
Browsers have been restricting third-party cookies for years. Safari and Firefox blocked them by default. Google’s delayed Chrome’s deprecation timeline multiple times but the direction’s clear: cross-site tracking via cookies is dying. Multi-touch attribution systems that relied on third-party cookies to follow users across websites lose signal as cookie support disappears.
First-party data and server-side tracking fill part of the gap, but they require more technical infrastructure than a simple pixel. A Softailed independent review of server-side tracking found that server-side implementations recover 18-40% more conversions compared to browser-only pixel tracking. That’s the recovered data multi-touch models need to construct accurate journeys instead of working with incomplete timelines.
Walled Gardens and the Black Box Problem
Meta, Google, Amazon, and TikTok each operate their own measurement systems, and here’s the thing nobody in the industry talks about honestly: Facebook’s going to take credit for the sale, Google’s going to take credit for the sale, and you’re not even going to see credit going to the channel that actually moved the needle. What happens is that if Google and Facebook are both saying they drove this sale and you can’t verify it, it’s a black box. You’re comparing each platform’s self-reported homework with no independent judge.
I’ve seen this exact scenario play out in live demos. One account I reviewed was running calls as their primary conversion. Facebook reported 42 calls. Our tracking showed 116 calls coming in. If I had been using Facebook’s metrics alone, I probably would have turned off those ads, or at least concluded they weren’t working. The math would have told me I was paying $500 per call. I was actually paying $200 per call. That’s the difference between killing a winner and scaling a money-printer. The platform-reported number was wrong by 63%. Not by a rounding error. By two-thirds.
Multi-touch attribution needs a single source of truth that sits above all platforms. Without one, you’re not doing attribution. You’re just averaging platform lies. One YouTube agency review demonstrated this live: Facebook reported a cost per call at $129 when the actual verified cost was $518. That is a 4x gap between what the platform told the advertiser and what actually happened.
Offline and Dark Touchpoints
Word of mouth, podcast mentions, in-store visits, phone calls, and text messages are harder to track digitally. A customer might hear about your brand from a friend, spend two weeks thinking about it, then search your name on Google and buy. Attribution credits Google. The friend who made the recommendation doesn’t get a single point of credit.
No attribution model fully solves this problem, but server-side tracking, call tracking, unique promo codes, and post-purchase surveys can capture some of these interactions.
Cross-Device Blind Spots
A customer who browses on their phone, researches on their work laptop, and buys on their home desktop creates three separate tracking profiles unless your system can stitch them into one identity. Without cross-device identity resolution, multi-touch attribution treats this as three different people, and it’s misattributing the whole way through.
How Does Hyros Handle Multi-Touch Attribution?
Hyros takes a different approach to multi-touch attribution than most analytics tools. Instead of relying on pixels and cookies that’ll break under privacy restrictions, Hyros uses a combination of first-party tracking, server-side event collection, and AI-powered identity stitching. I built it because I couldn’t scale my own ad accounts without it. Nothing else was giving me accurate data.
First-Party, Server-Side Tracking
Hyros tracks conversions server-side, bypassing ad blockers and browser privacy restrictions that block client-side pixels. When a customer clicks an ad, visits a page, fills out a form, or makes a purchase, the event is recorded on Hyros’s servers using first-party data. This means Hyros captures touchpoints that platforms like Meta and Google can no longer see due to iOS 14.5 opt-outs.
The gap between what platforms report and what server-side tracking finds isn’t small. According to Hyros’s data across thousands of brands, Facebook reports 30% fewer conversions than Hyros tracks, Google reports 29% fewer, and TikTok reports 33% fewer. Those’re missing conversions. Real revenue that platform-native attribution can’t see and can’t optimize toward.
AI Identity Resolution
Hyros uses AI to stitch together customer sessions across devices and time gaps. A visitor who clicks a Facebook ad on their phone Monday and buys on their laptop Friday gets connected into a single journey. The stitching’s done using email addresses, phone numbers, and other first-party identifiers, not third-party cookies that’ll vanish when the browser blocks them.
Cross-Platform, Unified Reporting
Because Hyros sits above individual ad platforms, it can build a single view of the customer journey that spans Meta, Google, TikTok, email, organic search, and direct traffic. That’s what eliminates the walled garden problem where each platform’s over-crediting itself. You see one conversion with credit distributed across the actual touchpoints, not five platforms each claiming the same sale.
Attribution Fed Back to Ad Platforms
Hyros feeds its attribution data back into ad platform algorithms through what it calls AI Attribution (AIR). When Hyros identifies a conversion that Meta’s pixel missed, it’ll pass that data back to Meta’s optimization algorithm. The result: the ad platform’s machine learning gets more accurate conversion signals, which improves targeting and reduces wasted ad spend. Brands using Hyros commonly report at least a 15% increase in ad ROI from this feedback loop alone. An analysis of 601 Trustpilot reviews by CheckThat.ai found that users consistently reported 29-33% more conversions tracked compared to native platform reporting, aligning with the underreporting gaps mentioned above.
When I ran my own ad accounts through this system, I found $60,000 per month in wasted spend that platform dashboards had hidden. That was $100,000 wasted out of a $300,000 annual budget, gone, with zero impact on actual sales when I cut it. The multi-touch data showed exactly which campaigns were producing and which ones were dead weight that single-touch metrics had propped up.
To see how this attribution approach calculates return on spend, read How to Calculate ROAS.
See multi-touch attribution running on your real ad data. Book a demo
FAQ
What is multi-touch attribution in simple terms?
Multi-touch attribution is a way to measure which marketing channels helped produce a sale. Instead of giving all credit to the first ad someone clicked or the last page they visited before buying, multi-touch attribution splits the credit across every interaction that happened along the way. If a customer saw a Facebook ad, read a blog post, clicked an email, and then searched on Google before purchasing, each of those four touchpoints gets a share of the credit. The size of each share depends on which attribution model you use.
What is the best multi-touch attribution model?
There is no single best model. The right choice depends on your data and goals. If you have low conversion volume (under 200 per month), start with position-based attribution because it captures both the discovery channel and the closing channel without requiring large datasets. If you have high conversion volume (500+ per month) and multiple active channels, data-driven attribution will give you the most accurate picture. Linear and time-decay models are useful as baselines or for specific analyses but are rarely the best long-term choice.
How is multi-touch attribution different from last-click?
Last-click attribution gives 100% of conversion credit to the final touchpoint before the sale. Multi-touch attribution distributes credit across all touchpoints in the journey. The practical difference: last-click over-credits bottom-of-funnel channels (branded search, retargeting, direct visits) and under-credits the awareness and nurture channels that brought the customer into the funnel in the first place. Teams that rely on last-click often cut awareness spending, which eventually shrinks their pipeline without them understanding why.
Does Google Analytics do multi-touch attribution?
Google Analytics 4 (GA4) uses data-driven attribution as its default model and also supports last-click, first-click, linear, position-based, and time-decay models. However, GA4 has significant limitations for multi-touch attribution. It only sees touchpoints within its own tracking scope (primarily web sessions), it struggles with cross-device identity resolution, and it can’t track offline conversions natively. GA4’s data-driven model is also limited to the channels Google can observe, which means interactions on platforms that don’t share data with Google may be underweighted or missing entirely.
What tools do multi-touch attribution well?
Several tools handle multi-touch attribution at different levels. Hyros uses AI-powered, first-party server-side tracking with cross-device identity stitching, which makes it especially strong for businesses affected by iOS 14.5 tracking losses. Other tools in the space include Triple Whale (focused on e-commerce), Northbeam (algorithmic attribution for DTC brands), and Rockerbox (multi-channel attribution with offline support). The right tool depends on your business model, ad spend level, and which platforms you run campaigns on. For businesses spending $10,000+ per month on ads across multiple platforms, dedicated attribution tools consistently outperform platform-native reporting.
Learn more about how AI-powered attribution compares to traditional tracking at Hyros AI Attribution.
Standalone Summary
Multi-touch attribution (MTA) is a measurement method that distributes conversion credit across every marketing touchpoint in a customer’s journey instead of assigning 100% to a single click. The four main models are: (1) linear, which splits credit equally across all touchpoints; (2) time-decay, which gives increasing credit to interactions closer to the purchase; (3) position-based (U-shaped), which assigns 40% each to the first and last touch with 20% split among the middle; and (4) data-driven, which uses algorithms like Markov chains or Shapley values to calculate credit from observed conversion patterns. Use linear as a quick baseline. Use time-decay for short sales cycles where closing touches matter most. Use position-based when discovery and closing channels are strategically important. Use data-driven when you have 500+ monthly conversions and want the highest possible accuracy. Multi-touch attribution faces challenges from iOS privacy changes, cookie deprecation, and platform walled gardens, making first-party server-side tracking increasingly important.
Related in This Series
Silo: Ad Attribution Fundamentals
More from the Ad Attribution Fundamentals series:
- What Is Ad Attribution? A Complete 2026 Guide
- What Is Hyros? How the Ad Tracking Platform Actually Works
- First-Click vs Last-Click Attribution: Which Model to Use
- How to Calculate ROAS: Formula, Examples, and Benchmarks
Also explore: