

Multi-Client Attribution Reporting for Agencies
TL;DR
- The #1 reason agencies lose clients isn’t bad creative or weak strategy. It’s that they can’t prove the ads worked because their reports pull from the same dashboards the client can already open themselves.
- Multi-client attribution reporting gives agencies a single operating view of ad spend, tracked revenue, and true ROAS across every client account. Without it, you’re logging into 20 dashboards every morning and stitching together screenshots for QBRs.
- Aggregator tools like AgencyAnalytics and DashThis pull platform-reported numbers into white-label dashboards. They don’t deduplicate revenue or fix the over-claiming problem. Attribution platforms like Hyros track conversions independently and produce numbers you can actually trust.
- Platform over-reporting wastes 15-20% of ad spend. That’s not a rounding error. That’s real budget your client could be scaling with.
- Agencies that build attribution into their retainer (not as a line-item add-on) retain clients longer and justify higher fees with data the client can’t get anywhere else.
What “Multi-Client Attribution” Actually Means
Here’s the conclusion I’ve come to after years of watching agencies lose accounts they thought were locked in: the big reason clients think their business isn’t scaling, and why they decide their ads aren’t working, is because they think it’s something wrong in the ad manager. They think it’s the front-end funnel. They think it’s the creative. They fire the agency.
It’s none of those things. It’s the data.
Most agency client retention problems aren’t ad-manager problems. Clients fire agencies because the agency can’t prove the ads worked. And the reason they can’t prove it is they’re reporting numbers from the same platforms the client can already log into on their phone. When your report looks identical to what the client sees in their own Meta dashboard, you’re not adding value. You’re adding a layer of delay and a monthly invoice. That’s the actual churn driver. Not bad results. Unprovable results.
Multi-client attribution reporting solves this by giving agencies independent conversion data: numbers that come from their own tracking, not from the platform that has every incentive to overclaim. Each client runs their own ad accounts, their own store or CRM, their own attribution windows. The agency needs a single workspace that handles team time allocation, ROI proof for every account, and early detection of underperformers before they become cancellation conversations.
This sounds like a dashboard problem. It isn’t. It is a data integrity problem dressed up as a dashboard problem.
Reporting vs. Attribution: Two Different Problems
Reporting pulls numbers from ad platforms and displays them. Attribution determines which numbers are correct.
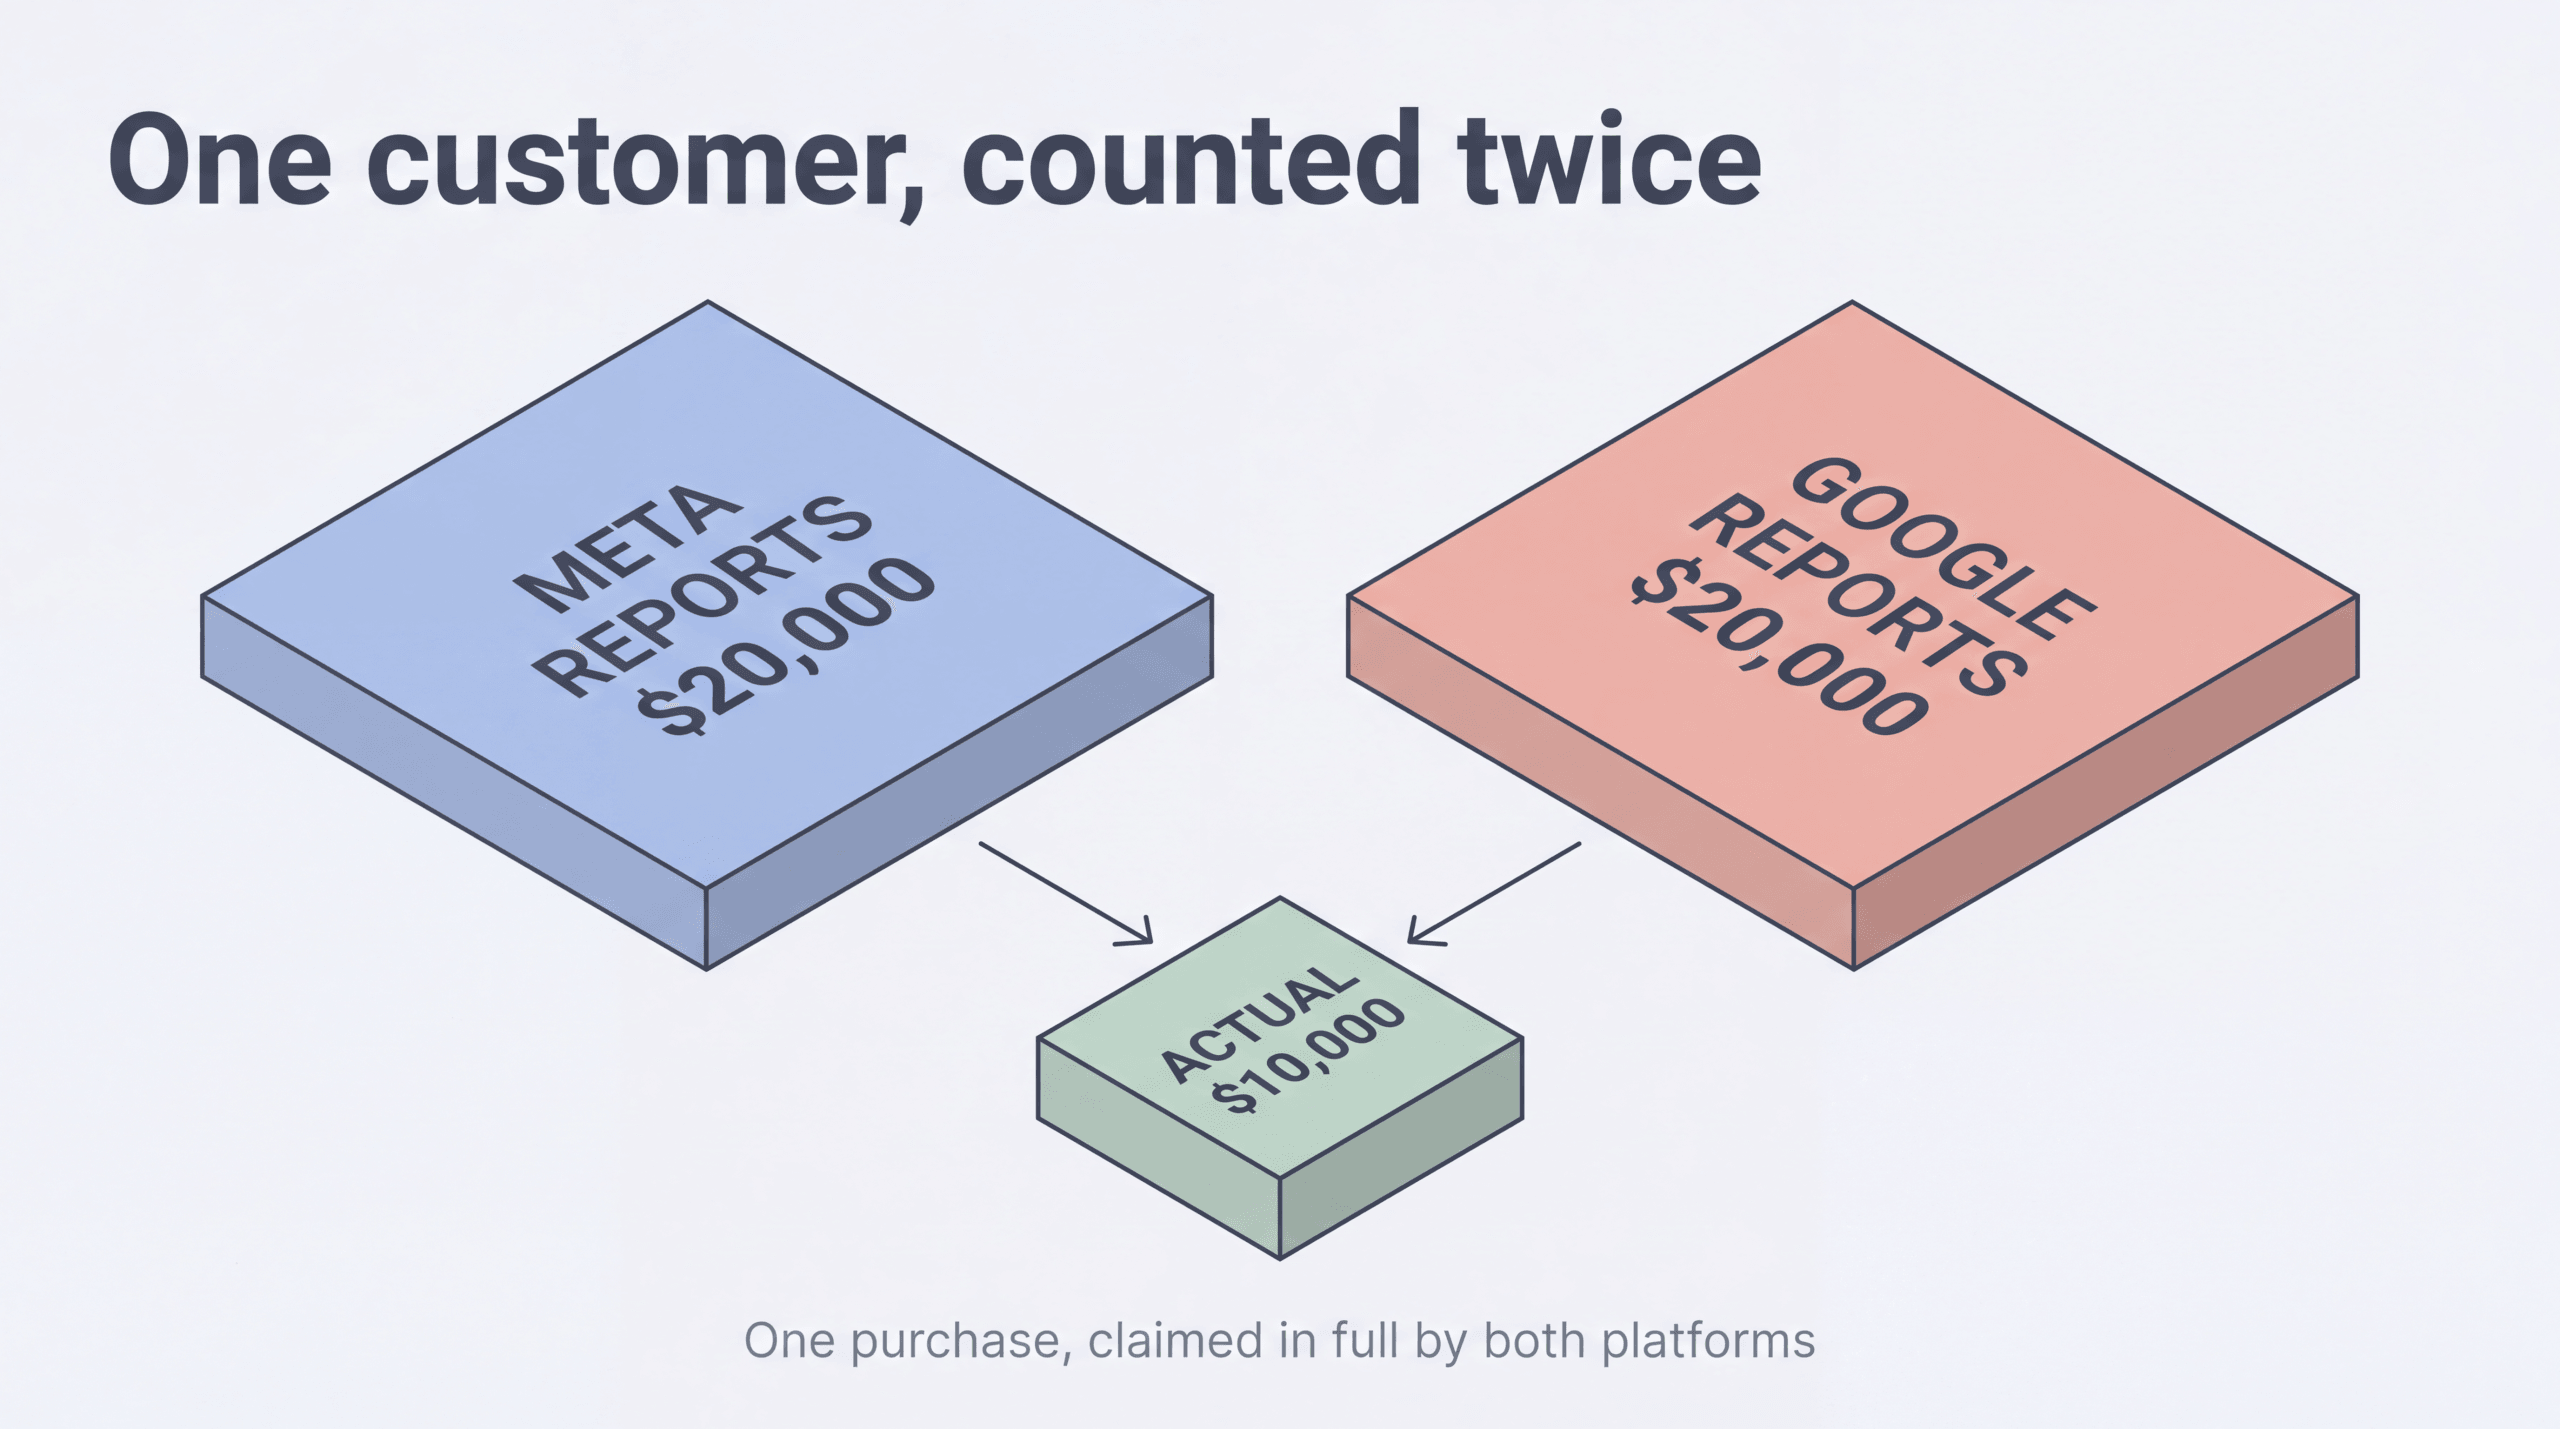
A reporting tool connects to a client’s Google Ads, Meta Ads, and TikTok Ads accounts, pulls the self-reported conversion data, and drops it into a branded PDF. The problem is that each ad platform claims credit for conversions independently. If a customer clicked a Meta ad on Tuesday and a Google ad on Thursday before purchasing, both platforms report the full sale. Your client report now shows $20,000 in Meta revenue and $20,000 in Google revenue for a customer who spent $10,000 once.
Attribution solves this by tracking the customer independently, outside the ad platforms, and assigning credit based on what actually happened. The distinction between reporting and attribution is covered in depth in our guide on ad attribution fundamentals.
Aggregators vs. Attribution Platforms
Aggregators collect and display platform-reported data. Attribution platforms generate their own conversion data.
AgencyAnalytics, Whatagraph, and DashThis are aggregators. They connect to APIs, pull the numbers each platform reports, and present them in a clean format. The underlying data is still whatever Google, Meta, or TikTok decided to claim.
Hyros, Triple Whale, and Rockerbox are attribution platforms. They install their own tracking on the client’s site, build independent conversion records, and produce ROAS numbers that don’t depend on platform self-reporting. For a full comparison of attribution platforms, see our best attribution tools guide.
This isn’t a quality judgment on aggregators. They serve a real purpose: consolidating data from 15 sources into one view saves hours. But if the data going in is wrong, a prettier dashboard doesn’t fix it.
The 15-20% Waste Problem That Gets Agencies Fired
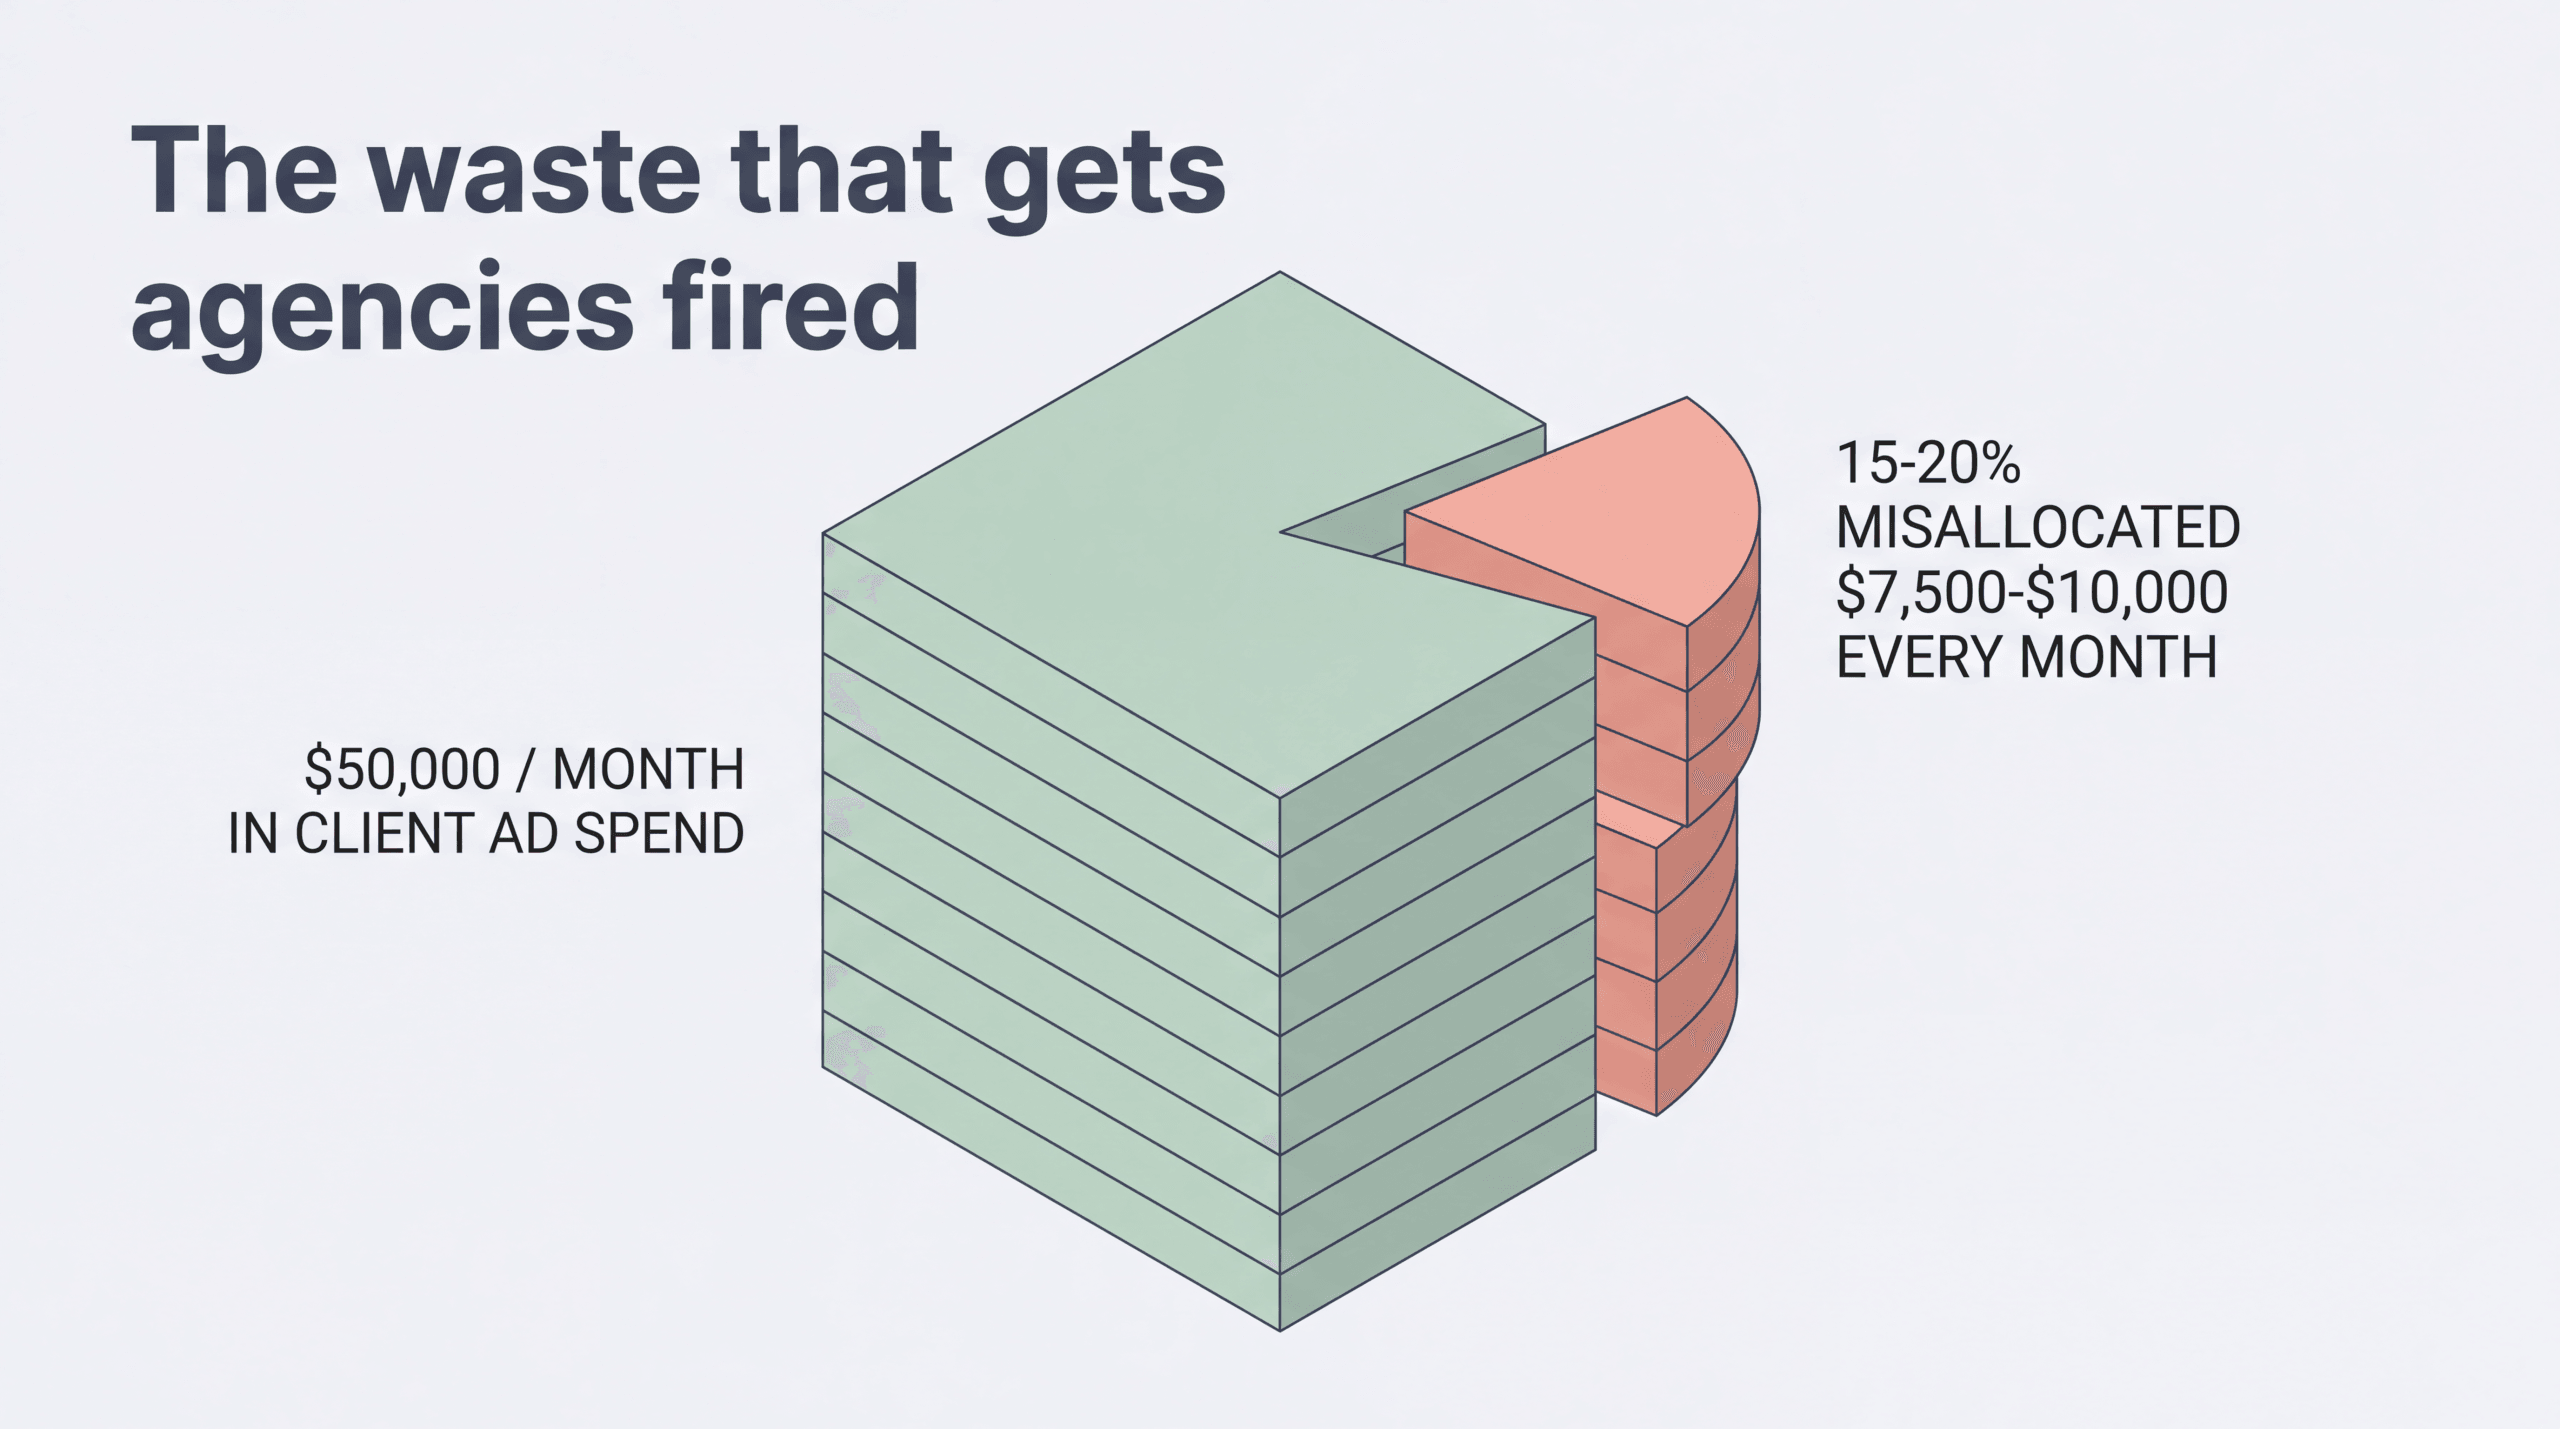
Let me give you a number that should scare you. If you’re overspending on a channel because your attribution is wrong, and you’re optimizing off platform-reported ROAS instead of real tracked ROAS, you’re going to lose 15 to 20% of your ad spend in pure waste. That’s not a small problem. That’s 15 to 20% of your potential scale just gone, because you’re putting money into what looks like a winner on the platform dashboard but is actually a break-even or loser when you account for duplicate attribution.
For an agency managing $50,000/month in client ad spend, that’s $7,500-$10,000/month in budget that gets misallocated every single month. The client eventually notices. In their bank account, if not in the report. That’s when the cancellation email arrives.
I’ve reviewed accounts where this math is stark and the agency had no idea. The ads weren’t bad. The strategy wasn’t bad. The data was bad, and bad data inverts your optimization. You scale the losers because they look like winners. You kill the winners because the platform didn’t give them credit. It’s a double failure: you’re overspending and under-investing at the same time, and it’s completely invisible if you’re running off platform-reported numbers.
The fix is independent attribution. Not because it’s fancy technology. Because it’s the only way to know which ads actually produced revenue.
Why One Dashboard per Client Is a Losing Game
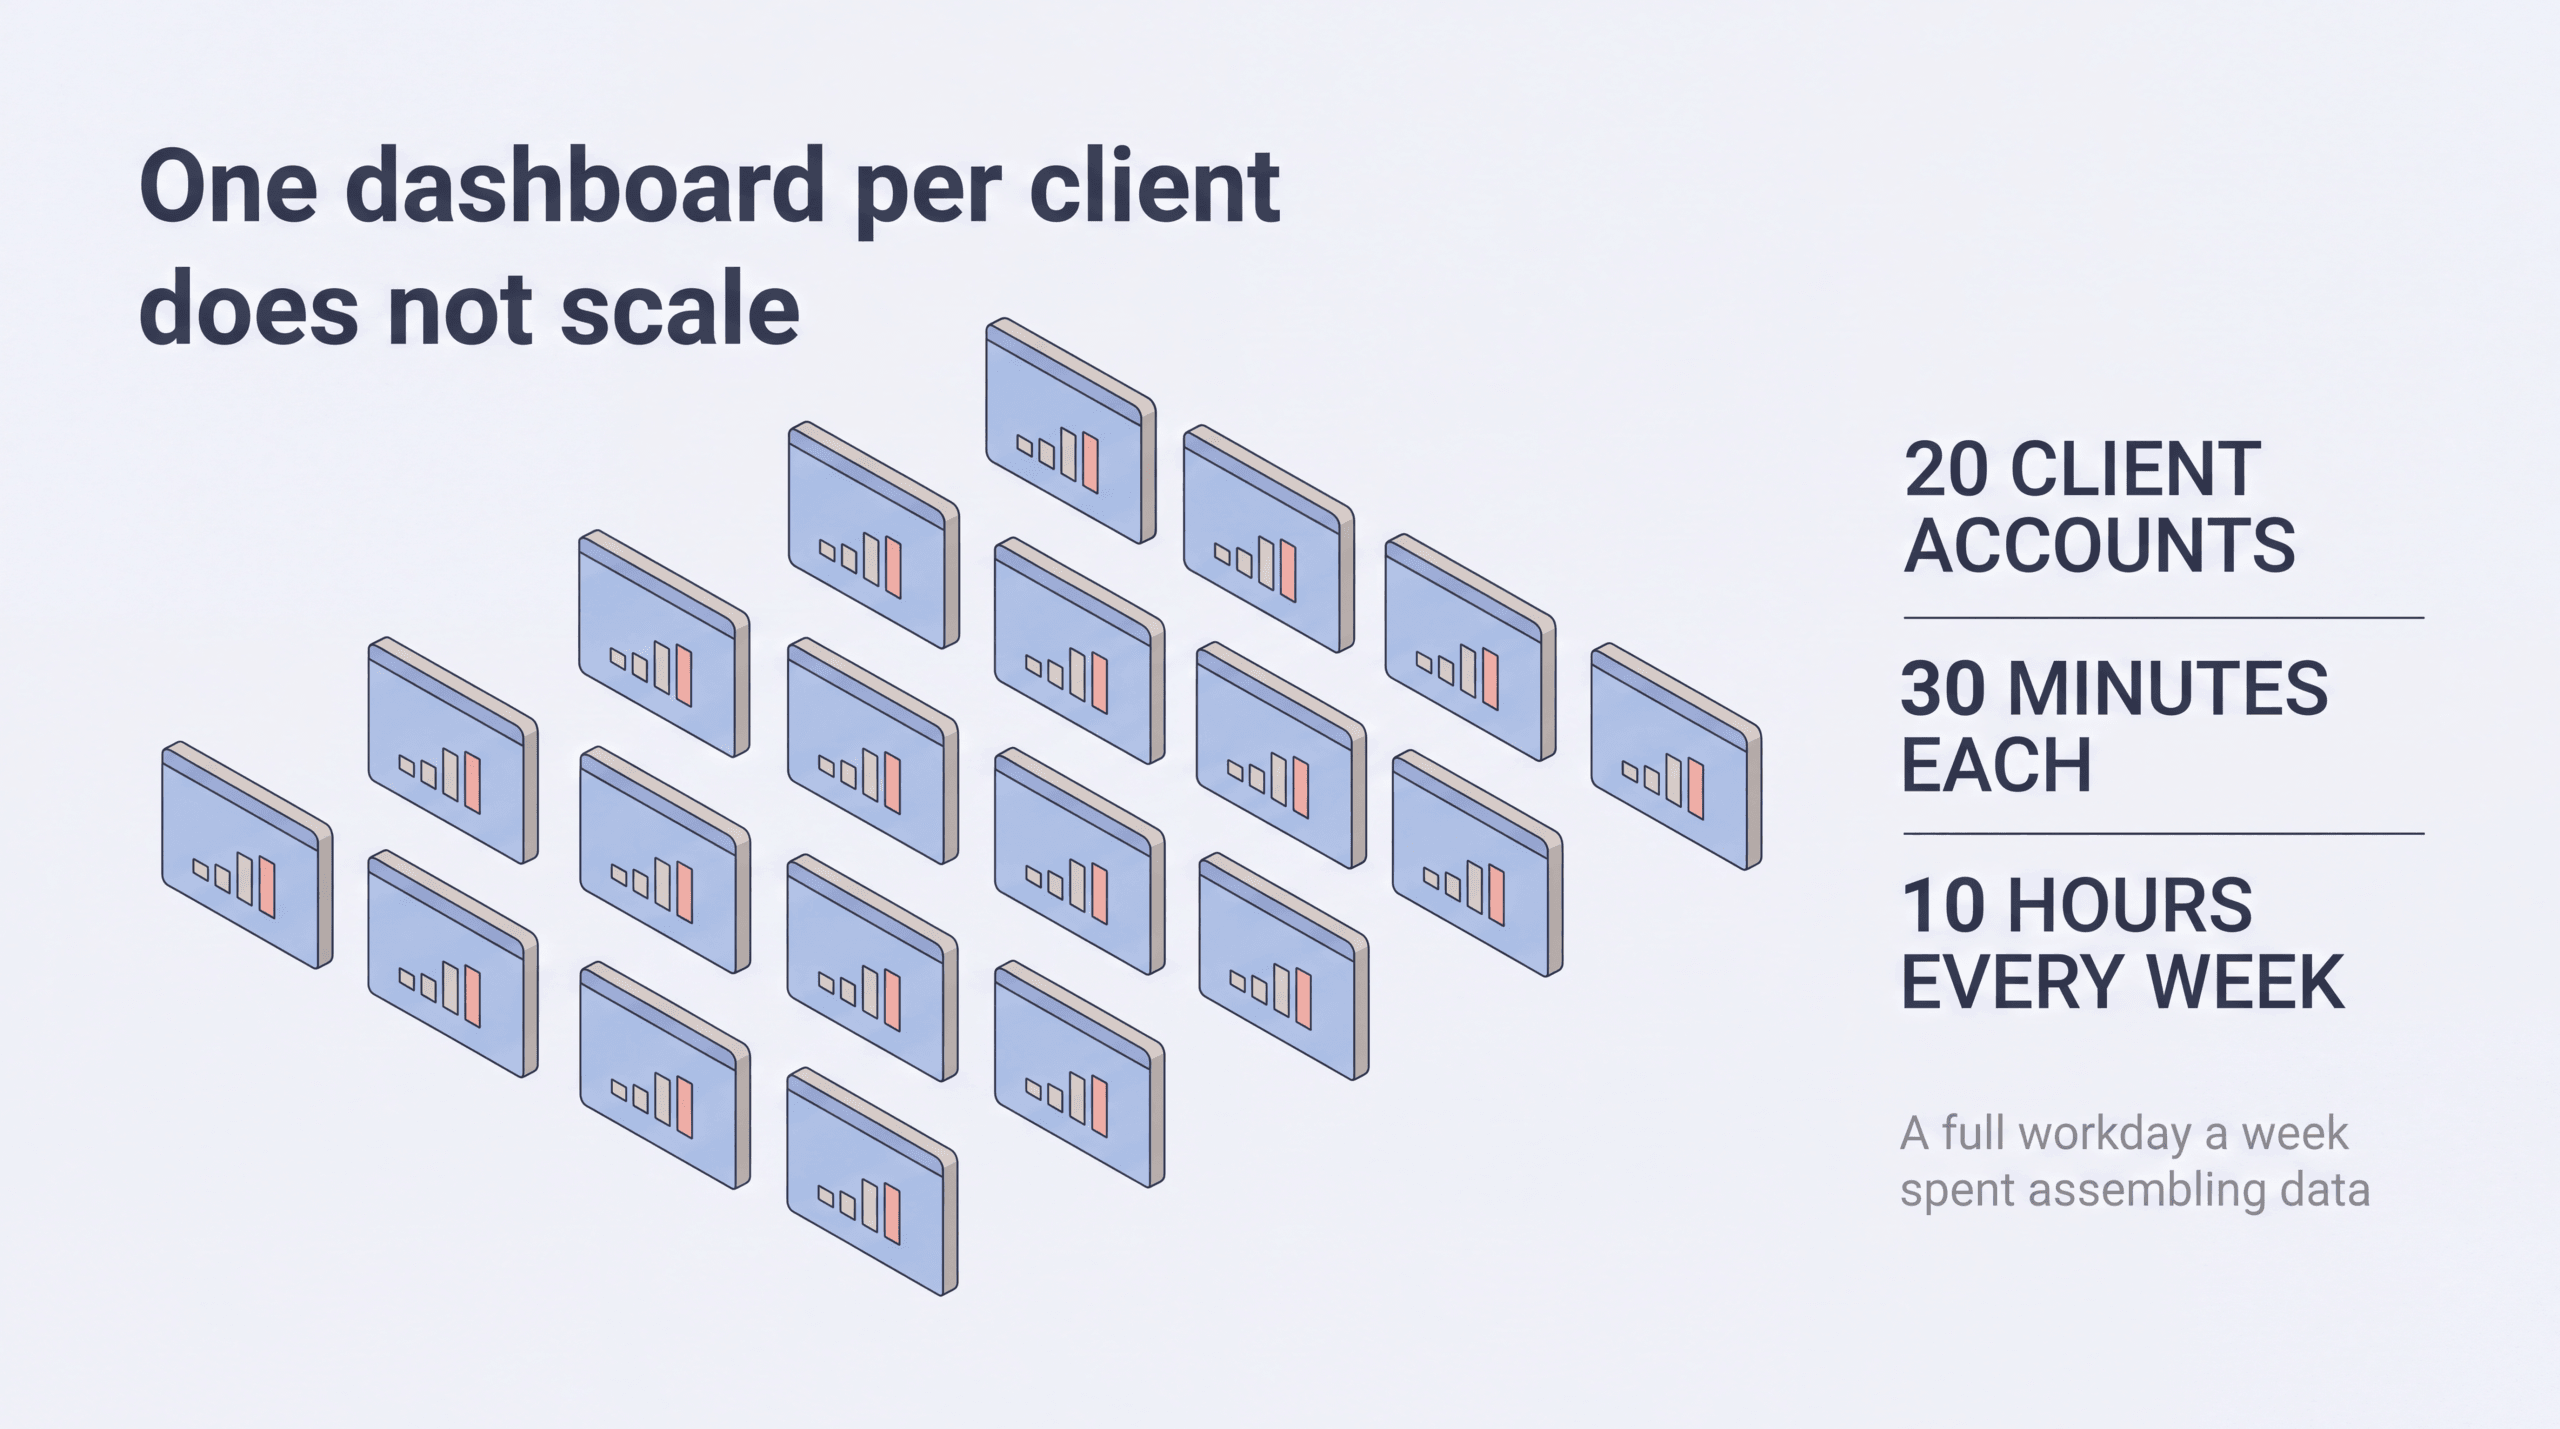
Most paid media agencies manage somewhere between 15 and 60 client accounts. The “one dashboard per client” approach works when you have 3 clients. At 20 clients, it falls apart for three reasons.
The Time Sink: 20 Clients x 30 Minutes = 10 Hours
Pulling up each client’s ad manager, cross-referencing with GA4 or Shopify, building a weekly summary, and formatting it for the client takes 20-40 minutes per account. At 20 accounts, that’s a full workday every week spent on reporting. That time comes directly out of optimization time. That’s the work that actually improves results.
Agencies that bill $5,000-$15,000 per month per client can’t afford to spend 25% of their team’s capacity on data assembly. The reporting process itself becomes a cost center that eats into the margin on every retainer.
No Cross-Client Benchmarking
When each client lives in its own silo, you lose the ability to compare performance across accounts. You can’t answer basic questions: Which of my 20 clients has the lowest CAC? Which client’s Meta Ads performance dropped 30% this week while everyone else held steady? Is a 3.2x ROAS good for this vertical or are my other e-commerce clients averaging 4.5x?
Cross-client benchmarking is one of the most valuable things an agency can offer. It requires all clients in one workspace with normalized metrics.
You Cannot Spot Underperformers Before the QBR
Quarterly business reviews are where agencies lose clients. The client asks “How are my ads doing?” and you show a report. If the report contains bad news the client is seeing for the first time, trust is already gone.
Client churn in paid media agencies runs 18-42% annually depending on business model, with project-based agencies at the higher end. A common reason, according to agency practitioners: “I can’t tell if my ads are working.” The fix isn’t better slides. The fix is real-time visibility into every client’s performance so you catch problems in week 2, not month 3.
I’ve had conversations with agency owners who lost accounts they thought were happy. The client wasn’t unhappy with the results. They were unhappy with the uncertainty. They couldn’t verify the numbers. When your reports pull straight from ad manager, the client can pull the same report and wonder why your analysis costs $8,000/month. Independent attribution gives you data they cannot replicate themselves. That’s where the retention comes from.
The 4x ROAS Problem (and Why It Gets Agencies Fired)
Let me walk you through the scenario I’ve seen more times than I can count. An agency is managing a client’s Meta spend, let’s say $40,000/month. Meta’s dashboard shows 4x ROAS. The agency puts together a QBR deck, highlights the 4x number, and the account manager presents it with confidence. Good meeting. Client seems happy.
Three months later, the client fires them.
Here’s what actually happened. The agency was pulling ROAS from Meta’s self-reported dashboard: the same dashboard that credits Meta for every purchase that touches a Meta ad anywhere in the attribution window. Meanwhile, Hyros was tracking conversions independently using server-side data, matching purchases to actual customers via first-party identifiers. When I’ve looked at accounts like this, the tracked ROAS isn’t 4x. It’s 2.6x.
That gap (4x on the Meta dashboard, 2.6x in reality) is the entire relationship. The client can feel the 2.6x in their bank account even if they can’t name it. They see the ad spend going out and the revenue coming in and the math doesn’t work the way the agency’s report says it should. So they start questioning everything. Then they question the agency.
The agency wasn’t doing bad work. They were reporting bad data. Same ads. Same spend. Different truth. Independent attribution is the only way to show the client the real number and to defend your work with data they can’t dispute.
What Every Client Report Actually Needs
Strip away the vanity metrics and every client wants the same six things in their report. Get these right and the QBR becomes a 15-minute confirmation call instead of a 90-minute defense hearing.
Spend by Channel
Total spend broken down by platform: Google Ads, Meta Ads, TikTok Ads, email, whatever channels are active. The client wants to know where their money went. This is the easy part. Every aggregator and attribution platform provides this.
Tracked, Deduplicated Revenue
This is where most agency reports fail. The client wants to know how much revenue their ads produced. If you sum the revenue each platform claims, you get a number that’s 150-250% of actual revenue, according to Databox research. That inflated number might impress the client for one quarter. Then they compare it to their bank account and the relationship is over.
Deduplicated revenue means each sale is counted once, attributed to the touchpoints that actually drove it. This requires independent attribution, not platform-reported data. For a full breakdown of how ROAS calculations depend on accurate revenue tracking, see How to Calculate ROAS.
Blended vs. Platform ROAS
Platform ROAS is what each ad network reports individually. Blended ROAS is total tracked revenue divided by total ad spend across all channels. Clients need both.
Platform ROAS shows channel-level performance. Blended ROAS shows the overall health of the ad program. When platform ROAS looks strong but blended ROAS is flat, it usually means the platforms are double-counting conversions. That discrepancy is a red flag that demands investigation, not celebration. Our blended ROAS guide covers how to calculate and interpret this metric.
CAC Trend Week-over-Week
Customer acquisition cost should trend downward over time as you optimize. If it’s creeping up, the client needs to know before it becomes a crisis. Weekly CAC trending (not monthly snapshots) gives you the resolution to catch problems early.
Top 5 Performing Ads
Clients don’t want to review 200 ad variations. They want to know which 5 ads are producing the most revenue at the best ROAS. Highlight winners, flag anything that degraded, and recommend next steps.
Plain-English Summary
A paragraph at the top of every report that says what happened, what you did about it, and what you plan to do next week. No jargon. No acronyms the client has to Google. “We spent $42,000 across Meta and Google this week. Tracked revenue was $168,000, for a blended ROAS of 4.0x. That is up from 3.6x last week. The top-performing ad was the UGC testimonial video on Meta, which generated $31,000 at a 6.2x ROAS. We are scaling that ad to a second audience this week.”
That summary is worth more to the client than 40 pages of charts.
Workspace Architecture: How to Structure Multiple Clients
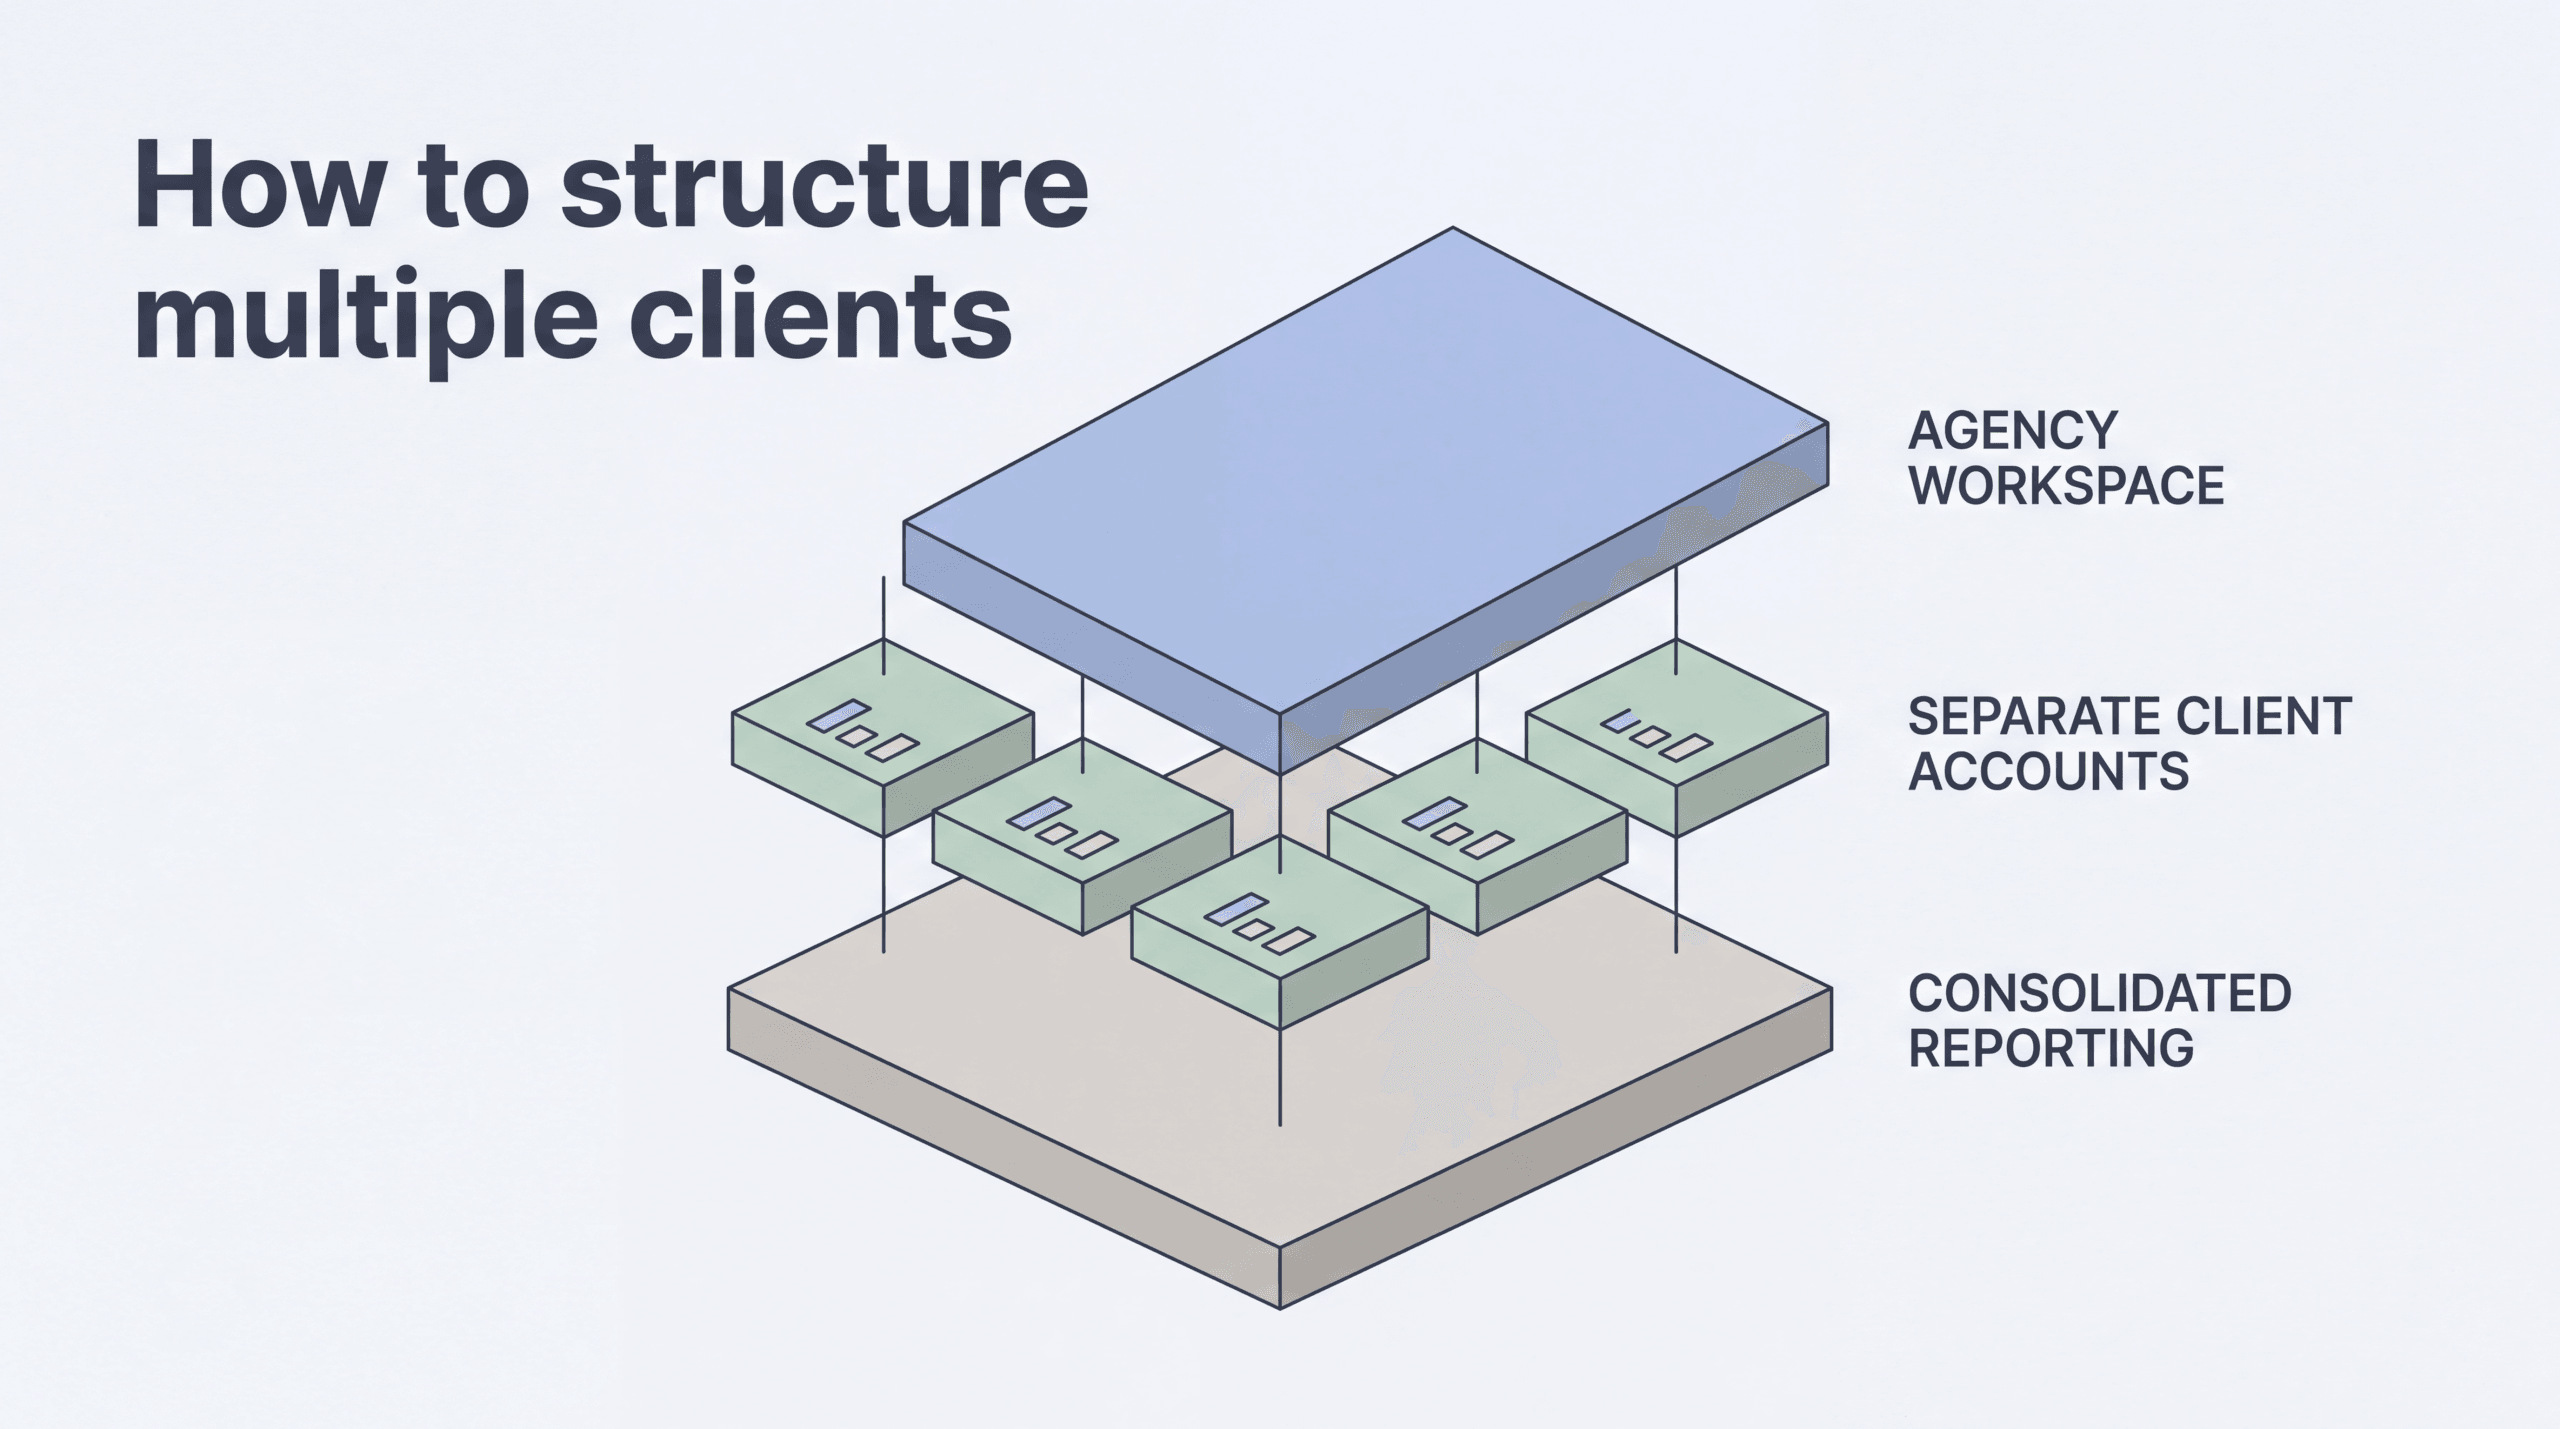
The technical question every agency hits: do you put all clients in one workspace, or give each client its own?
One Workspace per Client vs. Master Workspace
Most attribution platforms charge per workspace. If you create 20 separate workspaces, one per client, you are paying 20 separate fees and logging into 20 separate environments. That defeats the purpose of consolidation.
The better architecture is a master workspace with client-level segmentation. Your team sees all clients in one login. Each client’s data is isolated so there’s no cross-contamination. Permissions control who sees what.
Some platforms support this natively. Others force the one-workspace-per-client model and charge accordingly. This is a critical evaluation criterion when choosing an attribution tool for agency use.
Permissions and Team Access
A 10-person agency needs role-based access. Media buyers should see only their assigned clients. Account directors should see all clients. The reporting team needs read access without the ability to change tracking settings.
Without granular permissions, you either give everyone access to everything (security risk, especially with client payment data) or you create separate logins for every person-client combination. A management nightmare.
White-Label and Client-Facing Access
Most agency clients want reports in their brand, not yours. White-label capability (replacing the tool’s logo and domain with the agency’s brand or the client’s brand) is table stakes for agency reporting tools.
The deeper question is whether you give the client their own login. Some agencies prefer to control the narrative by sending PDF reports. Others give clients a live dashboard so they can check numbers anytime. The right answer depends on the client relationship, but the tool needs to support both options.
Client-Facing Login vs. Internal-Only
Giving clients login access builds trust. They can verify numbers without waiting for your weekly email. But it also means they can see data without context, misinterpret a bad week, and fire off a panicked email at midnight.
The middle ground: a client-facing view that shows the six metrics listed above (spend, deduplicated revenue, blended ROAS, CAC trend, top ads, and summary) without exposing the full backend. The client gets transparency. You keep control of the narrative around the data.
The Tool Landscape
Agency attribution tools fall into three categories, each solving a different part of the problem.
White-Label Aggregators: AgencyAnalytics, Whatagraph, DashThis, Looker Studio
These tools pull data from ad platform APIs, Google Analytics, Shopify, and other sources into customizable dashboards. They are built for agencies. White-labeling, client-facing portals, automated report delivery, and multi-client management are their core features.
What they do well: Save time on report assembly. Present data cleanly. Handle 50+ integrations. Support white-label branding.
What they don’t do: Fix bad data. If Meta Ads over-reports conversions by 30%, the aggregator displays that inflated number in a nice chart. The dashboard looks professional. The data is still wrong.
Looker Studio (formerly Google Data Studio) is free but requires manual setup for each client. It connects to Google products natively and everything else through community connectors of varying reliability. Agencies with engineering resources use it. Agencies without engineering resources burn weeks trying to make it work.
Attribution Platforms: Hyros, Triple Whale, Rockerbox
These platforms install independent tracking on the client’s website, build their own conversion records, and produce attribution data that doesn’t depend on ad platform self-reporting.
What they do well: Produce accurate revenue numbers. Deduplicate conversions across channels. Show the real customer journey from first click to purchase.
What they cost: Attribution platforms charge per workspace or per tracked revenue volume. Running 20 clients on individual workspaces gets expensive fast. That’s why agency-specific pricing models matter.
For head-to-head comparisons, see Hyros vs Triple Whale and Hyros vs Rockerbox.
Custom BigQuery + Looker for Enterprise
Large agencies (50+ clients, $10M+ under management) sometimes build custom data warehouses. Raw data from every platform flows into BigQuery. A BI layer like Looker or Tableau sits on top. Custom attribution models run in SQL or Python.
This approach gives total control. It also requires a data engineering team, costs $10,000-$30,000/month in infrastructure and salaries, and takes 3-6 months to build. It’s the right choice for agencies at scale. It is overkill for a 15-client shop.
How to Price Attribution Into Your Agency Retainer
Most agencies make the mistake of offering attribution as an add-on. “For an extra $500/month, we can set up advanced tracking.” The client hears “optional expense” and passes.
The better approach: build attribution cost into the base retainer and position accurate data as a core deliverable, not an upsell. You aren’t charging for a tool. You are charging for trustworthy numbers.
Here is the math. If your attribution platform costs $200/month per client and your retainer is $5,000/month, that’s 4% of the retainer. The value to the client, knowing which ads actually produce revenue instead of guessing, is worth far more than 4% of their ad management fee. According to LayerFive, nearly half of marketing spend is wasted due to poor attribution. If your client spends $100,000/month on ads, poor attribution could be wasting $47,000/month. A $200 attribution tool that prevents even 5% of that waste pays for itself 100 times over.
My team reviews agency accounts regularly where the math on this is stark. I’ve seen agencies charging $5,000/month show clients a 4x ROAS from ad manager. When we run server-side attribution, the real number is closer to 2.6x. That’s the difference between a client who renews and a client who fires you. The agency wasn’t doing bad work. They were reporting bad data. Same ads. Same spend. Different truth.
Agencies that include attribution in their standard offering do three things differently:
- Higher retainers. They charge $7,000-$15,000/month instead of $3,000-$5,000 because they deliver data nobody else can provide.
- Lower churn. Clients who can see exactly which ads produce revenue have less reason to question the relationship. The data answers the questions before the client asks them.
- Easier upsells. When the attribution data shows a clear opportunity (“Your TikTok CAC dropped 40% this month, here is why we should increase spend”), the client says yes because they trust the numbers.
How Hyros Handles Multi-Client Reporting
I originally built Hyros because I needed it for my own businesses. I couldn’t scale ad spend because my attribution data was wrong. I was optimizing off platform numbers, wasting 15-20% in misallocated budget, and had no idea which campaigns were actually driving revenue. Nothing else on the market solved the problem the way I needed it solved. So I built it. Then 4,000+ other businesses needed the same thing.
For agencies specifically, Hyros offers a pricing model designed for shops managing multiple client accounts. Instead of paying full price per workspace, agencies get consolidated billing and a master view across all client accounts.
Here is what the agency setup looks like in practice:
Workspace isolation. Each client gets their own tracking instance. Client A’s data never mixes with Client B’s data. Attribution windows, conversion events, and reporting settings are configured per client.
One login, all clients. The agency team logs into a single Hyros dashboard and switches between client workspaces without re-authenticating. Weekly status checks that used to take 10 hours now take 2 because every client’s data is one click away.
Independent attribution per client. Each client workspace runs Hyros’s server-side tracking independently. Conversions are matched using first-party identifiers (email, phone, deterministic user matching) instead of platform-reported data. In the accounts I’ve reviewed, Hyros typically surfaces 29-33% more sales than ad platforms report alone. For an agency, this means the ROAS numbers in your client reports reflect actual revenue, not inflated platform claims.
Cross-client visibility. Agency owners can compare blended ROAS, CAC, and ad performance across all clients from a single view. Which client is trending up? Which one needs intervention? You see it without opening 20 tabs.
API access for custom reporting. For agencies that want to build custom dashboards or feed data into their own BI tools, Hyros provides API access to attribution data. Pull tracked revenue, ad-level ROAS, and customer journey data into whatever reporting format your clients expect.
Hyros pricing starts at $230/month (annual) for the entry plan. Agency rates (which include consolidated billing across multiple client workspaces) are quote-based depending on client count, tracked volume, and contract terms. For current pricing details, see hyros.com/pricing-ai-tracking.
FAQ
What is the best attribution tool for agencies?
It depends on what you need. If you need white-label dashboards that aggregate platform-reported data, AgencyAnalytics and DashThis are built for that. If you need independent attribution that produces accurate, deduplicated revenue numbers, Hyros is built for multi-client agency use with consolidated workspace management. Most agencies need both: an attribution platform for data accuracy and an aggregator for presentation. See our full tool comparison.
Can I white-label attribution reports without sharing client logins?
Yes. Most attribution platforms allow you to export data via API or scheduled reports. You pull the attribution data into your own branded template (whether that’s a PDF, a Looker Studio dashboard, or a custom portal) and the client never sees the underlying tool. Hyros supports API-based data extraction for exactly this use case.
Can I run 20 Shopify stores on one attribution platform?
Technically yes, but the cost depends on the platform’s pricing model. Platforms that charge per workspace make 20 stores expensive. Platforms with agency pricing (like Hyros) consolidate billing so you aren’t paying 20 individual subscription fees. Each Shopify store still gets its own tracking instance and attribution data. The difference is in the billing and the management interface.
How much should I charge clients for attribution reporting?
Don’t charge for it separately. Build it into your retainer. If your attribution tool costs $150-$300/month per client, absorb that into a retainer that’s $2,000-$5,000 higher than agencies that send screenshots from ad manager. The client is paying for accurate data and better decisions, not for access to a tool. Agencies that itemize attribution as a line item see higher pushback and lower adoption.
What is the difference between AgencyAnalytics and Hyros?
AgencyAnalytics is a reporting aggregator. It connects to ad platforms, SEO tools, social media accounts, and other data sources, then displays their self-reported numbers in a white-label dashboard. Hyros is an attribution platform. It installs independent tracking on the client’s website, builds its own conversion records using server-side data collection, and produces revenue numbers that don’t depend on what the ad platforms claim. AgencyAnalytics shows you what Google and Meta say happened. Hyros shows you what actually happened. Many agencies use both: Hyros for accurate data, AgencyAnalytics for client-facing presentation.
How do I know if my agency needs independent attribution?
If your clients spend more than $20,000/month on ads across multiple channels, platform-reported data is almost certainly inflated. The test is simple: add up the conversions each platform reports for a client last month, then compare that total to the actual number of customers in the client’s CRM or payment processor. If the platforms report 50-150% more conversions than actually occurred, you need independent attribution. That gap isn’t unusual. It is the norm.
Standalone Summary
Multi-client attribution reporting gives agencies a unified view of ad spend, tracked revenue, and true ROAS across all client accounts in a single workspace. The reason agencies lose clients isn’t bad creative. It’s that they can’t prove the ads worked, and their reports show the same numbers the client can already pull themselves. Aggregator tools like AgencyAnalytics and DashThis consolidate platform-reported data into white-label dashboards but don’t fix the underlying data accuracy problem. Ad platforms over-claim conversions, summing their reports produces 150-250% of actual customer counts, and over-reported ROAS wastes 15-20% of ad spend through misallocated optimization. Independent attribution platforms like Hyros install server-side tracking on each client’s site, deduplicate conversions across channels, and produce revenue numbers agencies can defend. The operational impact is significant: agencies managing 15-60 clients spend 10+ hours per week on manual reporting without consolidated tools, can’t benchmark across clients, and miss underperformance until quarterly reviews. Building attribution into the base retainer instead of offering it as an add-on leads to higher retainers, lower client churn, and easier upsells backed by data the client can’t dispute.
Hyros offers an agency plan built for multi-client reporting. See how 4,000+ businesses manage every client ROAS in one login → Book a demo
Related in This Series
Silo: Ad Attribution Fundamentals
More from the Ad Attribution Fundamentals series:
- B2B Attribution: Tracking Ads Across Long Sales Cycles
- The 7 Best Ad Attribution Tools in 2026 (Honest Breakdown)
- What Is Ad Attribution? A Complete 2026 Guide
- What Is Hyros? How the Ad Tracking Platform Actually Works
Also explore: