

Blended ROAS Explained: Why It Matters in 2026
TL;DR
Blended ROAS is total revenue divided by total ad spend across every paid channel, and most advertisers refuse to look at it because it makes their ads look worse. Platform-reported ROAS from Meta and Google began diverging sharply from real business results after iOS 14.5, and I’ve reviewed enough accounts at Hyros to know the gap isn’t small. A 2024 analysis of five ecommerce brands found that Meta reported 4x ROAS and Google reported 3.2x ROAS on the same campaigns where actual Shopify-verified blended ROAS came in at 1.9x. Blended ROAS became the financial sanity check that DTC brands rely on to reconcile what ad platforms claim with what the bank account confirms. This article covers the formula, worked examples, the difference between blended ROAS and MER, and how to use blended ROAS alongside channel-level attribution for real decision-making.
Overview
You’re probably looking at your platform ROAS right now and thinking your ads are working. You’re wrong, or at least, you’re looking at the wrong number. Blended ROAS is total company revenue divided by total ad spend across every paid channel, regardless of which ad a customer clicked. The formula is Blended ROAS = Total Revenue / Total Ad Spend. Unlike platform ROAS (the number Meta or Google reports), blended ROAS ignores attribution conflicts between walled gardens and uses a single source of truth: the store’s actual sales. DTC brands use it as a sanity check when platform-reported ROAS no longer matches bank deposits.
Here’s the thing most people miss: the big reason brands don’t think their ads are scaling is because they think it’s something they’re not doing in the ad manager. Better creative. Better targeting. Better copy. But blended ROAS reveals the margin truth that platform ROAS hides. If your total revenue divided by total spend isn’t clearing your break-even multiple, no amount of ad-manager optimization changes that. You’re not fighting a creative problem. You’re fighting a measurement problem that’s been there the whole time.
The term “blended ROAS” entered the mainstream vocabulary of ecommerce operators around mid-2021, right after Apple’s iOS 14.5 update gutted the tracking infrastructure that Meta, Google, and other ad platforms relied on. Before iOS 14.5, platform ROAS was close enough to reality that most brands trusted it. After the update, the gap between what platforms reported and what actually happened in the store widened to a point where ignoring it meant making budget decisions on fiction. According to a Databox analysis, summing all platform-reported conversions produces 150-250% of actual closed customers. That isn’t a rounding error. That is Meta, Google, and TikTok each claiming full credit for the same purchase, stacking phantom revenue on top of real revenue until the dashboard looks nothing like the bank account.
Blended ROAS exists specifically to collapse that inflated number back to reality. It doesn’t tell you which channel drove the sale. It tells you whether your total paid advertising investment produced a profit. That distinction matters because it sets the floor for every other attribution conversation. If blended ROAS is below your break-even threshold, no amount of channel-level optimization changes the fact that you’re losing money on ads. And according to LayerFive research, nearly half of marketing spend is wasted due to poor attribution, a problem that starts with trusting platform numbers that were designed to sell more ad inventory, not to give you the truth.
For a full breakdown of how return on ad spend works at the channel level, see How to Calculate ROAS.
How Do You Calculate Blended ROAS?
Blended ROAS = Total Revenue / Total Ad Spend
That is the entire formula. No attribution windows. No view-through conversions. No modeled estimates.
Total Revenue means all revenue your store generated in a given period. Pull this from Shopify, WooCommerce, your payment processor, or your accounting software. Not from ad platforms.
Total Ad Spend means every dollar you put into paid advertising during that same period. This includes Meta Ads, Google Ads, TikTok Ads, YouTube, Pinterest, programmatic display, podcast ads, direct mail if you count it as advertising, and any other channel where you paid for distribution.
A quick example:
- Total revenue for March: $250,000
- Total ad spend for March: $62,500
- Blended ROAS: $250,000 / $62,500 = 4.0x
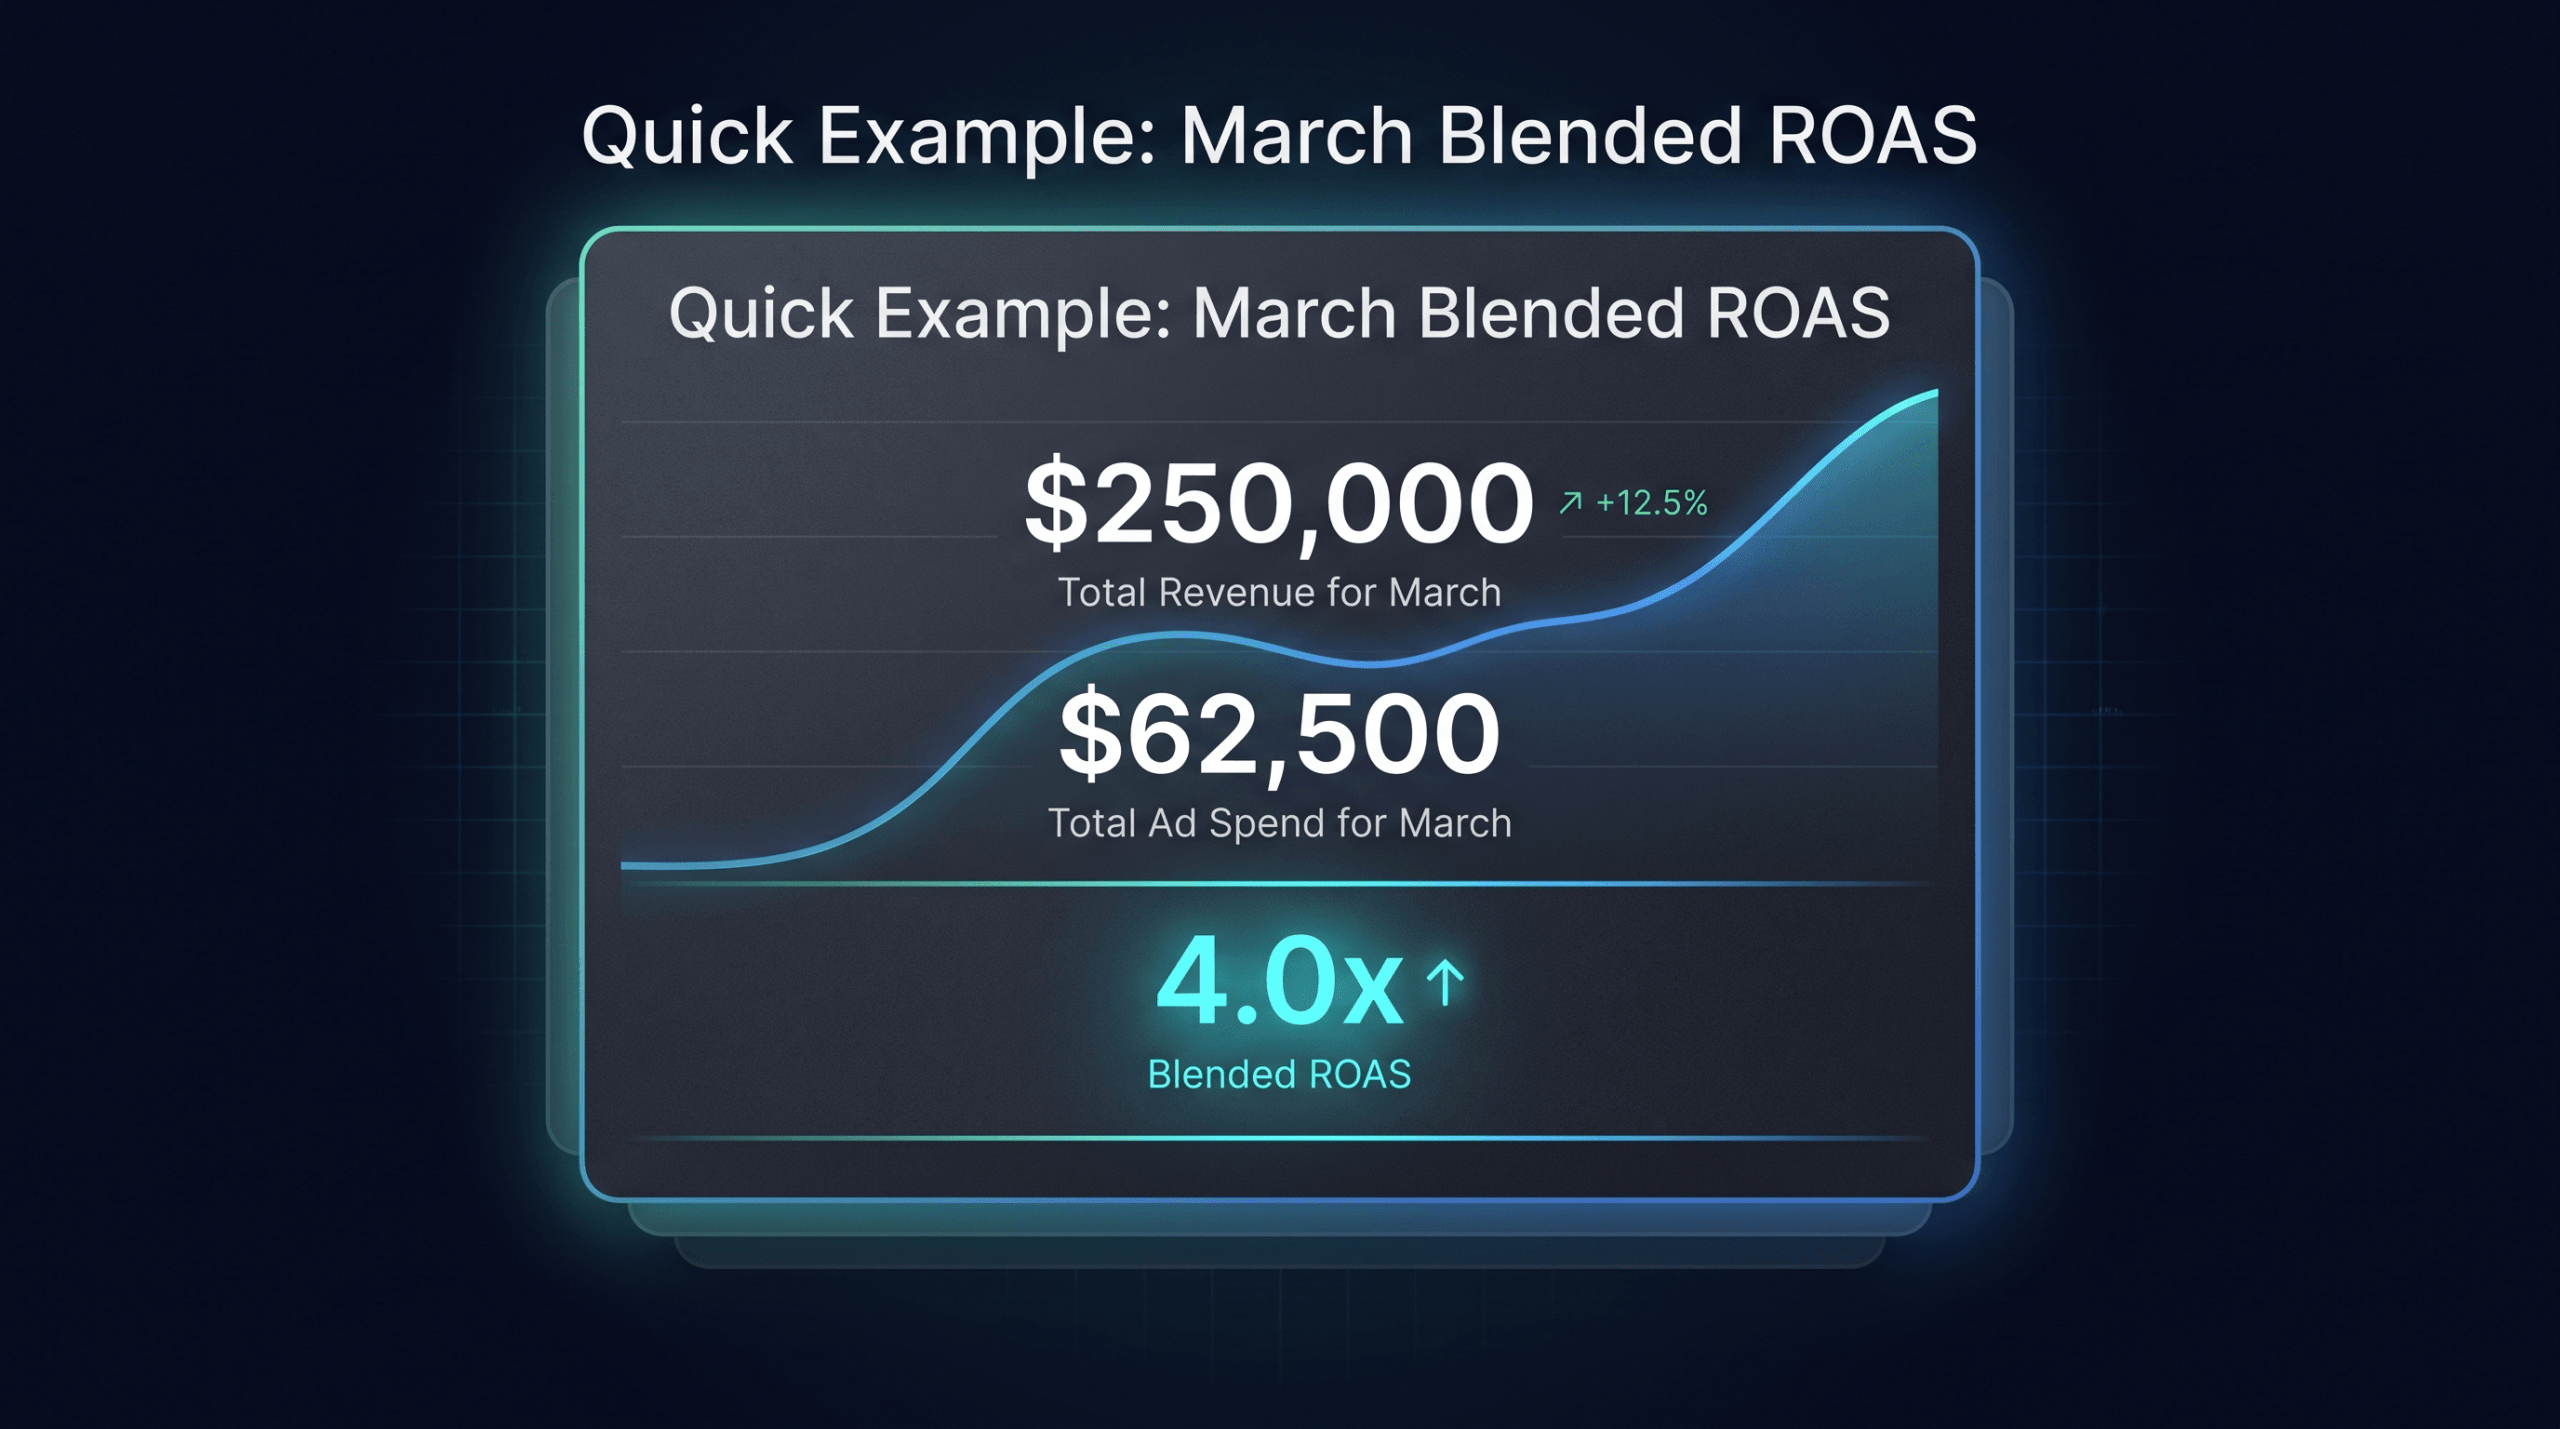
That 4.0x means you generated $4 in revenue for every $1 spent on advertising. Whether that’s profitable depends on your gross margins, fulfillment costs, and fixed overhead.
How Does Blended ROAS Differ from Platform ROAS?
| Blended ROAS | Platform ROAS | |
|---|---|---|
| Data source | Store revenue (Shopify, Stripe, etc.) | Platform’s own tracking pixel + modeled data |
| Attribution model | None. Total in, total out. | Platform-specific (last click, view-through, modeled) |
| Double-counting risk | Zero. One revenue number, one spend number. | High. Meta and Google both claim credit for the same sale. |
| Channel-level insight | None. It is a single blended number. | Yes, but accuracy is questionable post-iOS 14.5. |
| Best use | Financial sanity check. “Are we making money on ads?” | Directional optimization. “Which ad set should I scale?” |
| Post-iOS 14.5 reliability | High. Revenue data comes from the store, not a pixel. | Degraded. Relies on modeled conversions and limited signal. |
The core tension: platform ROAS is granular but biased. Blended ROAS is accurate but blind to channel contribution.
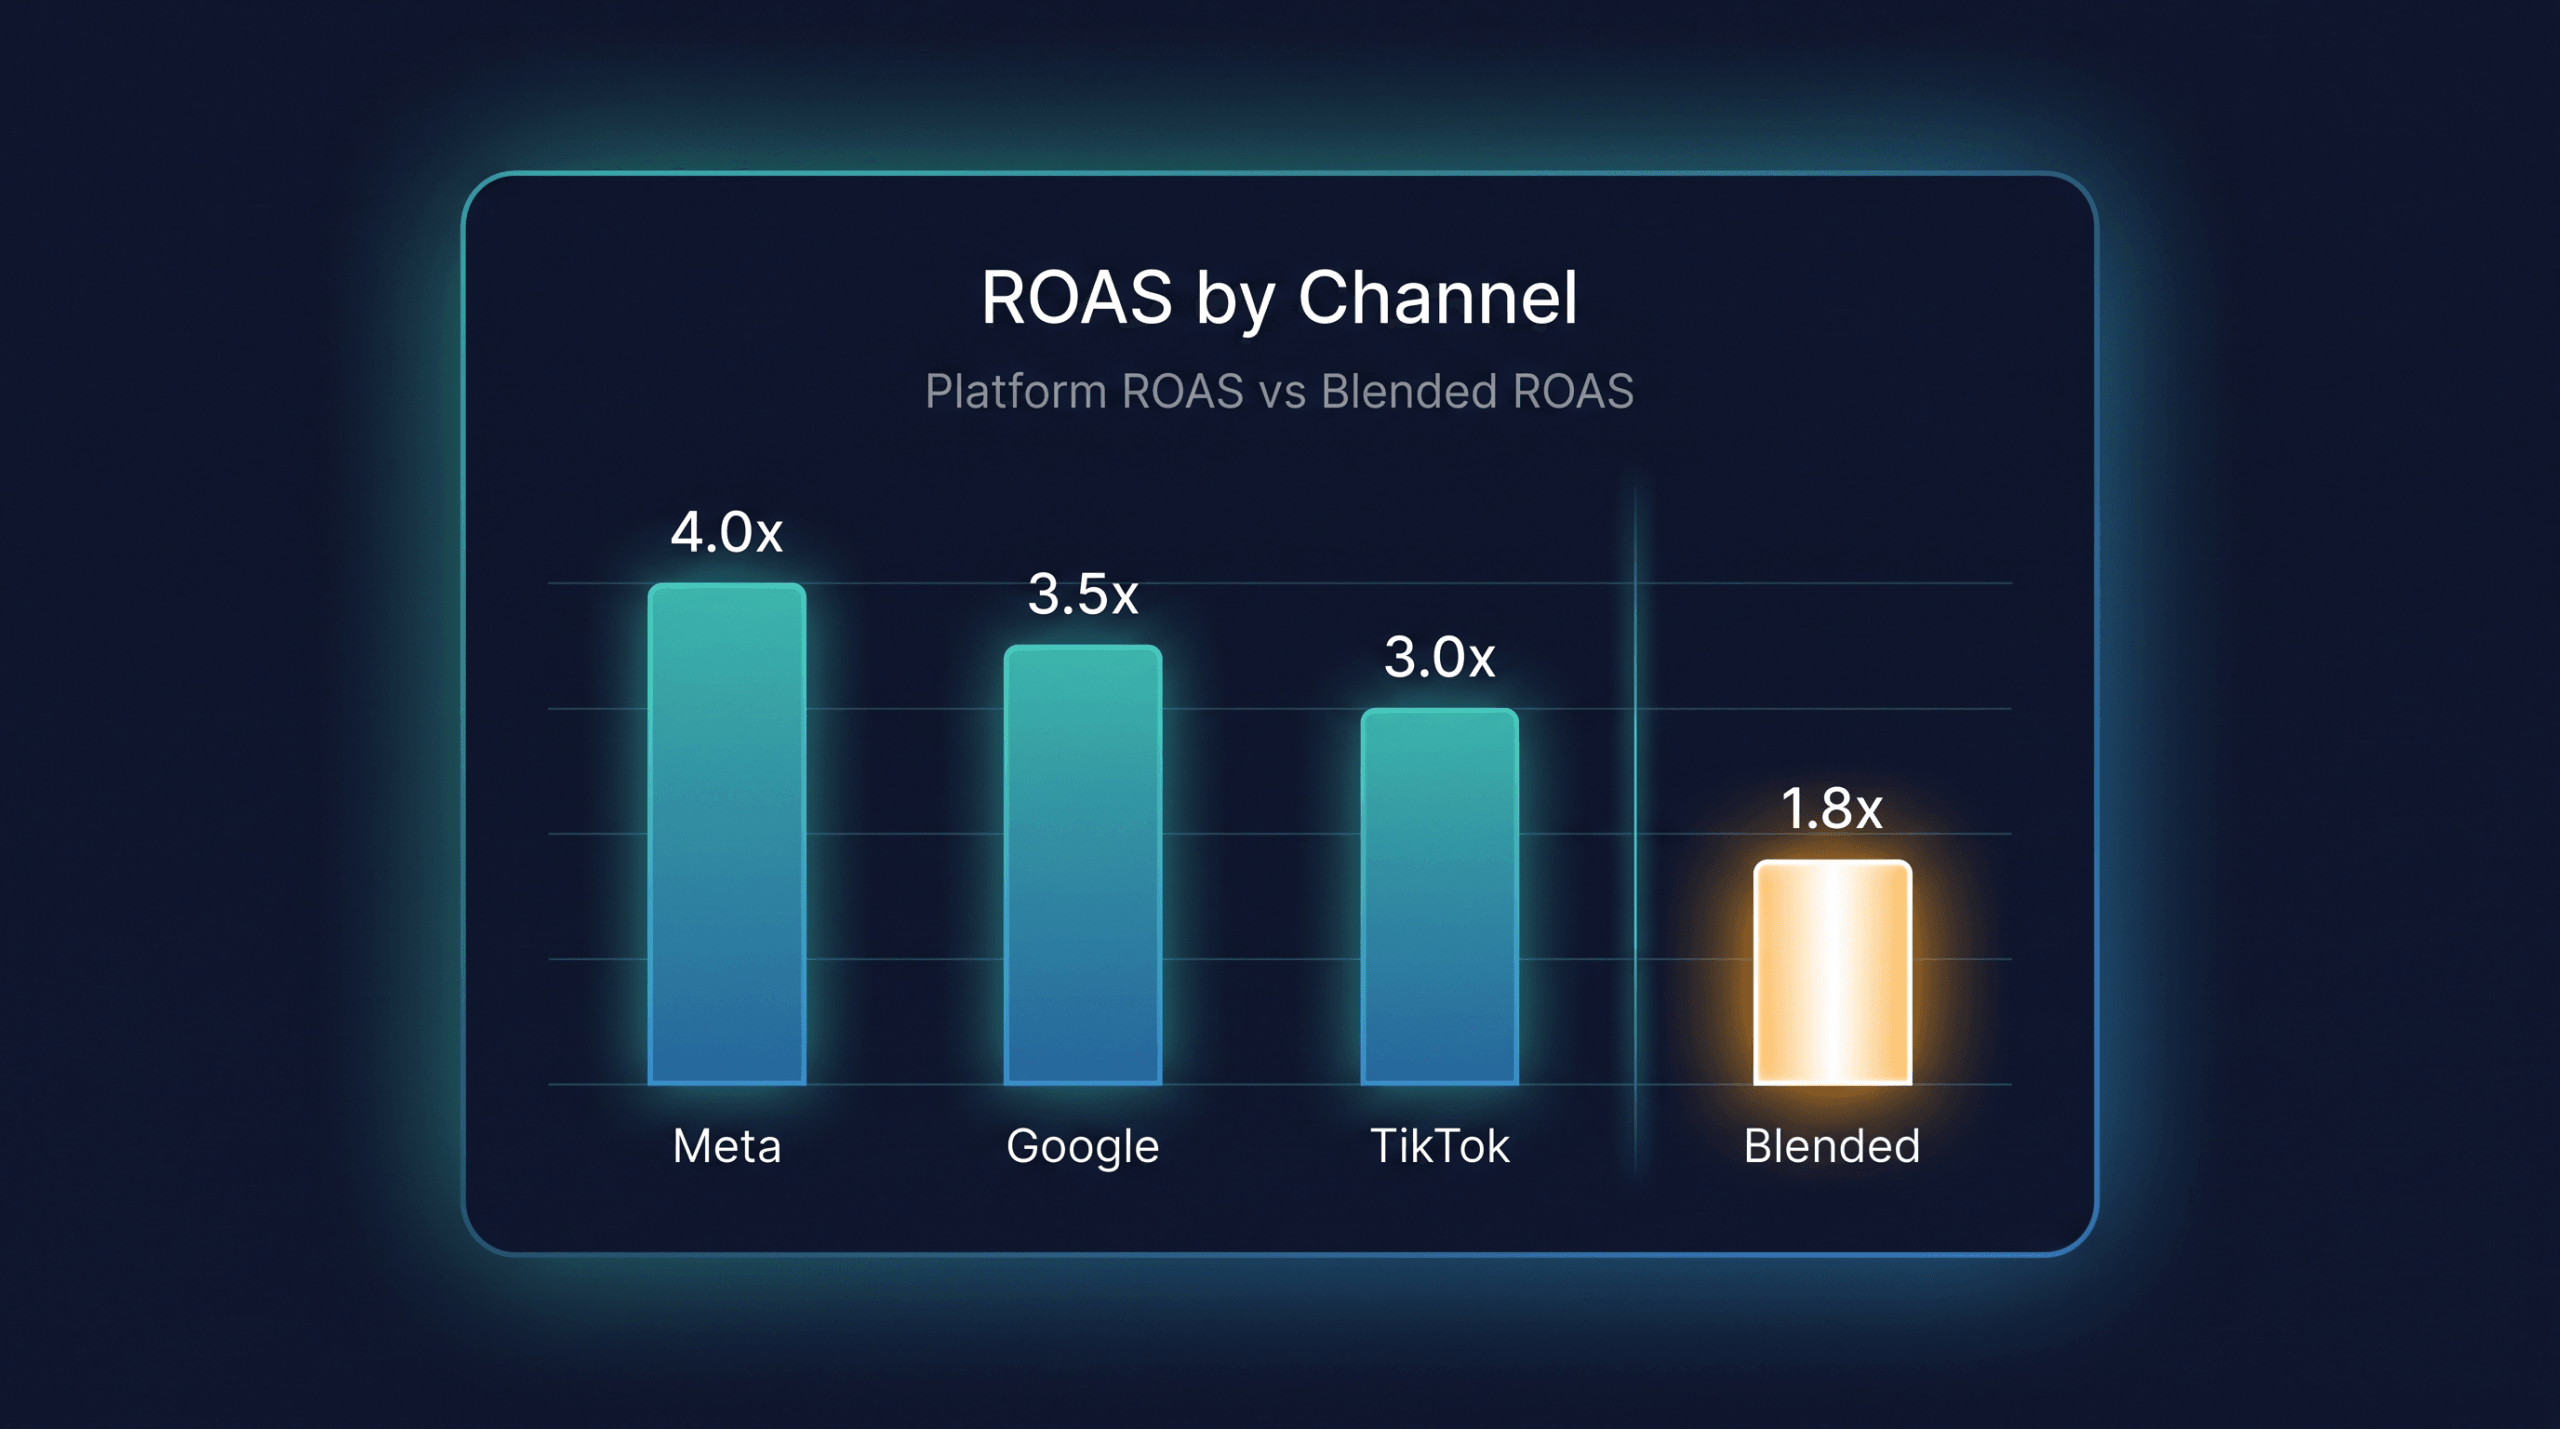
In practice, this creates a specific problem. Your Meta Ads Manager might show a 5x ROAS on a campaign. Your Google Ads dashboard might show a 3.5x ROAS on search. But when you add up all revenue and all spend, blended ROAS is 2.8x. The missing gap is double-counted conversions, view-through attribution inflation, and revenue that platforms claim but that was actually driven by organic, email, or direct traffic.
To understand the different ways platforms assign credit for conversions, read What Is Ad Attribution?.
Why Blended ROAS Became Critical After iOS 14.5
In April 2021, Apple released iOS 14.5 with App Tracking Transparency (ATT). This update required apps to ask users for permission before tracking their activity across other apps and websites. The opt-out rate landed far higher than most advertisers expected: industry data from Flurry Analytics showed that roughly 96% of US iPhone users initially opted out (opt-in rates have since climbed to ~37% as of 2026). That single number rewired the entire digital advertising measurement stack.
The immediate impact on ad platforms was severe:
Signal loss. Meta lost visibility into a large portion of conversion events on iOS devices. The pixel could no longer track users who opted out, which meant Meta couldn’t attribute purchases to specific ads with the same confidence it had before.
Modeled conversions. To fill the gap, Meta introduced “modeled conversions” (statistical estimates of conversions that likely happened but couldn’t be directly observed). These estimates inflate platform-reported ROAS because they include sales that may or may not have been driven by the ad. As one agency media buyer documented in a live YouTube walkthrough of their ad account, “Facebook reported cost per call at $129 when the actual cost was $518,” a gap of over 300% on a single metric that was supposed to be straightforward.
Delayed reporting. Conversion data that used to appear in near-real-time shifted to 24-72 hour delays, making same-day optimization less reliable.
Attribution window compression. Meta shortened its default attribution window from 28-day click / 1-day view to 7-day click / 1-day view. Some conversions that would have been counted under the old window simply vanished from reports.
The net result: platform ROAS numbers became directionally useful but financially unreliable.
Here’s where the real damage happens. I want you to sit with this number. If your ad account is overspending on the wrong campaigns because the platform is over-reporting ROAS, you’re going to lose 15 to 20% of your ad spend in pure waste. That’s not a rounding error. And here’s the other side of it: if you turn off campaigns because they look unprofitable in the platform dashboard when they’re actually generating real revenue your pixel can’t see (campaigns that are missing 20 to 30% of their conversions), you’re going to turn off probably 15 to 20% of your potential scale. Both directions hurt. Platforms/over-report ROAS by 30-50% for many DTC accounts in the accounts I’ve reviewed, which means the gap between what the dashboard says and what your bank account reflects isn’t a fluke. It’s baked into the structure of how these platforms measure.
A 2024 analysis published by Definite examined five ecommerce brands with combined ad spend of approximately $214,000. They compared platform-reported ROAS against actual Shopify order data. Meta reported 4x ROAS. Google reported 3.2x. The actual blended ROAS from Shopify records was 1.9x. In one extreme case (a brand called “Midnight” in the study), Meta claimed 3.5x and Google claimed 3.2x, but actual Shopify data showed 0.4x, meaning the brand was losing money while both platforms reported profitability.
The pattern holds across platforms. On the Hyros Shopify integration page, we publish per-platform underreporting gaps based on our tracking data: Facebook underreports conversions by approximately 30%, Google by 29%, and TikTok by 33%. Those aren’t small discrepancies. If your ad platform is missing a third of your conversions, the ROAS number it shows you is fiction, and the budget decisions you make based on that fiction compound the error every month.
This is the gap that blended ROAS exists to expose.
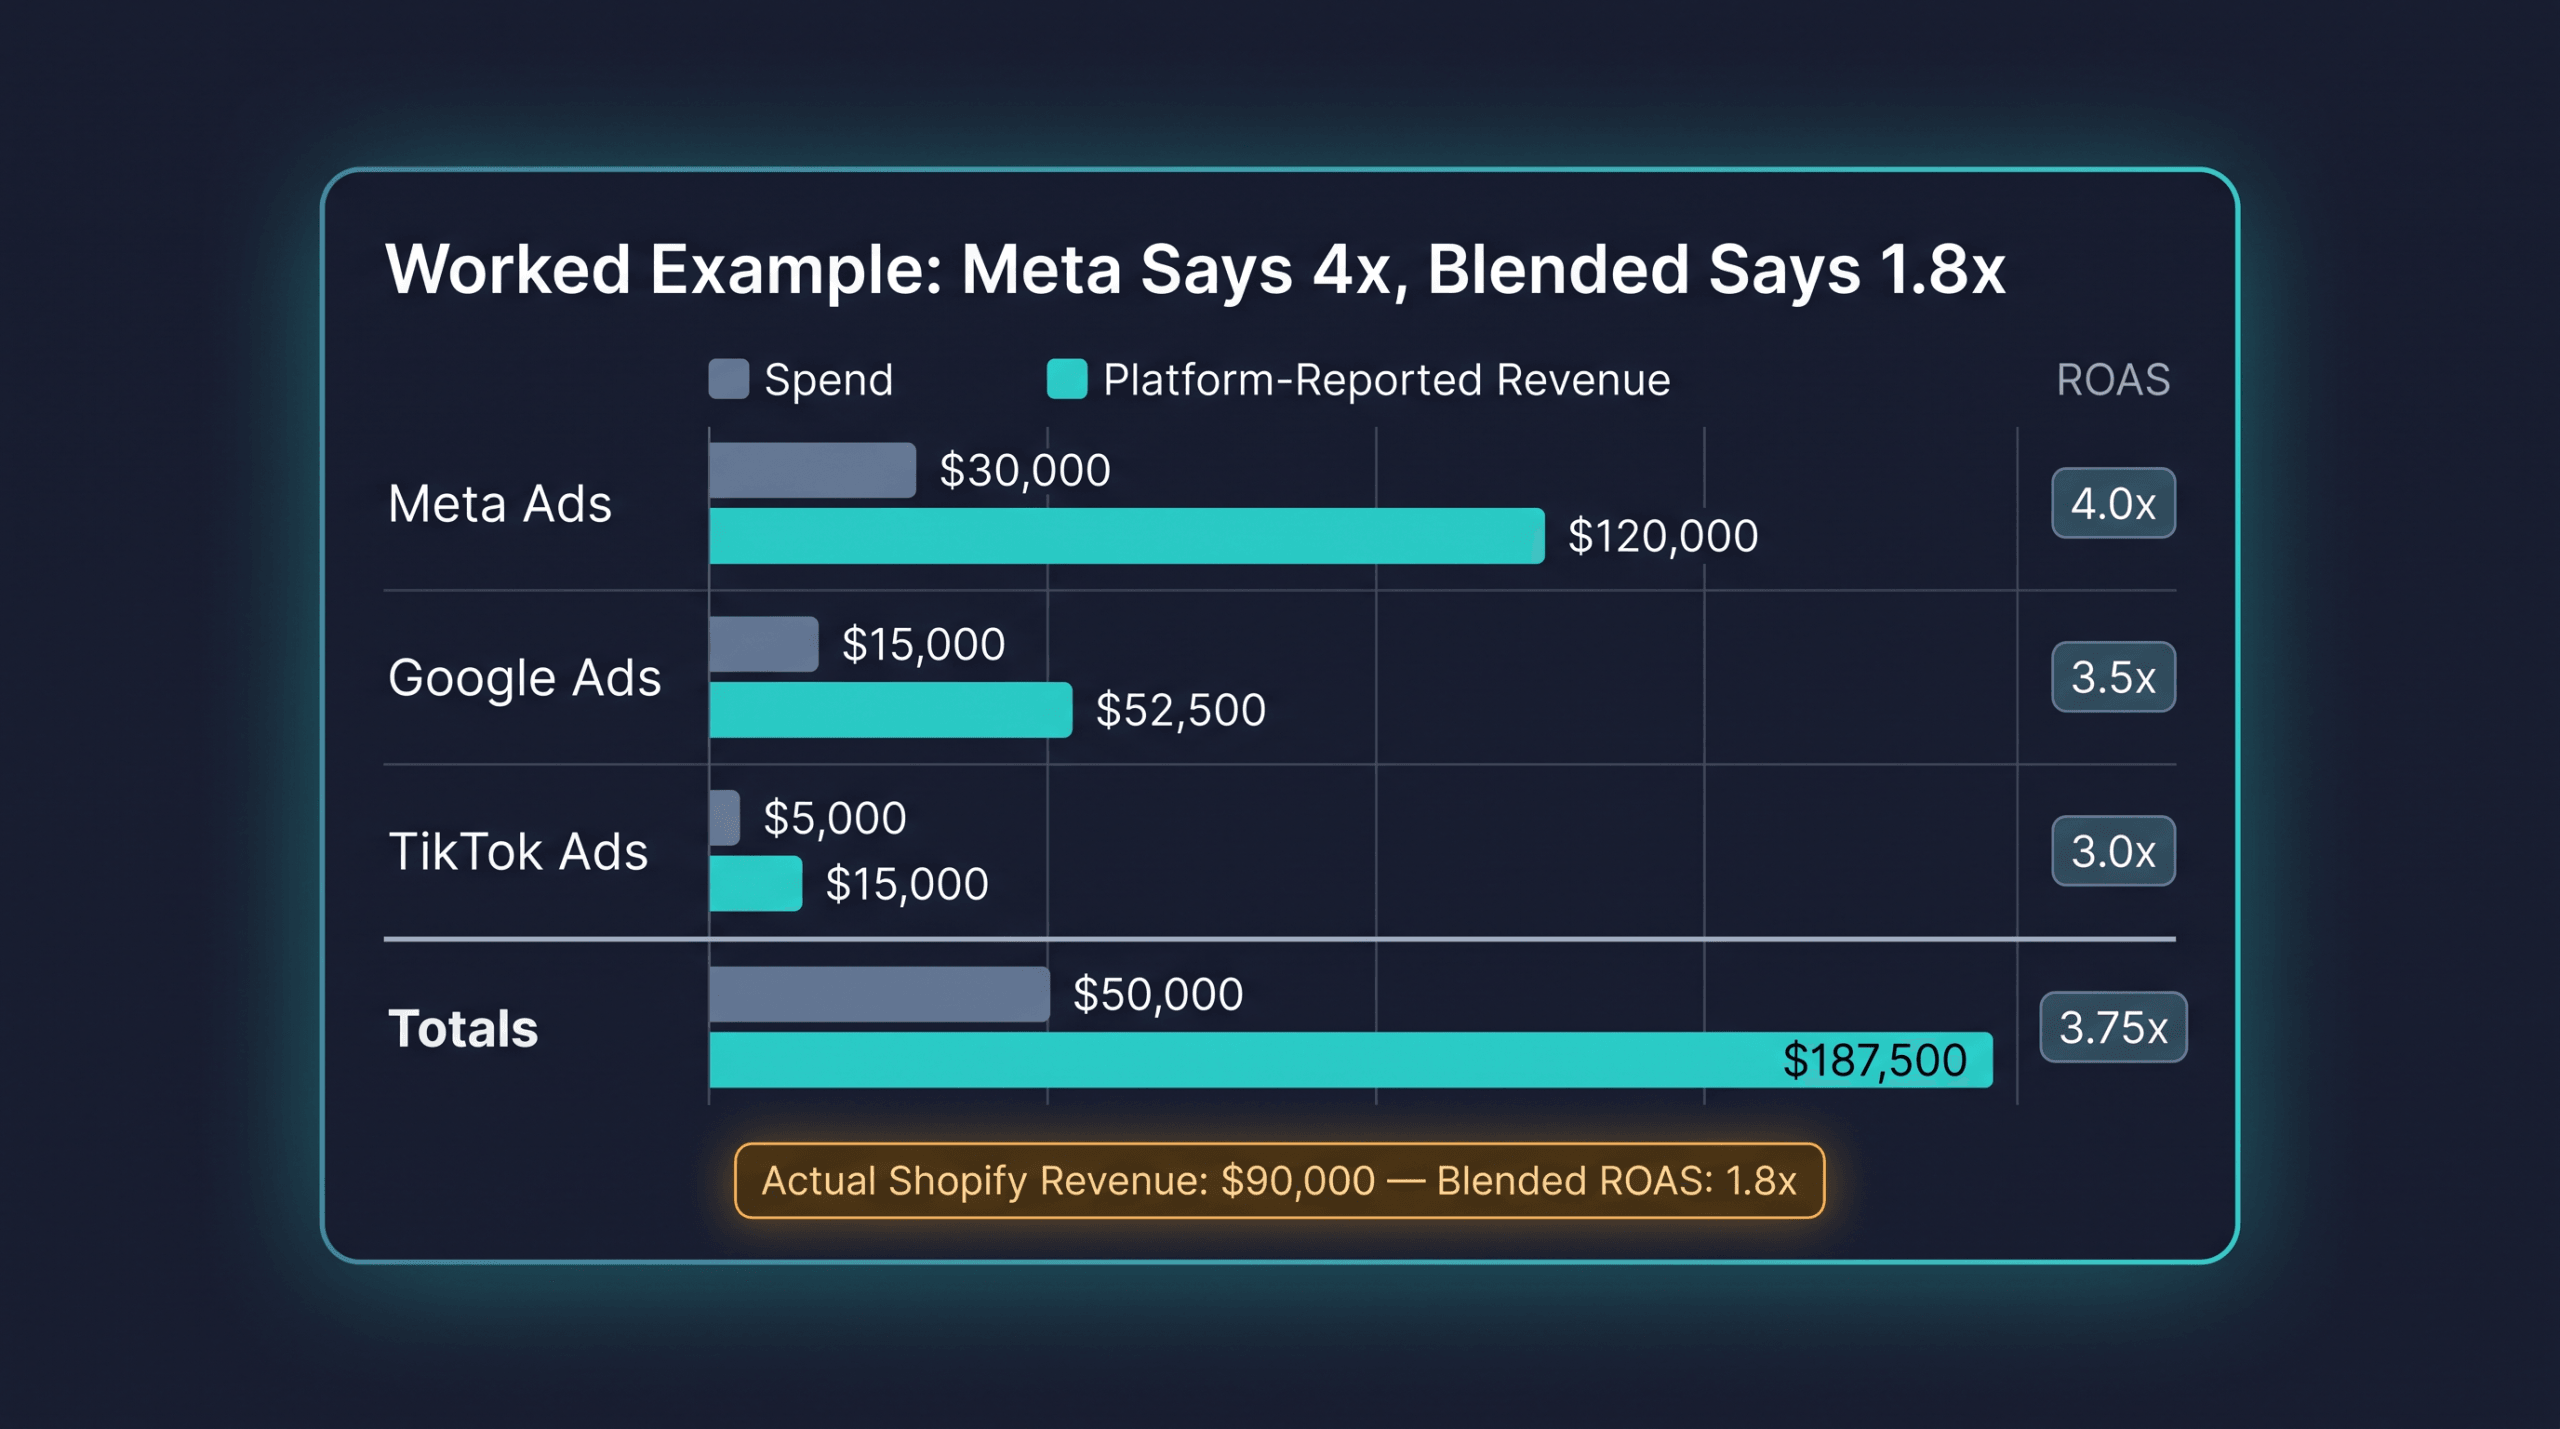
Worked Example: Meta Says 4x, Blended Says 1.8x
Consider a DTC skincare brand running ads on Meta, Google, and TikTok during a 30-day period.
Platform-Reported Numbers:
| Channel | Spend | Platform-Reported Revenue | Platform ROAS |
|---|---|---|---|
| Meta Ads | $30,000 | $120,000 | 4.0x |
| Google Ads | $15,000 | $52,500 | 3.5x |
| TikTok Ads | $5,000 | $15,000 | 3.0x |
| Totals | $50,000 | $187,500 | 3.75x |
If you summed the platform-reported revenue, you would believe you generated $187,500 from $50,000 in spend. That is a 3.75x weighted average.
Actual Store Numbers:
- Total Shopify revenue for the month: $90,000
- Total ad spend: $50,000
- Blended ROAS: $90,000 / $50,000 = 1.8x
The platform-reported revenue ($187,500) is more than double the actual store revenue ($90,000). Where did the extra $97,500 come from?
Double-counting. A customer clicked a Google search ad, then later clicked a Meta retargeting ad, then purchased. Both platforms claimed full credit for that $85 order. That single sale shows up as $170 of platform-reported revenue.
View-through inflation. Meta counts a conversion if someone saw an ad impression and purchased within 1 day, even if they never clicked. Some of these customers were going to purchase anyway through email or direct traffic.
Modeled conversions. Meta estimated that additional conversions occurred among opted-out iOS users. These estimates are baked into the reported numbers.
Organic cannibalization. Some revenue came from returning customers who would have purchased without seeing any ad. The platforms still take credit when these customers happen to see or click an ad before purchasing.
The blended ROAS of 1.8x is the real financial picture. If this brand needs a 2.5x blended ROAS to break even after COGS and overhead, they’re losing money despite every platform dashboard showing green numbers.
Teaching Scenario: The Portfolio Trap: 5x Platform, 2x Bank Account
Let’s imagine you’re running a portfolio of eight campaigns across Meta and Google. Your Meta dashboard shows a combined 5.5x ROAS on $80,000 in monthly spend, so that’s $440,000 in attributed revenue. Your Google dashboard reports 4.8x on $20,000 in spend, which is $96,000 in attributed revenue. Add them up: platforms are claiming $536,000 in revenue from $100,000 in total spend. Platform-summed ROAS looks like 5.36x.
Now go to Shopify. Total revenue for the month: $195,000.
Blended ROAS: $195,000 / $100,000 = 2.0x.
The platforms claimed $536,000. Your store generated $195,000. That’s $341,000 in phantom revenue, more than 60% of what the dashboards reported is attribution noise, double-counting, and modeled estimation. I’m not exaggerating. I’ve seen this exact pattern in the accounts I’ve reviewed at Hyros, brands running at what looks like a 5x portfolio average, fully confident they’re profitable, while their actual blended ROAS is sitting at 2x and their margins are getting destroyed.
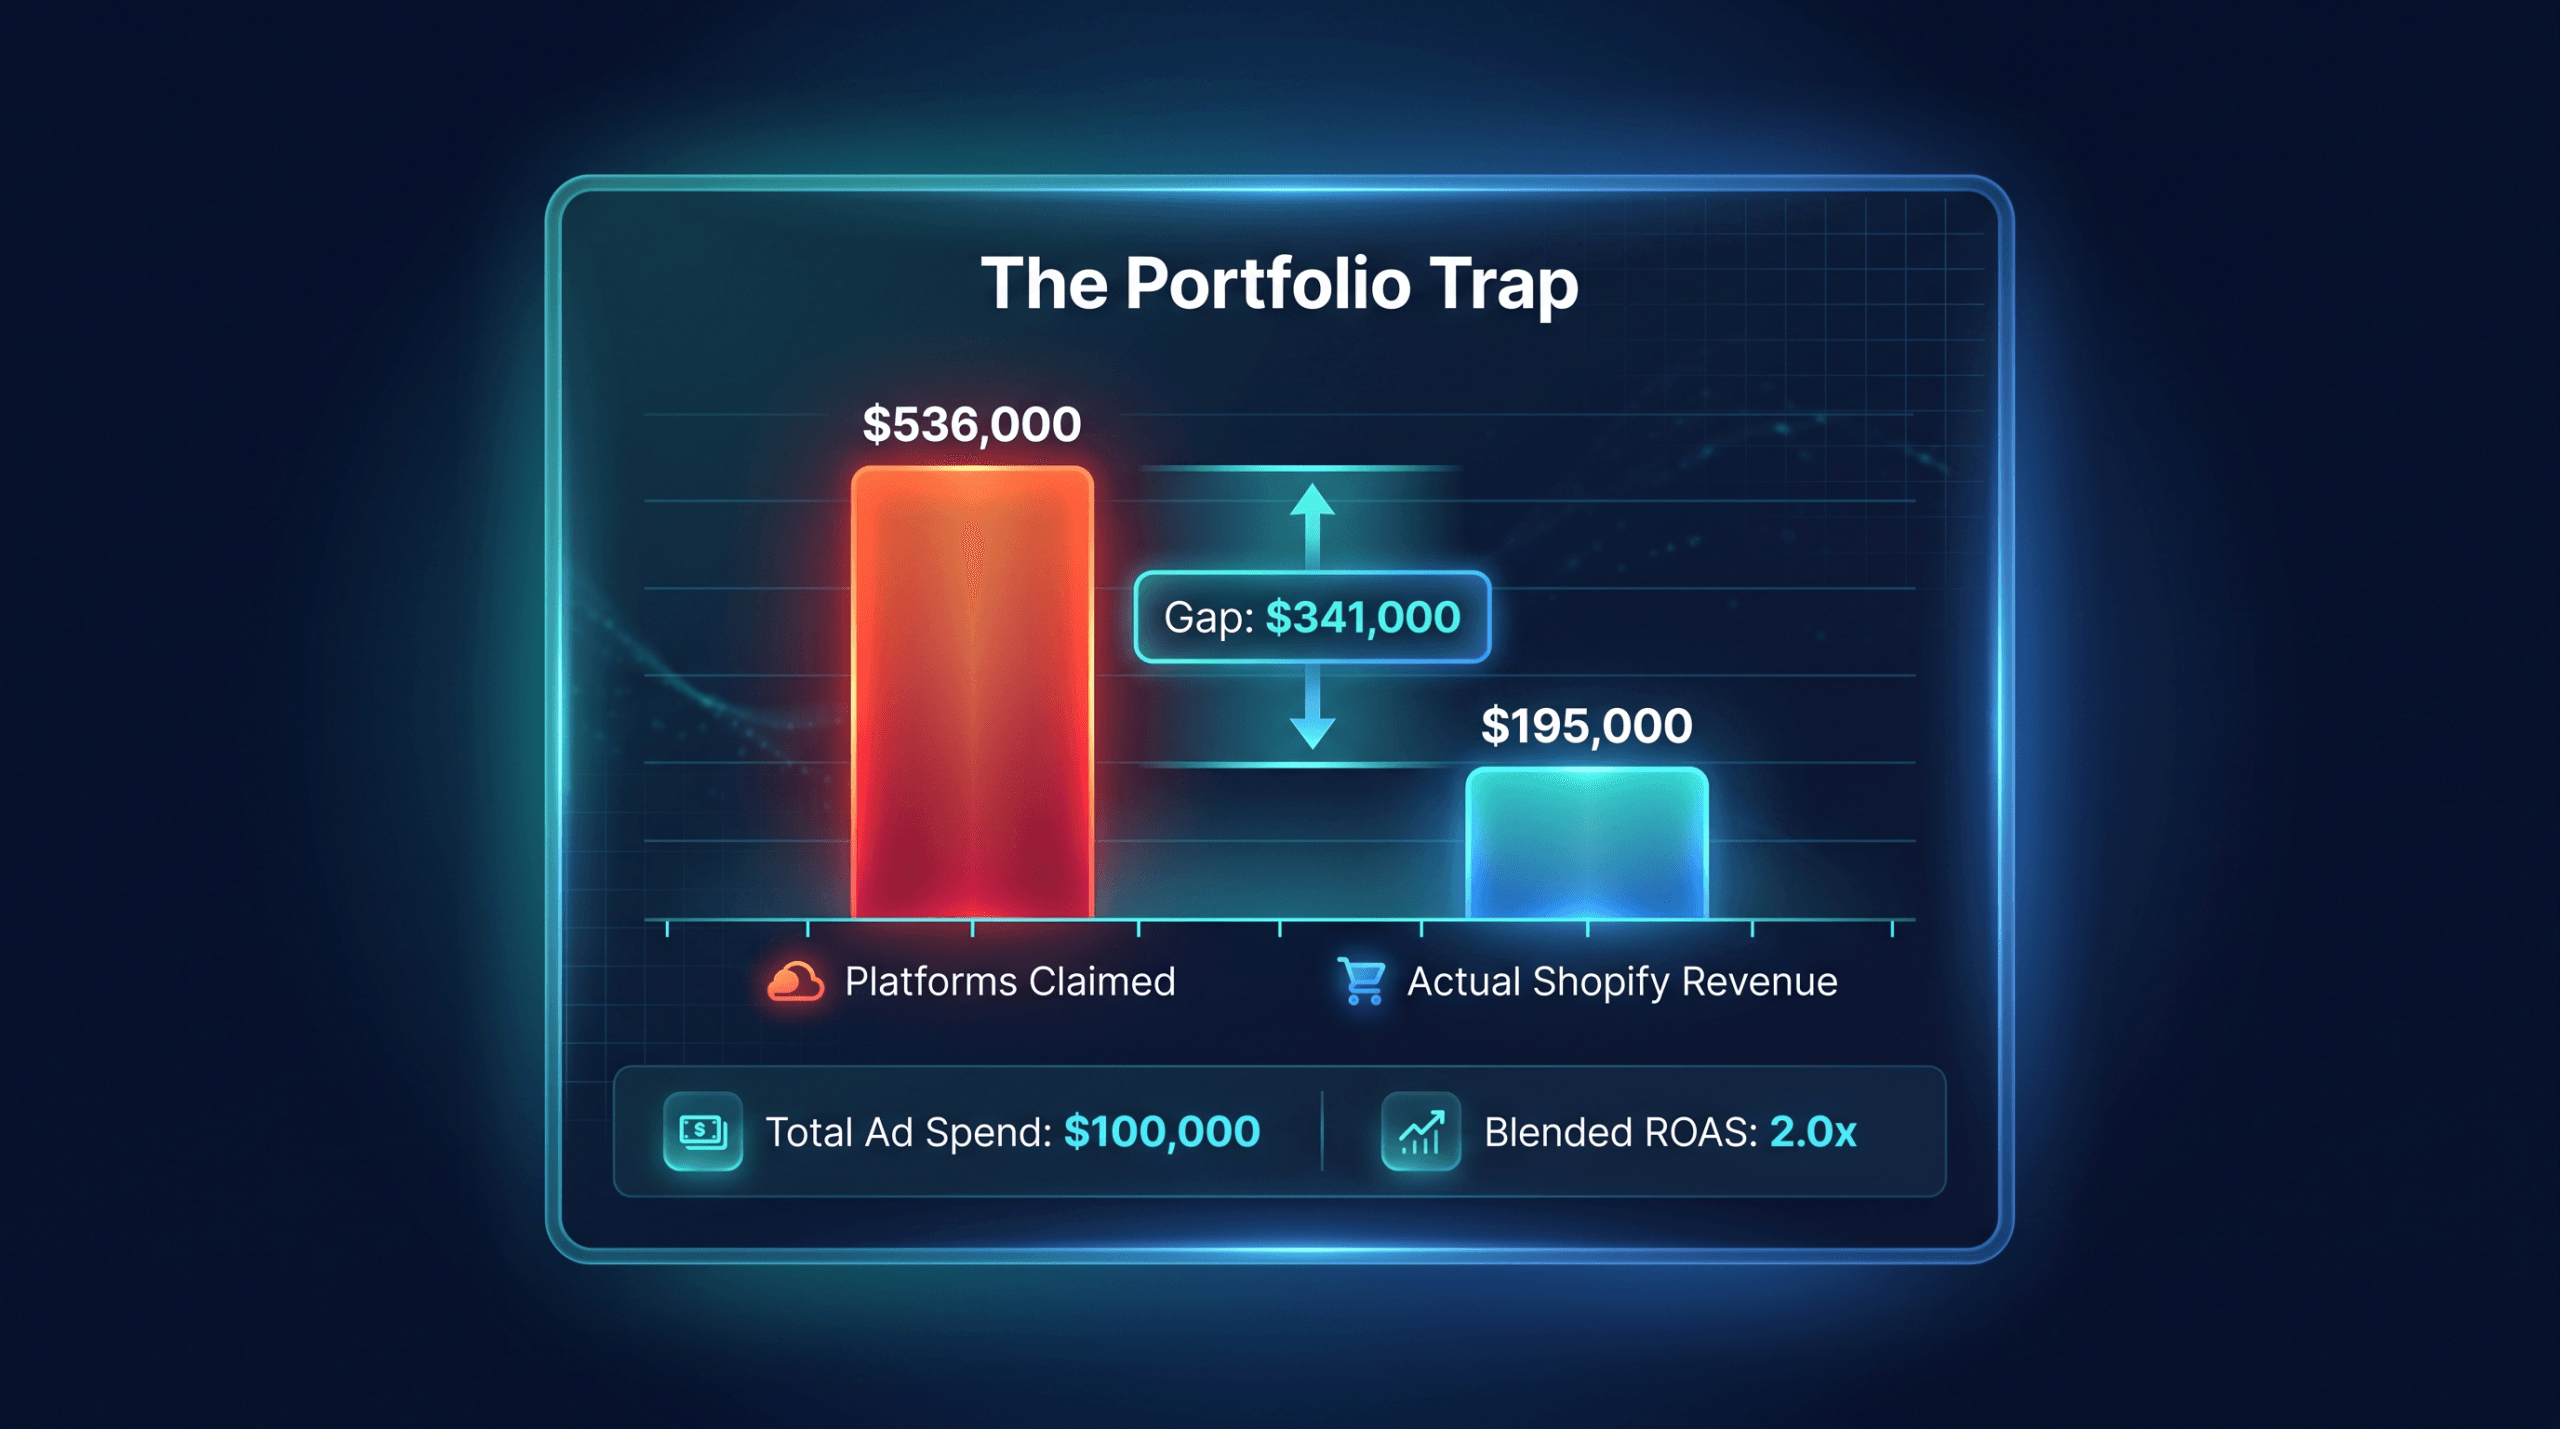
Here’s why it matters for decision-making: at $100,000/month in ad spend, the difference between a 5x platform ROAS and a 2x blended ROAS is the difference between feeling like you should scale aggressively and realizing you’re barely breaking even. A brand with 35% gross margins needs roughly a 2.9x blended ROAS to cover COGS plus overhead. At 2.0x, this hypothetical brand is actually losing money on advertising despite every dashboard showing green. That’s not a creative problem. That’s not a targeting problem. That’s a measurement problem, and it doesn’t go away until you stop trusting the platform number as your primary financial signal.
What Is the Difference Between Blended ROAS and MER?
These two terms get used interchangeably, but there’s a meaningful distinction.
Blended ROAS = Total Revenue / Total Ad Spend
MER (Marketing Efficiency Ratio) = Total Revenue / Total Marketing Spend
The difference is in the denominator.
Blended ROAS only counts direct ad spend: the dollars you put into Meta, Google, TikTok, and other paid platforms.
MER counts all marketing costs: ad spend plus agency fees, creative production costs, influencer payments, email marketing platform fees, SMS tool subscriptions, affiliate commissions, and any other cost associated with marketing the business.
A practical example:
- Total revenue: $200,000
- Total ad spend: $50,000
- Agency fee: $8,000
- Creative production: $4,000
- Influencer payments: $3,000
- Email/SMS platform: $1,500
- Total marketing spend: $66,500
Blended ROAS: $200,000 / $50,000 = 4.0x
MER: $200,000 / $66,500 = 3.0x
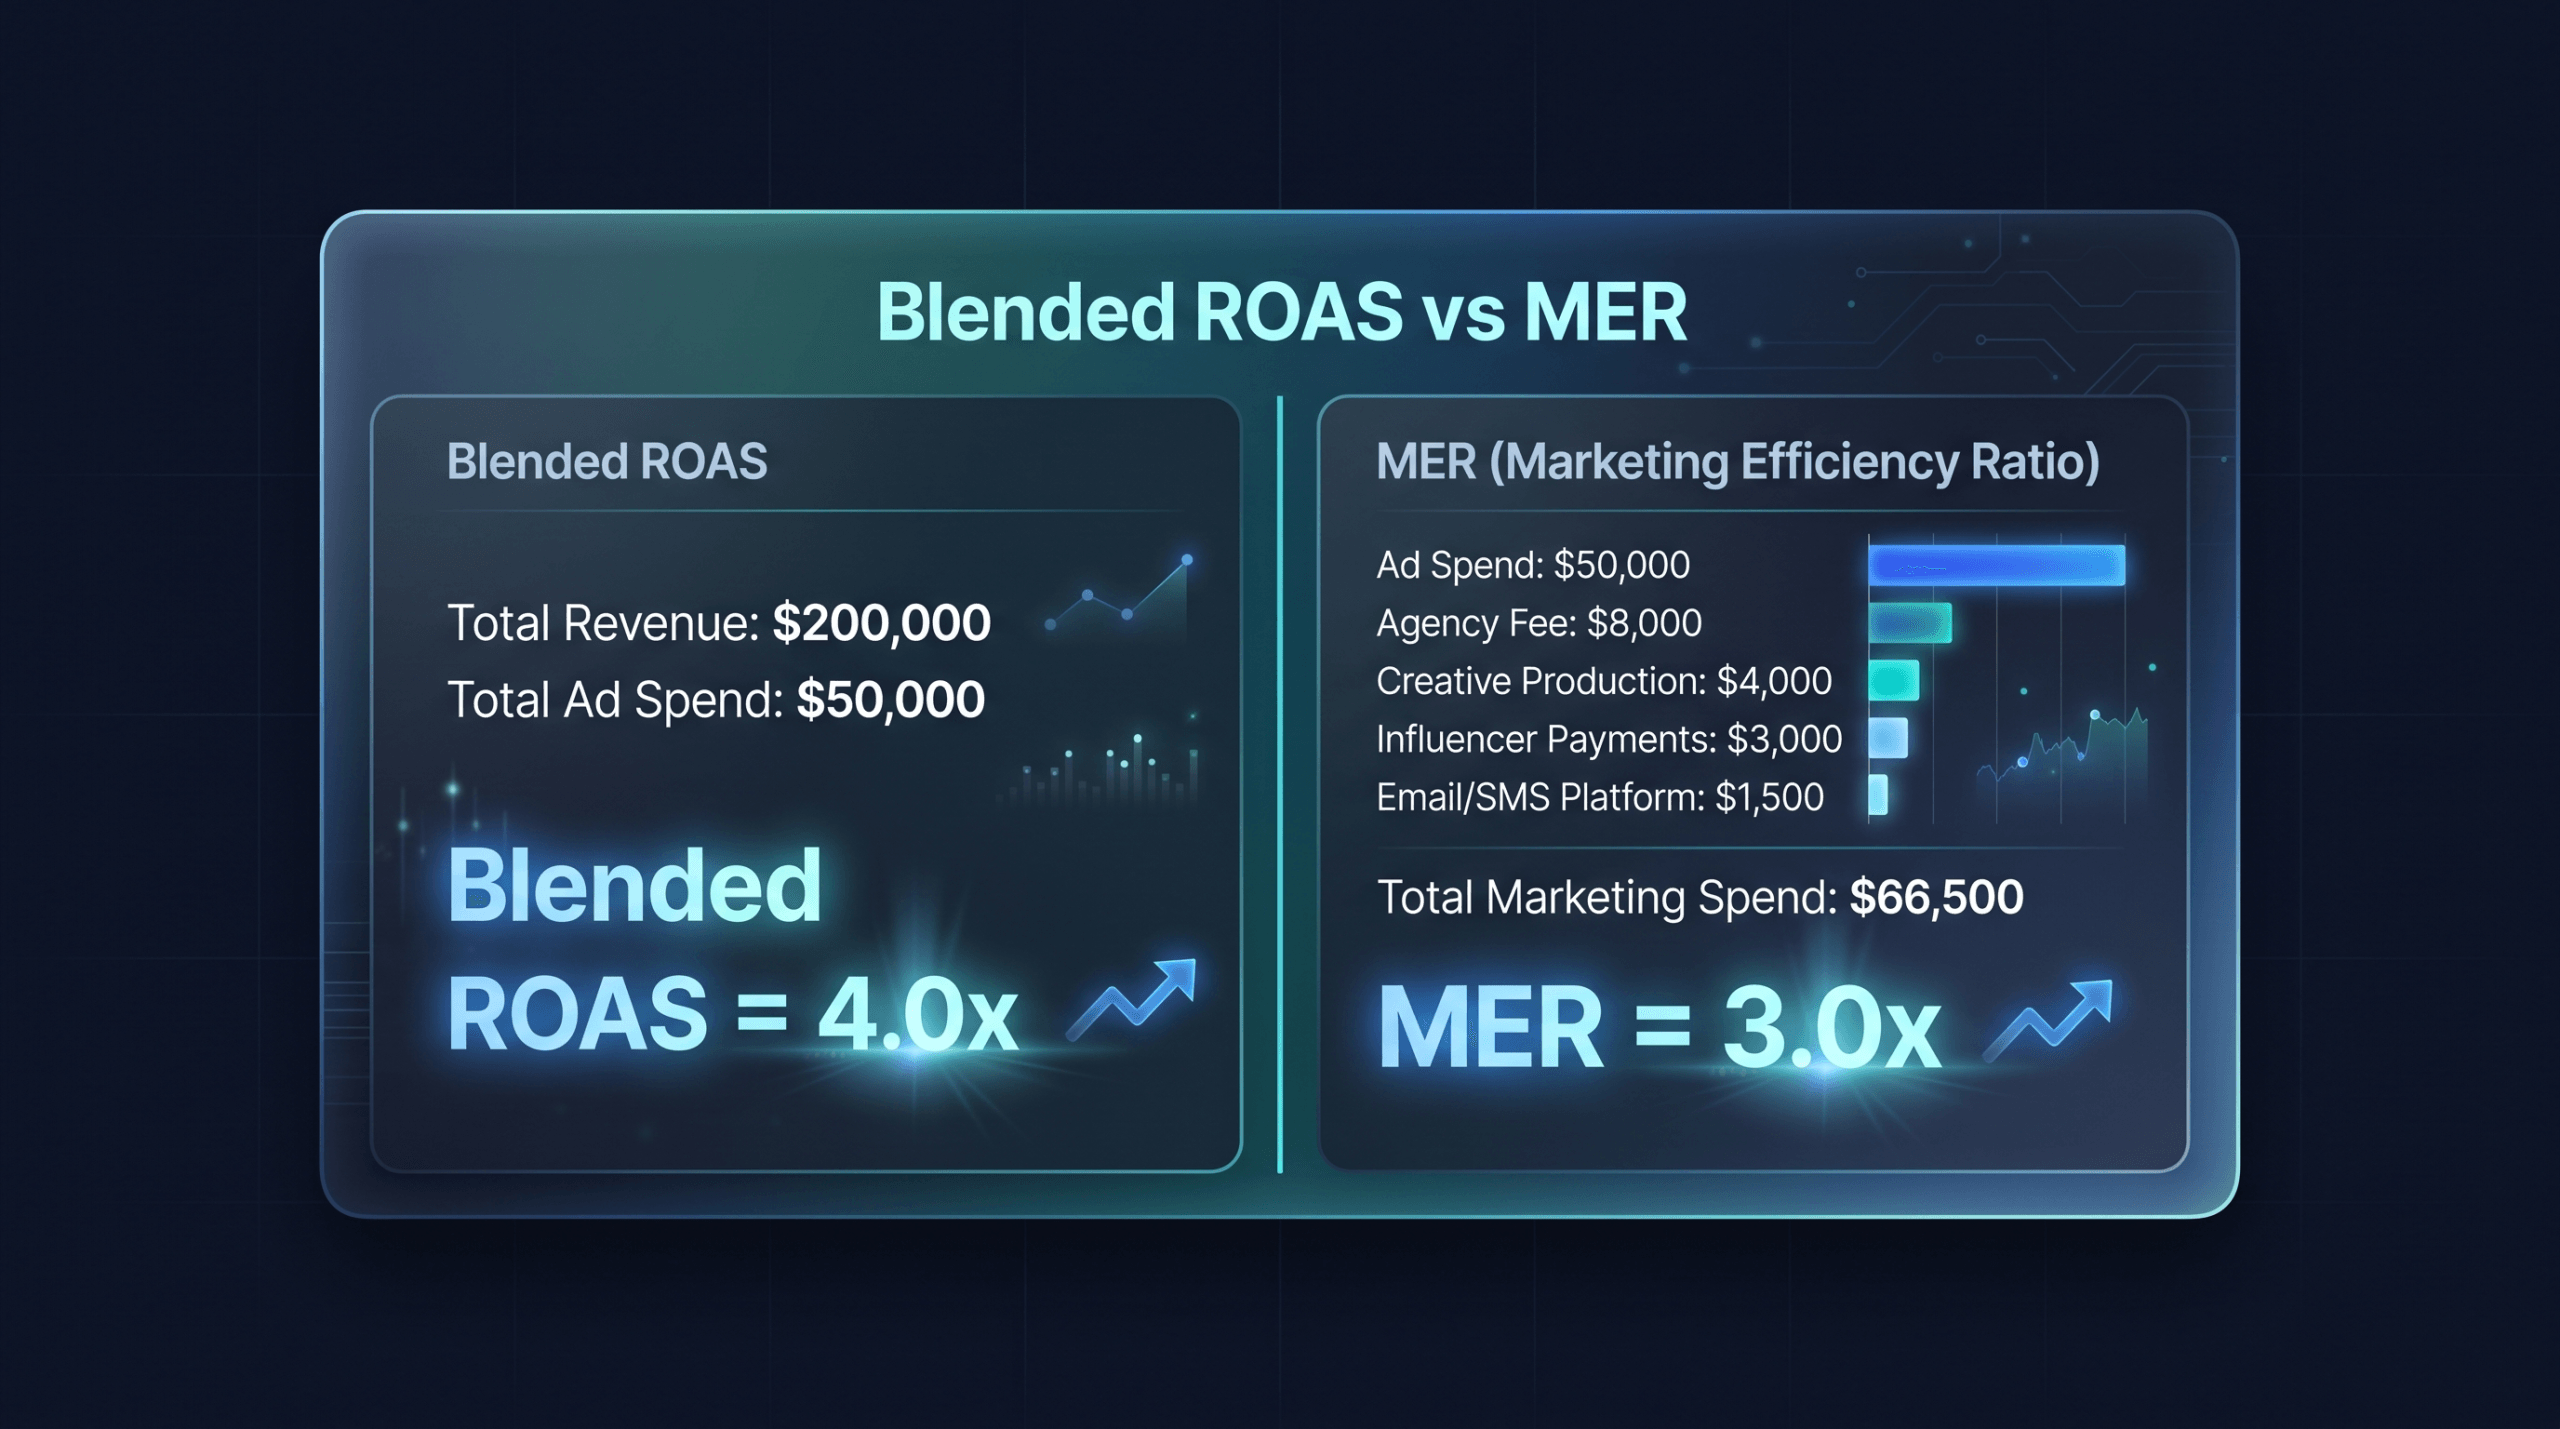
Same revenue, different denominators, different ratios. Both are valid. MER gives a more complete picture of marketing profitability because it includes costs that blended ROAS ignores.
Some operators use the terms interchangeably. Triple Whale, Northbeam, and other analytics platforms sometimes label the same metric differently. If you’re comparing numbers with a colleague or agency, confirm which costs are included in the denominator before drawing conclusions. For B2B businesses where long sales cycles make blended ROAS harder to calculate, see our B2B attribution guide for how to handle pipeline-based measurement.
For a deeper look at how ROAS compares to broader profitability metrics, see ROAS vs ROI.
What Should You Include in Ad Spend?
The accuracy of blended ROAS depends entirely on capturing all ad spend. Miss a channel and the number is artificially inflated.
Always include:
- Meta Ads (Facebook + Instagram)
- Google Ads (Search, Shopping, Display, YouTube, Performance Max)
- TikTok Ads
- Pinterest Ads
- Snapchat Ads
- LinkedIn Ads (if applicable)
- Microsoft/Bing Ads
- Programmatic display (The Trade Desk, etc.)
- Amazon Ads (if you sell on Amazon)
- Podcast ad placements (direct buys)
- Sponsorship payments for content placements
Sometimes included (depends on your definition):
- Influencer fees (some brands count these as ad spend, others as marketing cost)
- Affiliate commissions (technically performance-based ad spend)
- Direct mail (paid distribution, but not digital)
- Paid PR placements
Not included in blended ROAS (but included in MER):
- Agency management fees
- Creative production costs (design, video production)
- Software subscriptions (analytics tools, email platforms)
- In-house marketing team salaries
The rule of thumb: if you paid a platform or publisher to distribute your message to an audience, it’s ad spend. If you paid someone to create the message or manage the process, it’s a marketing cost but not ad spend.
Be consistent. Pick a definition, document it, and use it every month. The absolute number matters less than the trend over time, and trend analysis breaks if the denominator definition keeps changing.
What Are the Limits of Blended ROAS?
Blended ROAS is a useful financial guardrail, but it has real limitations.
No channel-level insight. Blended ROAS can’t tell you which channel is working and which is wasting money. If your blended ROAS drops from 3.5x to 2.8x, you know something got worse, but you don’t know whether Meta is the problem, Google is the problem, or TikTok is burning cash while the other two are fine. This is especially painful when you remember the Databox finding that platforms collectively over-count conversions by 150-250%. Blended ROAS corrects the total, but it can’t tell you which platform is responsible for the largest share of the inflation.
Organic revenue distorts the number. Blended ROAS uses total revenue in the numerator, which includes sales from organic search, email, SMS, direct traffic, and word-of-mouth. If 40% of your revenue is organic, your blended ROAS will look healthy even if your ads are unprofitable. A brand with strong organic revenue can have a 5x blended ROAS while their actual ad-driven revenue generates a 1.5x return.
Seasonality creates false signals. During Black Friday or a major sale event, revenue spikes from email and organic while ad spend may also increase. Blended ROAS might jump to 8x, but that doesn’t mean your ads suddenly became three times more effective. The organic revenue surge inflated the numerator.
New customer acquisition is invisible. Blended ROAS treats a $100 order from a first-time customer the same as a $100 order from a loyal repeat buyer who would have purchased without seeing an ad. Brands that are heavily investing in top-of-funnel acquisition may see a lower blended ROAS even though they’re building long-term value.
It is a lagging indicator. Blended ROAS tells you what already happened. By the time you see it decline, the money is already spent. It isn’t a planning tool. It’s a rearview mirror. If you’re spending $5,000 a day and your blended ROAS doesn’t update until the end of the month, you could burn through $150,000 before the number tells you something went wrong.
These limitations don’t make blended ROAS useless. They make it incomplete. You need blended ROAS AND channel-level attribution to make good decisions. One without the other leads to either blind confidence or paralysis.
How Does Hyros Bridge Blended and Channel-Level Attribution?
The problem most brands face is binary: either trust platform-reported ROAS (which inflates performance) or rely on blended ROAS (which hides channel performance). I built Hyros to eliminate that tradeoff, originally for my own ad accounts, because I couldn’t scale them reliably when attribution was broken, and no existing tool fixed the problem.
Hyros tracks the full customer journey using first-party data, call tracking, and AI-based attribution that follows individual buyers across devices and sessions. This means you get both numbers: the blended ROAS that is your financial reality check and the per-channel, per-campaign, per-ad ROAS that tells you where to put your next dollar.
Here is what that looks like in practice:
Reconciled view. Hyros shows your blended ROAS alongside attributed ROAS for each channel. When the numbers diverge, you can see exactly where the gap comes from: which campaigns are over-reported by platforms and which are under-reported. In the accounts I’ve reviewed, a DTC supplement brand went through this exact reconciliation and recovered 18% of sales that were invisible to platform tracking, pushing their blended ROAS up 23% with zero additional ad spend. The revenue was always there. The platforms just were not counting it.
Long-window attribution. Many high-ticket and info-product sales happen 30, 60, or 90 days after the first ad click. Meta stops tracking at 7 days. Hyros follows the customer for the full buying cycle, which means revenue that platform ROAS misses entirely shows up in the Hyros attribution model. The Tony Robbins ad team is the clearest example of what happens when you bridge blended ROAS with accurate channel-level data. According to Hyros case study data, the Robbins team used Hyros attribution on their Business Mastery campaigns to identify which ads were actually converting at profitable margins and scaled ad spend by 43% over six months. On their Unleash The Power Within campaigns, they scaled spend by over 100% in the same timeframe. Those aren’t small budget bumps. They are decisions that require trusting your attribution data enough to put real money behind it, which you can’t do when the only number you have is a blended topline.
Ad-level data. Blended ROAS tells you “ads are working” or “ads aren’t working.” Hyros tells you which specific ad, in which campaign, on which platform, is generating profitable customers and which is generating clicks that never convert. That level of detail is what allows you to cut waste without cutting winners. I’ve run this analysis on my own ad accounts and the results are uncomfortable: 25% of the campaigns I turned off were actually yielding 200-500% ROI, campaigns that looked dead in Meta Ads Manager but were generating real revenue the platform couldn’t see.
Call and offline tracking. For businesses that close sales over the phone or through sales teams, platform ROAS is nearly useless because the conversion happens off-platform. Hyros connects the original ad click to the downstream phone sale, capturing revenue that blended ROAS includes but can’t attribute.
The result: you keep blended ROAS as your top-line financial compass while gaining the channel-level clarity that blended ROAS alone can’t provide. You know you’re making money (blended) and you know where the money is coming from (Hyros AI Attribution).
See blended and channel-level ROAS reconciled in real time. Book a demo.
FAQ
What is a good blended ROAS?
It depends on your margins. Most ecommerce brands target a blended ROAS between 3x and 5x. A brand with 70% gross margins (common in info products, software, and digital courses) can be profitable at 2x. A brand with 30% gross margins on physical products may need 4x or higher to break even after fulfillment, shipping, and overhead. Calculate your break-even point first: divide 1 by your net margin percentage to find the minimum blended ROAS you need. If your net margin is 25%, your break-even blended ROAS is 1 / 0.25 = 4.0x.
Is blended ROAS the same as MER?
They are close but not identical. Blended ROAS divides total revenue by total ad spend (paid media only). MER divides total revenue by total marketing spend, which includes ad spend plus agency fees, creative production, influencer payments, and software subscriptions. In practice, many operators use the terms interchangeably because the distinction only matters if your non-ad marketing costs are a significant percentage of total marketing spend. If you spend $50,000 on ads and $5,000 on everything else, the difference between blended ROAS and MER is negligible. If you spend $50,000 on ads and $30,000 on agencies, creative, and tools, the gap is meaningful.
How do I calculate blended ROAS in Shopify?
Go to Analytics in your Shopify admin and pull total sales for your desired date range. Then log into each ad platform (Meta, Google, TikTok, etc.) and record your total spend for the same date range. Add up all the spend numbers. Divide your Shopify total sales by the combined ad spend. That is your blended ROAS. For a more automated approach, tools like Hyros, Triple Whale, or Northbeam can pull spend data from connected ad accounts and display blended ROAS in a single dashboard without manual spreadsheet work.
Why is my blended ROAS lower than Meta ROAS?
Three reasons. First, Meta uses its own attribution model that credits Meta ads for conversions that other channels also influenced. Second, Meta includes modeled conversions (statistical estimates of sales it can’t directly observe due to iOS 14.5 opt-outs), which inflate the reported number. Third, your blended ROAS denominator includes spend from all channels, not just Meta. If you’re also spending on Google and TikTok, those costs pull the blended number down even though Meta’s self-reported ROAS only reflects Meta’s spend in its denominator. The gap between platform-reported and blended ROAS typically ranges from 20% to over 100%, depending on how aggressively the platform models unobserved conversions.
Is blended ROAS better than platform ROAS?
Neither is better in absolute terms. They answer different questions. Blended ROAS answers: “Is my total advertising investment profitable?” Platform ROAS answers: “How is this specific channel performing according to the platform’s attribution model?” Use blended ROAS as your financial guardrail and source of truth for overall profitability. Use platform ROAS as a directional signal for campaign-level decisions like pausing underperforming ad sets or scaling winning creatives. The best operators track both and investigate any large gap between the two numbers, because that gap usually reveals attribution blind spots or wasted spend.
Standalone Summary
Blended ROAS is total store revenue divided by total ad spend across every paid channel. The formula is simple: Total Revenue / Total Ad Spend. Unlike platform-reported ROAS from Meta or Google, blended ROAS uses actual sales data and avoids double-counting conversions. After iOS 14.5 limited cross-app tracking, platform ROAS diverged sharply from real business results, with studies showing platforms reporting 2x or more the actual return. Blended ROAS became the standard financial sanity check for DTC and ecommerce brands. Its main limitation is that it provides no channel-level insight: it tells you whether ads are profitable in total, but not which channel drives the value. MER (Marketing Efficiency Ratio) is a related metric that uses total marketing spend, not just ad spend, in the denominator. The strongest measurement approach combines blended ROAS as a top-line compass with per-channel attribution tools like Hyros to identify where revenue actually originates.
Related in This Series
Silo: Ad Attribution Fundamentals
More from the Ad Attribution Fundamentals series:
- How to Calculate ROAS: Formula, Examples, and Benchmarks
- ROAS vs ROI: What’s the Difference?
- What Is Ad Attribution? A Complete 2026 Guide
- What Is Hyros? How the Ad Tracking Platform Actually Works
Also explore: