

Linear vs Time-Decay Attribution Models Compared
Most people picking an attribution model ask the wrong question. They ask “which model is more accurate?” when the real question is “which model produces the budget decisions I can actually act on?” I’ve watched advertisers spend months trying to find the perfect model when the data going into it was broken from the start. That said, the choice between linear and time-decay attribution matters, and I’ll show you exactly when each one makes sense.
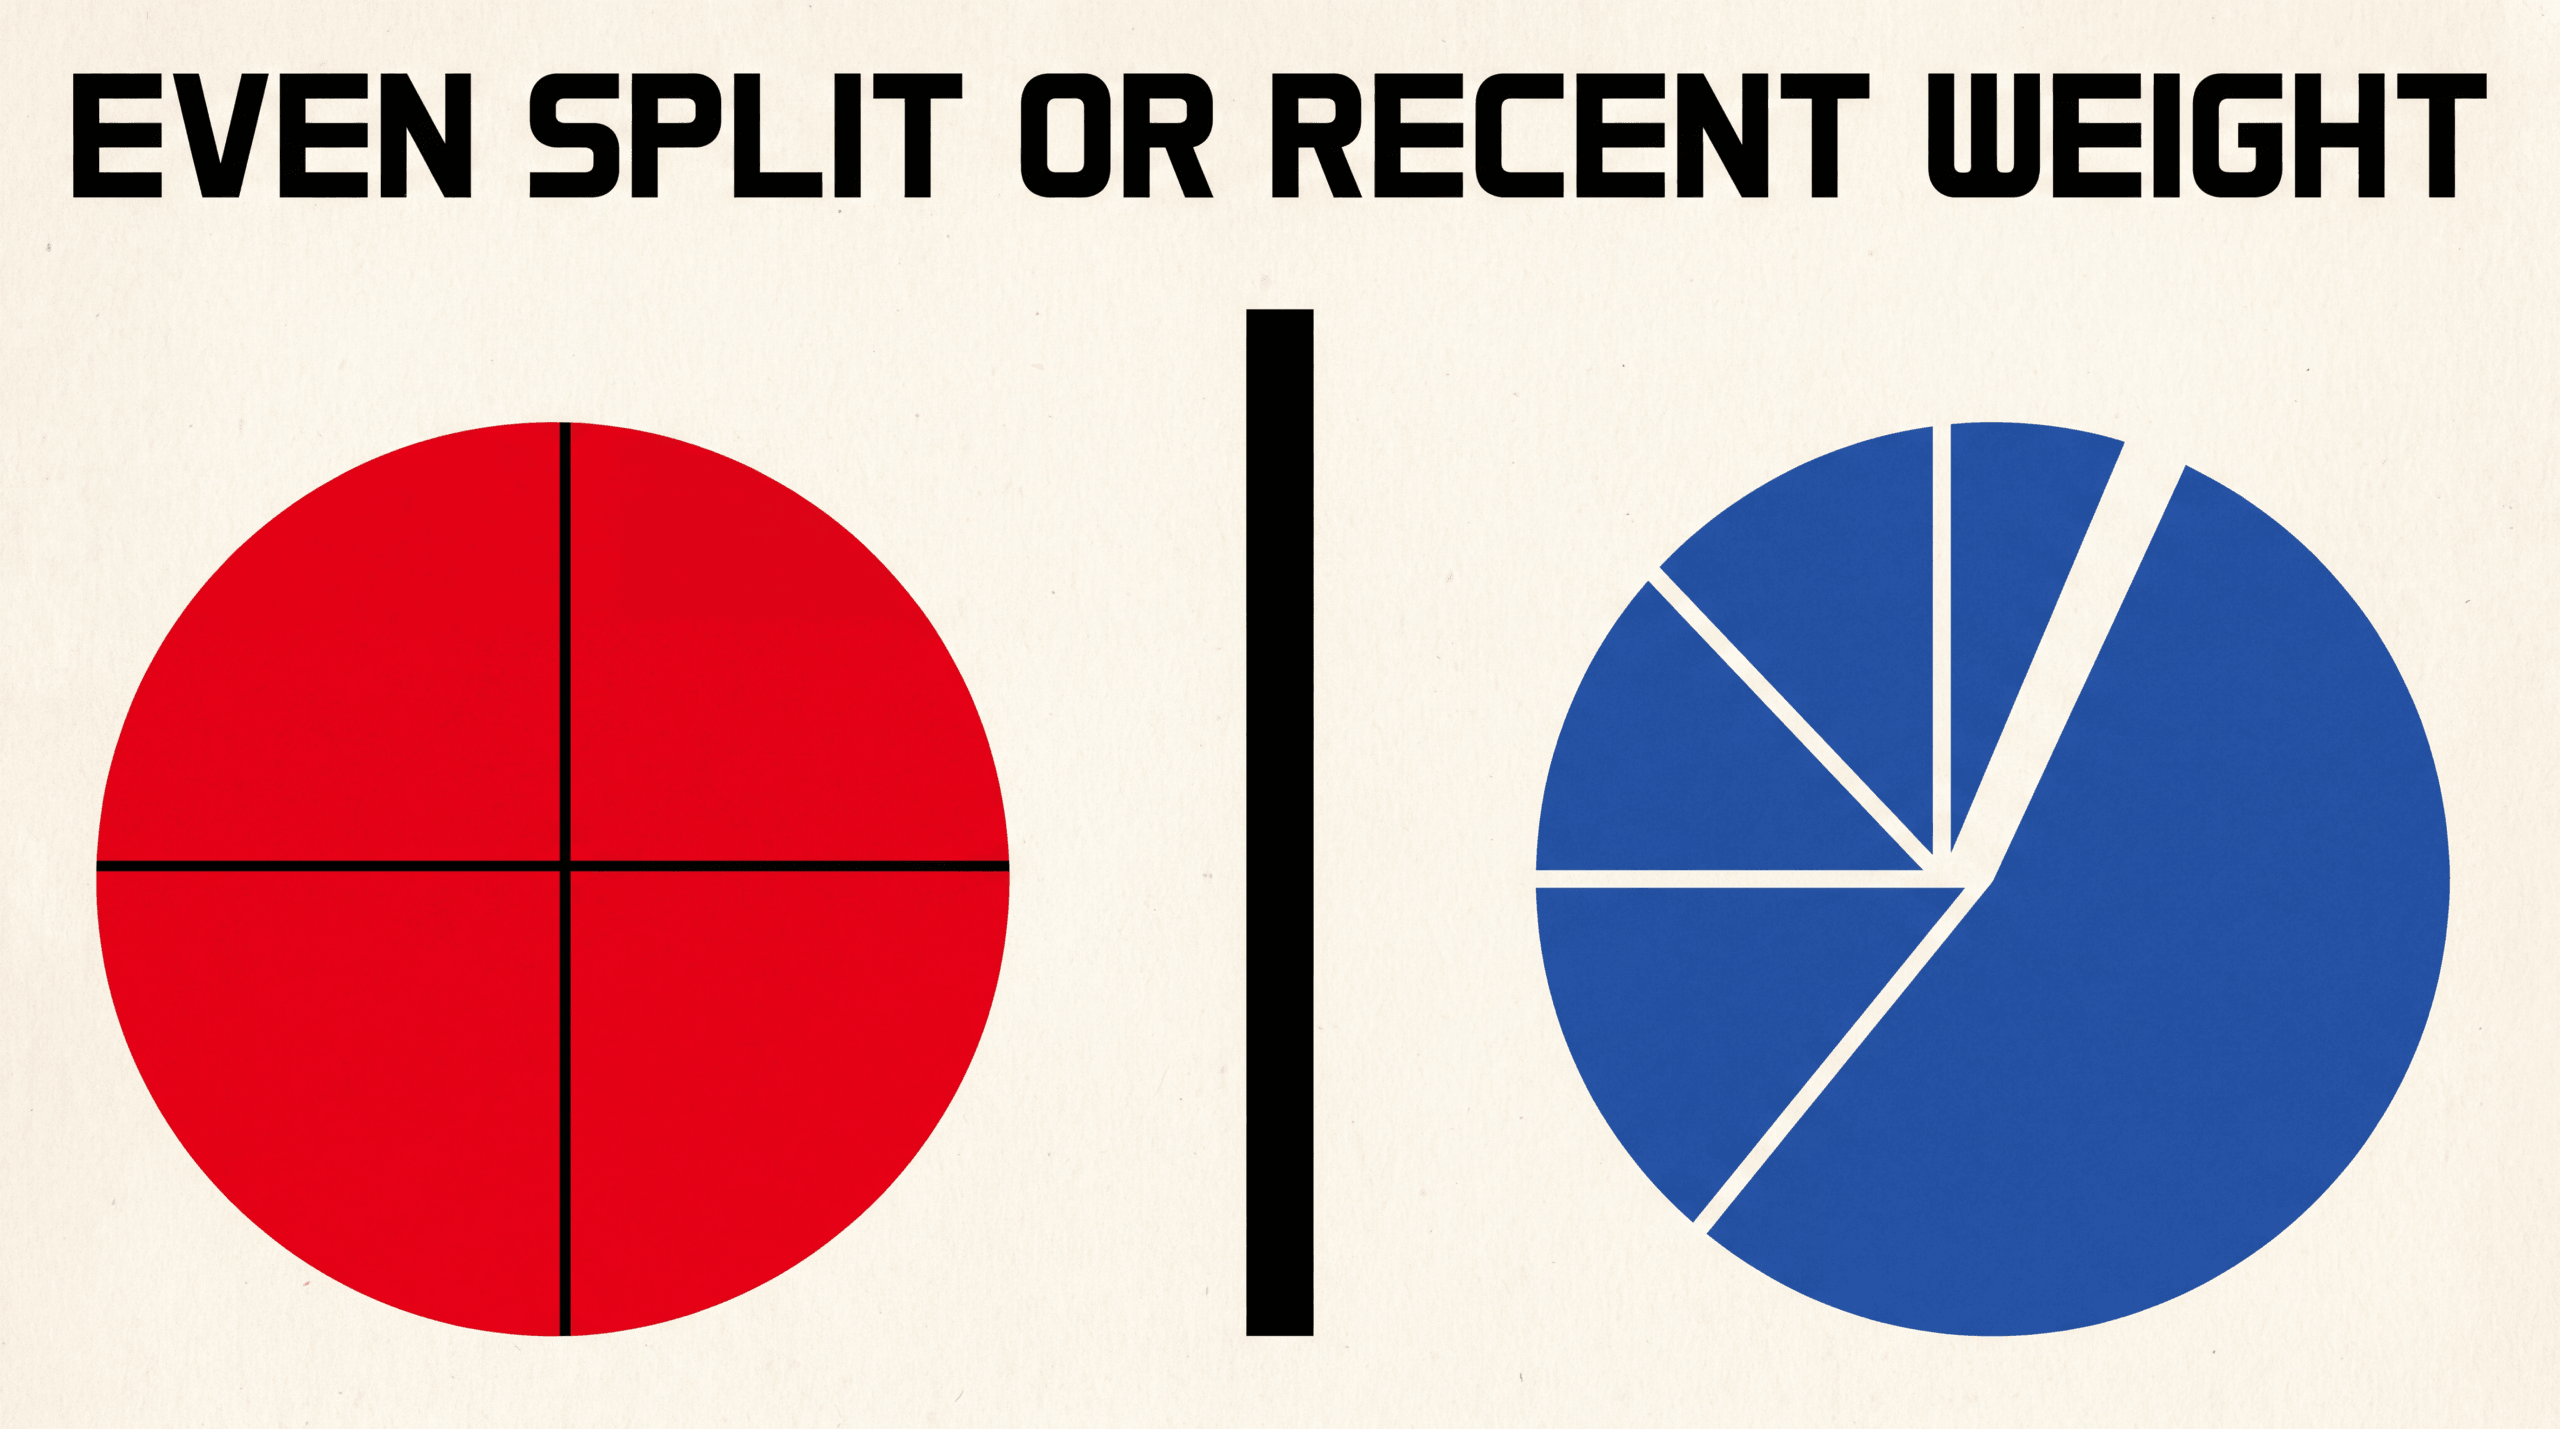
Linear attribution splits conversion credit equally across every touchpoint in the customer journey. Five channels before purchase, each one gets exactly 20% of the credit. Time-decay also credits every touchpoint, but it weights them by recency. Interactions closer to the conversion receive more credit, while earlier touchpoints receive progressively less. Both models solve the problem that single-touch models ignore: the reality that customers rarely buy after just one ad click. The difference is in how they answer which touchpoints mattered most.
TL;DR
- Linear attribution gives every touchpoint equal credit. Five touchpoints on a $500 sale means $100 each, no exceptions. Simple to implement, but treats a casual banner impression the same as the demo call that closed the deal.
- Time-decay attribution gives more credit to touchpoints closer to the conversion using an exponential decay formula. The ad someone clicked 30 minutes before buying gets far more credit than the blog post they read three weeks earlier.
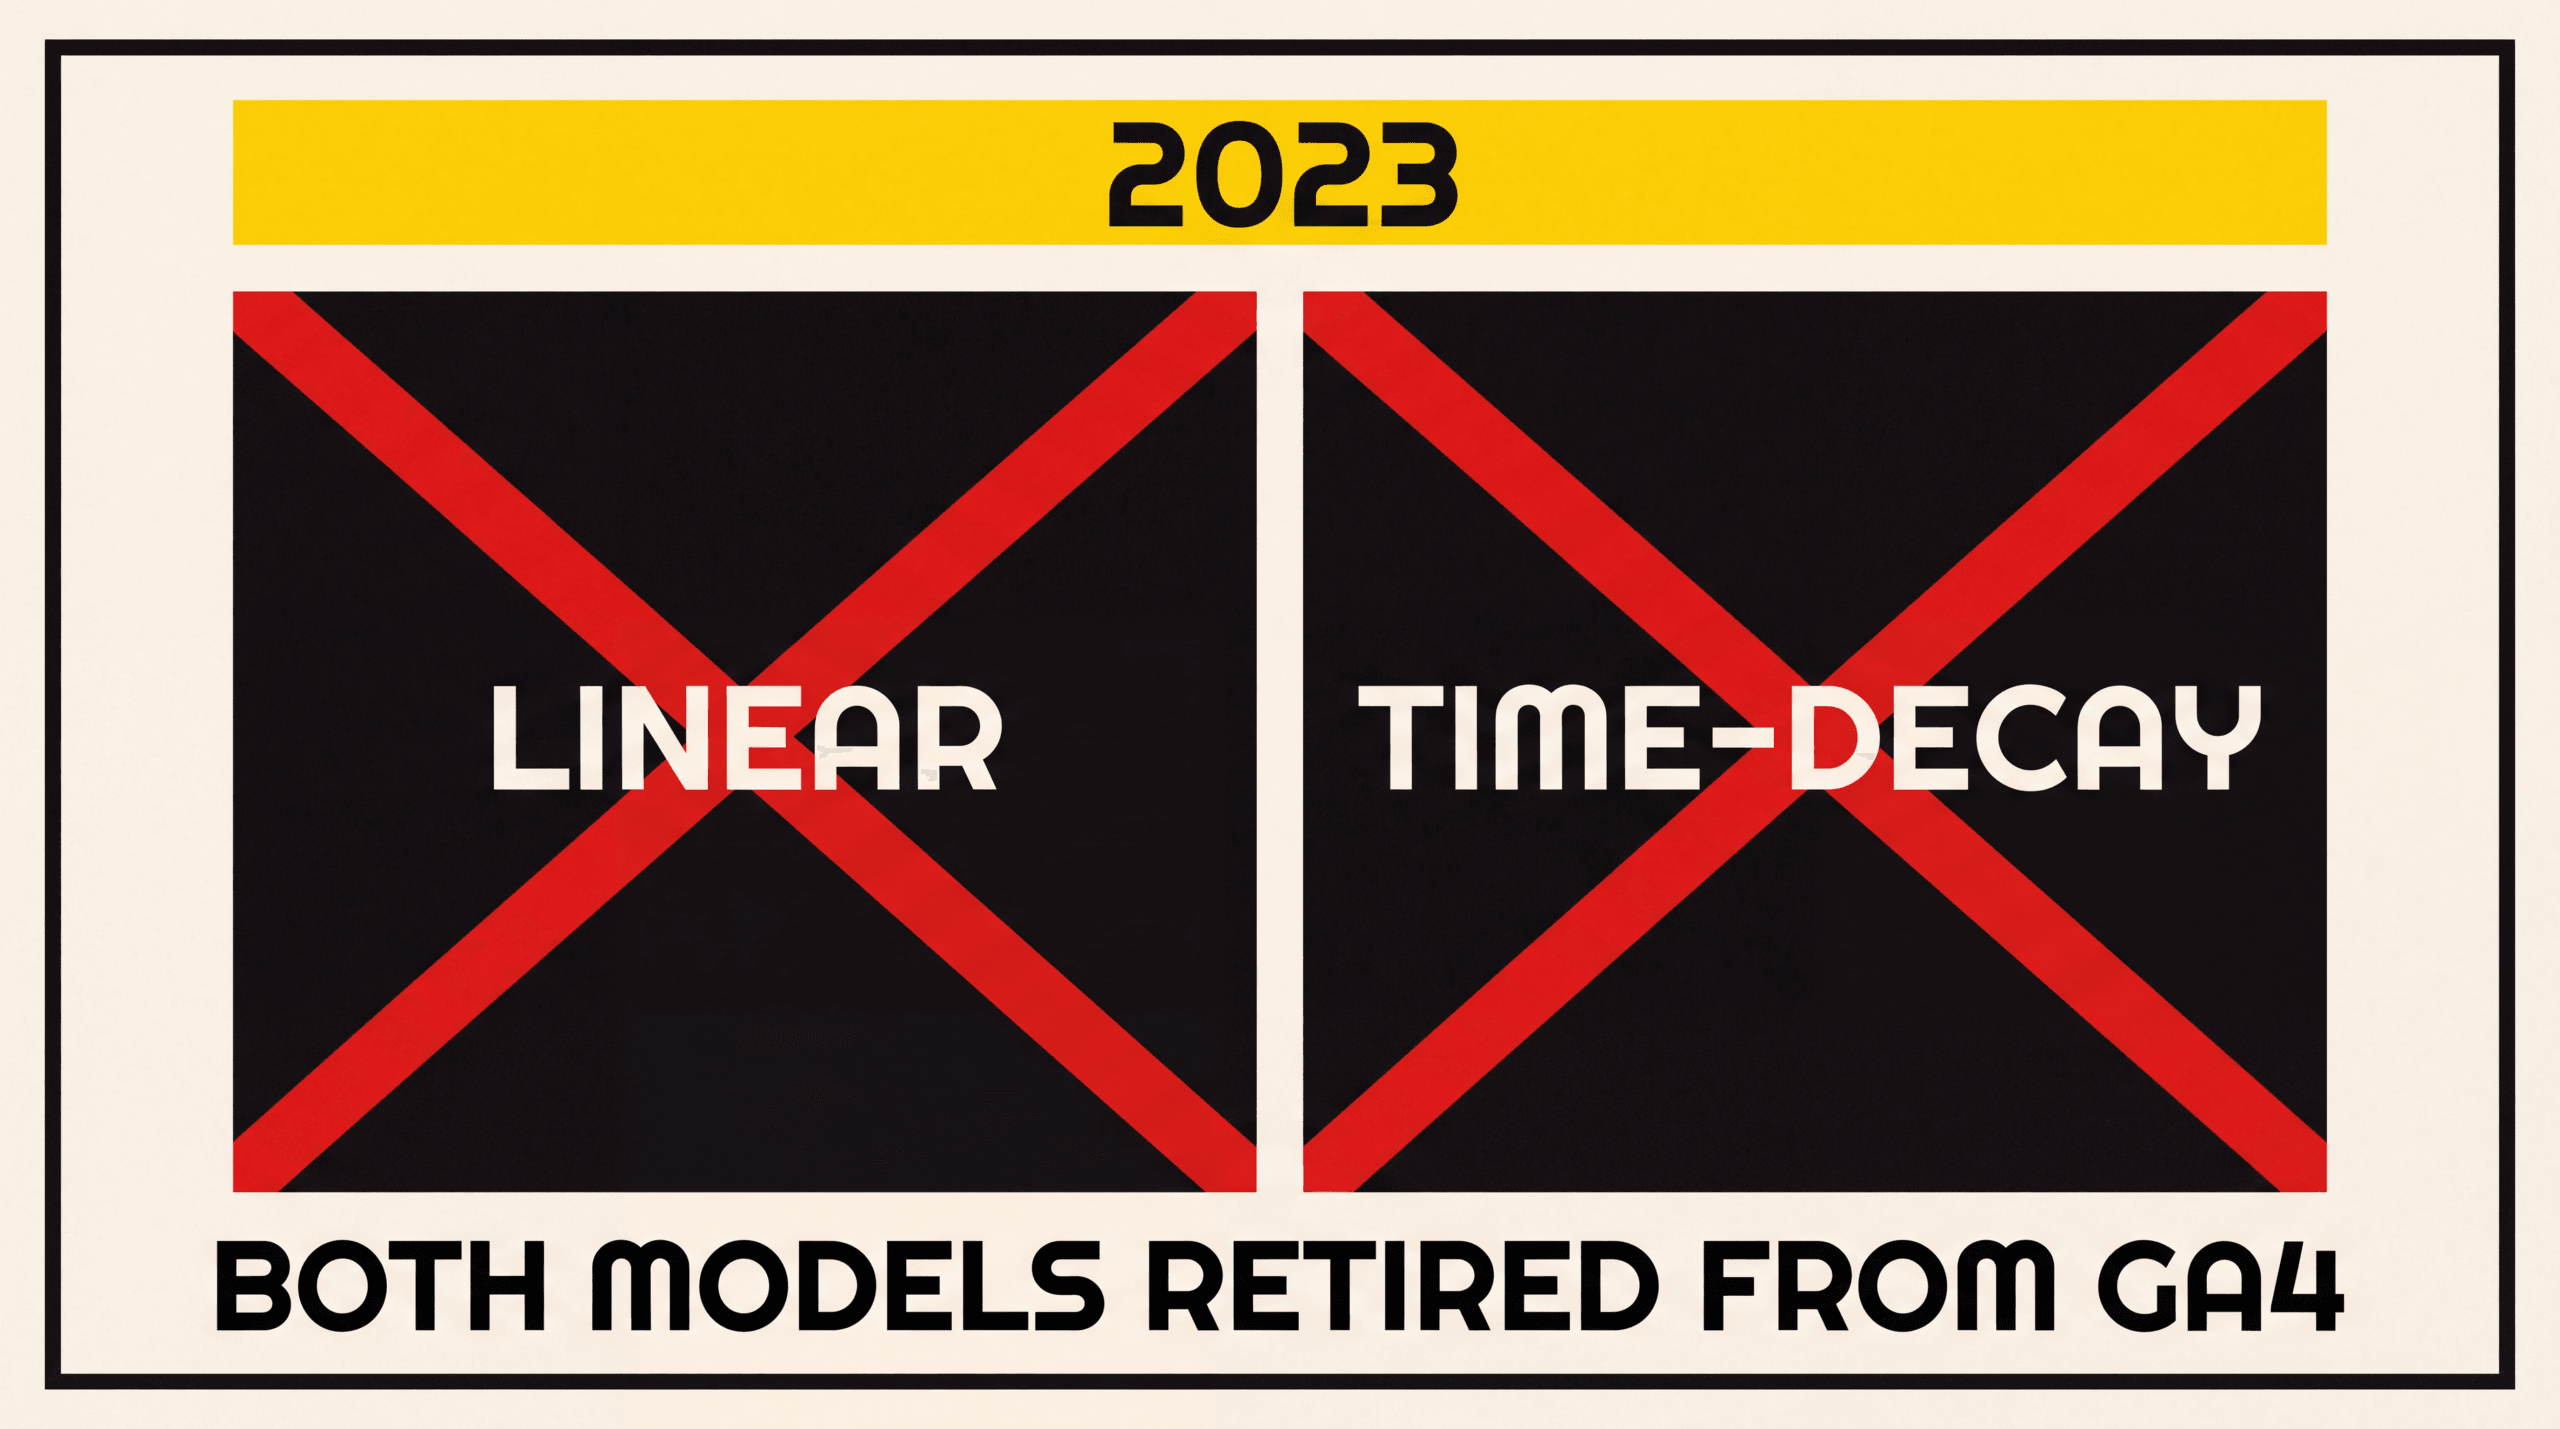
- Google removed both models from Google Ads and GA4 in 2023, citing that fewer than 3% of advertisers were using them. Only last-click and data-driven attribution remain as options inside Google’s ecosystem.
- You can still run linear and time-decay models through third-party attribution tools like Hyros, Northbeam, and Rockerbox, or build your own in a spreadsheet or data warehouse.
- Neither model is objectively better. Linear works when you genuinely don’t know which touchpoints matter and want unbiased data. Time-decay works when your business has longer sales cycles and recent interactions are more predictive of purchase intent.
What Is Linear Attribution?
Linear attribution is the simplest multi-touch model available. It takes the total conversion value and divides it equally among every recorded touchpoint, regardless of when those touchpoints occurred, what type of interaction they were, or where in the funnel they sit. No touchpoint gets favored. No touchpoint gets ignored.
The appeal is fairness. Unlike first-click or last-click models that give 100% of the credit to a single interaction and pretend the rest of the journey didn’t happen, linear attribution acknowledges that every channel contributed. The tradeoff is it has no opinion about which contributions were more important. A YouTube awareness ad, a Google search click, a retargeting impression, and the direct visit where someone actually bought all receive the same slice. Equal votes. No weighting. That’s both the strength and the problem.
For a broader look at how multi-touch models compare to single-touch approaches, see our multi-touch attribution guide.
How Linear Attribution Distributes Credit
The formula is straightforward division:
Credit per touchpoint = Conversion value / Number of touchpoints
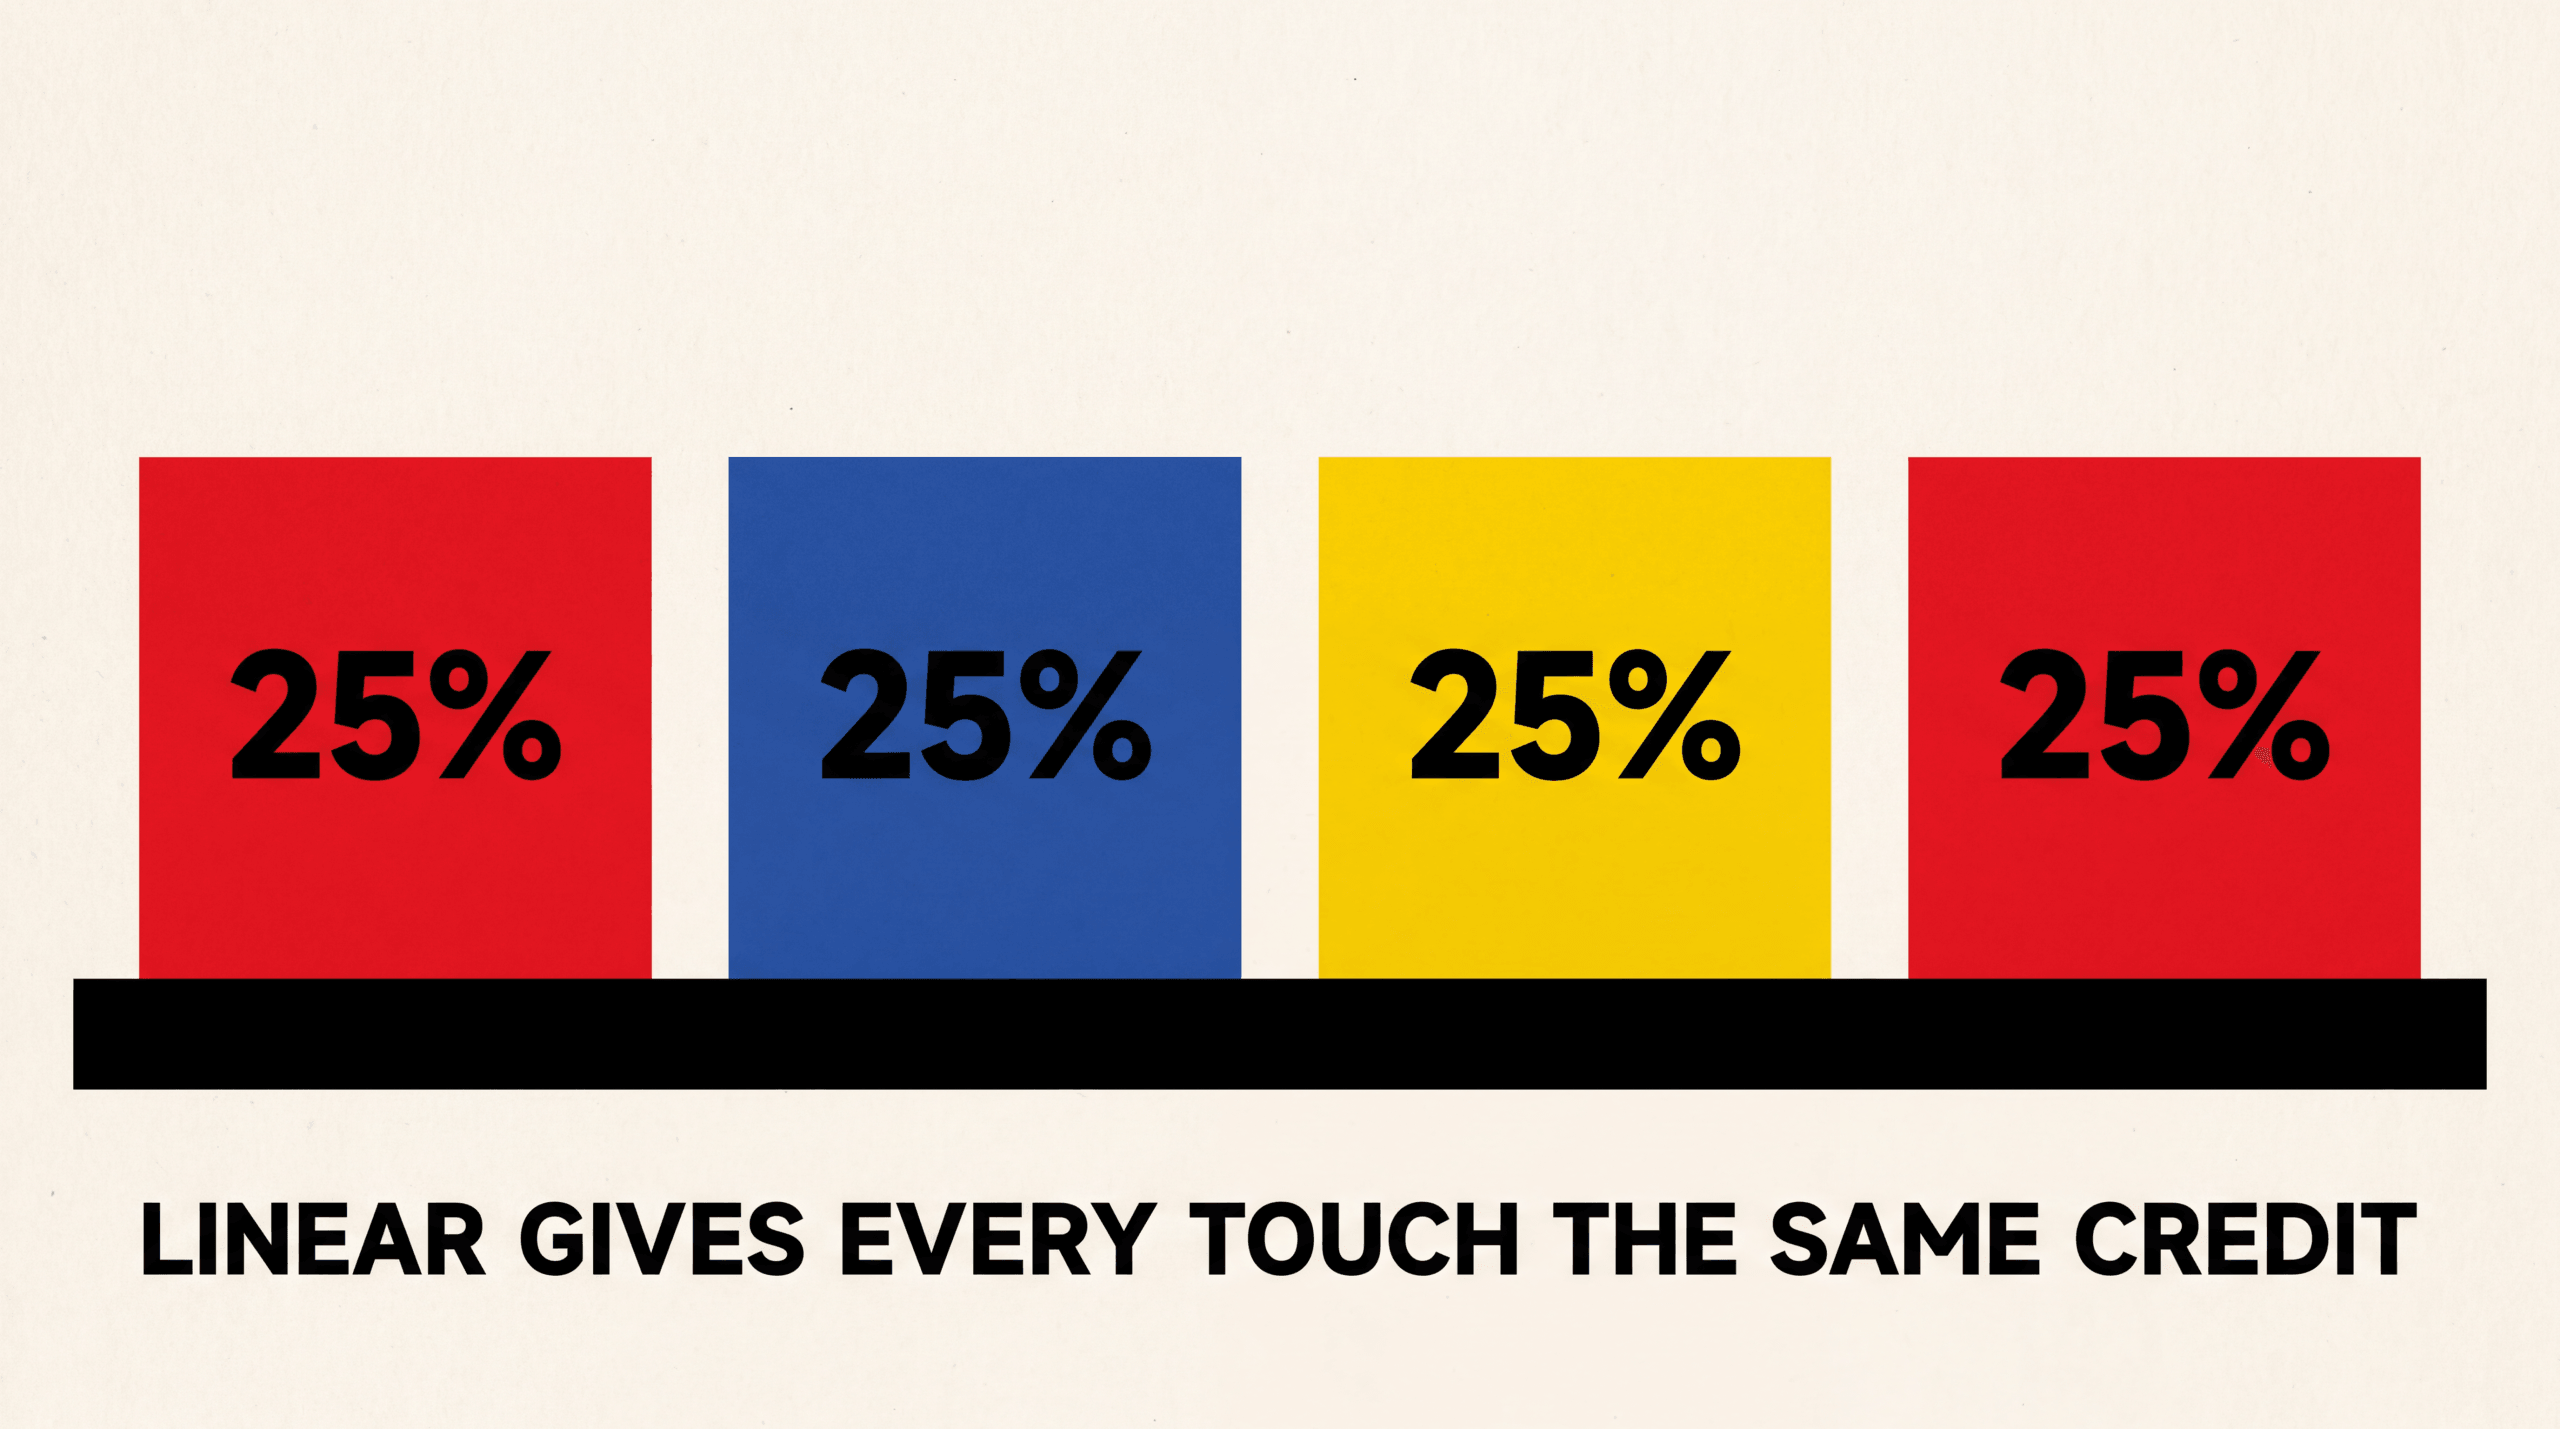
There is no weighting, no decay function, and no machine learning involved. If the system recorded four touchpoints, each one gets 25%. If it recorded twelve, each one gets 8.33%. The math stays the same no matter how long the journey lasted or how many channels were involved.
This simplicity is a strength for teams that need a baseline model they can explain to stakeholders in one sentence. It is a weakness when the data it produces leads to equal budget allocation across channels that are clearly not performing equally.
Worked Example: $500 Sale, Five Touchpoints
A customer’s path to a $500 purchase looks like this:
| Touchpoint | Channel | Day | Linear Credit |
|---|---|---|---|
| 1 | Facebook video ad | Day 1 | $100 (20%) |
| 2 | Google organic search | Day 5 | $100 (20%) |
| 3 | Email newsletter click | Day 12 | $100 (20%) |
| 4 | Google Ads search click | Day 18 | $100 (20%) |
| 5 | Direct visit (purchase) | Day 21 | $100 (20%) |
Every channel gets $100. The Facebook video that introduced the brand gets the same credit as the direct visit where the customer typed in the URL and bought. In reality, these touchpoints almost certainly played different roles in the decision. Linear attribution doesn’t care. It treats the journey as a democracy where every vote counts the same.
What Is Time-Decay Attribution?
Time-decay attribution is a multi-touch model that assigns credit based on how close each touchpoint was to the conversion event. The underlying logic is simple: interactions that happened right before someone bought probably influenced the purchase more than interactions that happened weeks or months earlier. The model implements this logic through an exponential decay function that reduces credit as time increases.
Google’s implementation in the now-deprecated GA4 time-decay model used a 7-day half-life. That meant a touchpoint that occurred 7 days before the conversion received half the credit of a touchpoint that occurred on the day of conversion. A touchpoint 14 days out received a quarter. A touchpoint 21 days out received an eighth. The falloff is steep.
Time-decay sits between the extremes of last-click (which ignores everything except the final interaction) and linear (which treats everything the same). For a deeper look at what happens when you credit only the closing touchpoint, see our last-touch attribution guide.
How Time-Decay Distributes Credit
The standard formula uses exponential decay:
Weight = 0.5 ^ (time since touchpoint / half-life)
Where the half-life is the number of days it takes for a touchpoint’s credit to drop by 50%. After calculating each touchpoint’s raw weight, you normalize them so they sum to 100% of the conversion value.
Here is how normalization works in practice:
- Calculate raw weight for each touchpoint using the decay formula
- Sum all raw weights
- Divide each raw weight by the total sum to get a percentage
- Multiply each percentage by the conversion value
The half-life is the critical variable. A 7-day half-life (the old Google default) heavily favors recent interactions. A 30-day half-life is gentler and gives more credit to earlier touchpoints. The right half-life depends on how long your typical sales cycle runs.
Worked Example: Same $500 Sale, Time-Decay Split
Using the same five-touchpoint journey and a 7-day half-life, here is how the credit shifts. Day 21 is the conversion date, so we measure backward from there. First, calculate each touchpoint’s raw weight using the decay formula, then normalize so the weights sum to 100% of the $500 conversion value.
| Touchpoint | Channel | Days Before Conversion | Raw Weight | Credit ($) | Credit (%) |
|---|---|---|---|---|---|
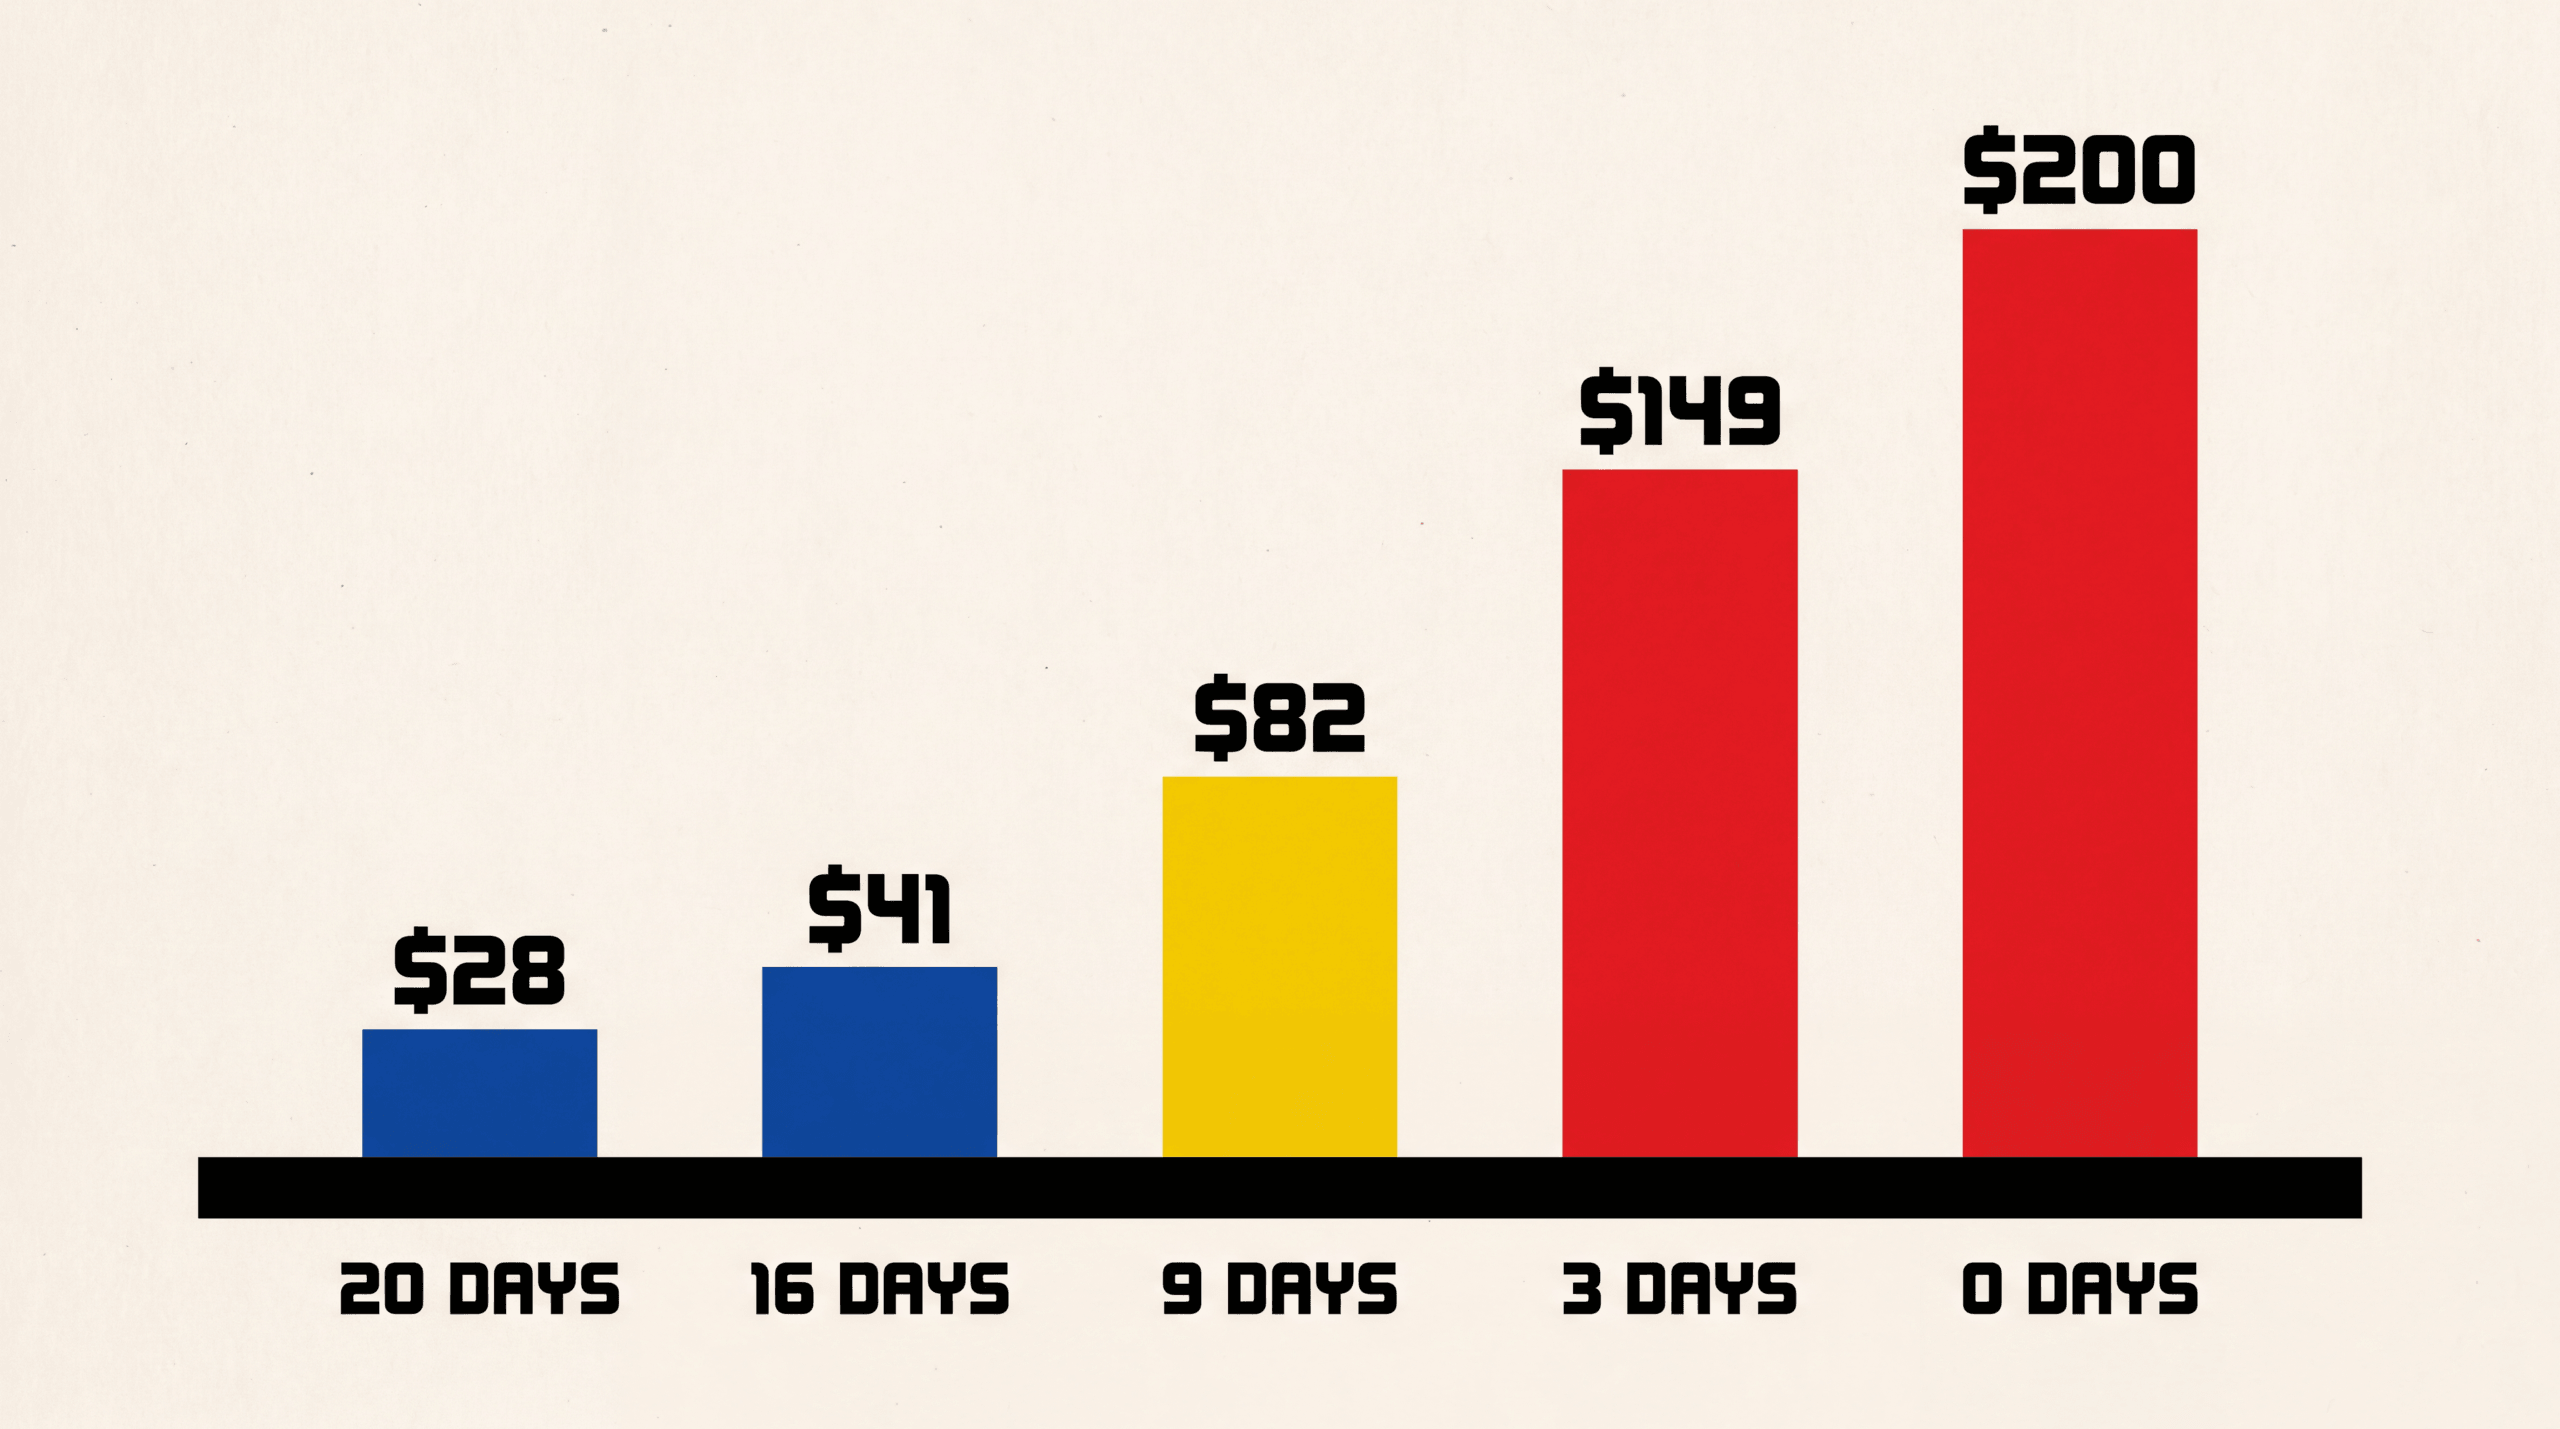
| 1 | Facebook video ad | 20 days | 0.5^(20/7) = 0.138 | $28 | 5.5% |
| 2 | Google organic search | 16 days | 0.5^(16/7) = 0.205 | $41 | 8.2% |
| 3 | Email newsletter click | 9 days | 0.5^(9/7) = 0.410 | $82 | 16.4% |
| 4 | Google Ads search click | 3 days | 0.5^(3/7) = 0.743 | $149 | 29.8% |
| 5 | Direct visit (purchase) | 0 days | 0.5^(0/7) = 1.000 | $200 | 40.0% |
| Total | 2.496 | $500 | 100% |
The normalization step: raw weights sum to 2.496, so each dollar of credit equals $500 / 2.496 = $200.30 per unit of weight. Multiply each raw weight by that factor to get the dollar amounts above.
Compare this to the linear model where every channel got $100. Under time-decay, the Facebook ad that started the journey 20 days ago gets $28 instead of $100. The Google Ads click that happened 3 days before purchase gets $149 instead of $100. The final direct visit gets $200. Time-decay rewards proximity.
Linear vs Time-Decay: Side-by-Side Table
| Factor | Linear | Time-Decay |
|---|---|---|
| Credit distribution | Equal across all touchpoints | Weighted by recency (exponential decay) |
| Favors which channels | None — completely neutral | Bottom-of-funnel and closing channels |
| Penalizes which channels | None explicitly, but dilutes high-impact channels | Top-of-funnel awareness channels |
| Setup complexity | Minimal — basic division | Moderate — requires half-life parameter and decay math |
| Best for sales cycles | Short to medium (under 30 days) | Medium to long (30-90+ days) |
| Biggest blind spot | Treats a $2 display impression like a $2,000 demo call | Discounts the ad that started the entire relationship |
| Available in Google Ads/GA4 | No (removed 2023) | No (removed 2023) |
| Available in third-party tools | Yes (Hyros, Northbeam, Rockerbox, custom builds) | Yes (same tools) |
| Data requirement | Low — just needs touchpoint count | Low — needs touchpoint count plus timestamps |
| Transparency | High — anyone can verify the math | High — formula is public, reproducible |
Both models are deterministic: given the same inputs, they produce the same outputs every time. This makes them auditable, which is something you can’t say about most data-driven or algorithmic attribution models that operate as black boxes.
When Should You Use Linear Attribution?
Linear attribution makes the most sense in three scenarios.
Scenario 1: You’re launching a new product or entering a new market. You don’t yet know which channels matter most. Equal distribution prevents you from prematurely over-investing in one channel based on assumptions. After 60-90 days of linear data, you’ll have a map of which channels consistently appear in conversion paths. I’ve seen this work well as a starting point before switching to a more sophisticated model once you have real data.
Scenario 2: Your sales cycle is short and touchpoints are few. When the average customer interacts with 2-4 touchpoints over a week or less, the difference between linear and time-decay credit is minimal. A 3-touchpoint journey with a 7-day half-life might split $100 as $33/$33/$33 (linear) versus $24/$33/$43 (time-decay). At small touchpoint counts, the practical difference in budget decisions is marginal.
Scenario 3: You need a benchmark to test other models against. Linear attribution is the “control group” of attribution models. Because it makes zero assumptions about touchpoint importance, it is useful as a baseline. Run linear alongside time-decay or data-driven models for the same period and compare the outputs. Where they diverge most shows you which channels the other models are either rewarding or penalizing — and you can decide whether that reward or penalty reflects reality.
The main risk of running linear long-term is misallocation. If your YouTube ads drive awareness but Google Brand Search campaigns close the sale, linear gives them equal credit. Over time, this can lead you to cut the search campaigns (which look redundant) and scale the YouTube ads (which look equally productive). In reality, your conversions may drop because you cut the closer. For a deeper look at how analytics tools like GA4 interact with these models, see our ad tracking vs analytics comparison.
When Should You Use Time-Decay Attribution?
Time-decay works best when your customer journey has length and your closing touchpoints genuinely matter more than your opening ones.
B2B with long sales cycles. Let’s imagine a buyer who first saw a LinkedIn ad 90 days ago, attended a webinar 45 days ago, downloaded a whitepaper 20 days ago, and booked a demo 3 days ago. That person is showing increasing engagement over time. Time-decay captures that acceleration. The 90-day-old LinkedIn ad helped, but the demo was the action that tipped the decision. Giving those two touchpoints equal credit (as linear does) would be wrong.
Retargeting-heavy funnels. If your strategy involves generating initial traffic through cold campaigns and then closing sales with retargeting sequences, time-decay aligns credit with reality. Retargeting ads tend to fire in the final days before purchase. Time-decay gives them proportionally more credit, which matches their role in your funnel.
Seasonal or event-driven businesses. When there’s a clear buying window (Black Friday, launch week, enrollment deadline), the touchpoints closest to that window carry the most influence. A nurture email sent four months ago is less relevant than the countdown-timer email sent the morning of the sale. Time-decay models this correctly.
The risk with time-decay is underfunding top-of-funnel activity. If your Facebook prospecting campaigns consistently start customer relationships that convert 30-60 days later, time-decay will undervalue them. You may cut prospecting spend, see your pipeline dry up a month later, and not connect the two events because the attribution model told you those campaigns weren’t performing.
Why Did Google Remove Both Models from GA4?
In 2023, Google removed four rule-based attribution models from Google Ads and GA4: first-click, linear, time-decay, and position-based. Conversion actions that had been using these models were automatically migrated to data-driven attribution. Only last-click and data-driven remained as options.
Google’s stated rationale was low adoption — fewer than 3% of advertisers were using the four removed models. Google had made data-driven attribution (DDA) the default for new conversion actions in late 2021, and the majority of advertisers never switched away from it. From Google’s perspective, maintaining four rarely-used models added complexity to the product without meaningful user benefit.
But there’s a second layer to this decision that matters for advertisers. Data-driven attribution in Google’s ecosystem uses Google’s data, Google’s algorithm, and Google’s black-box model to tell you which of your Google campaigns deserve credit. You cannot inspect the formula. You cannot reproduce the output in a spreadsheet. You trust Google’s math or you don’t. And I’ll be direct: trusting any ad platform to grade its own homework is a mistake I’ve seen cost people serious money.
Linear and time-decay models, by contrast, are fully transparent. You can calculate the credit distribution by hand. You can audit the output. You can run the same model across Google Ads, Meta Ads, TikTok Ads, and your email platform simultaneously and get a cross-channel view that no single platform’s DDA model can provide.
When Google removed these models, advertisers who wanted transparent, rule-based multi-touch attribution lost their in-platform option. For a detailed comparison of what GA4 provides versus what dedicated attribution tools offer, see our Hyros vs GA4 breakdown.
Where Can You Still Use Linear and Time-Decay Models?
Google’s removal didn’t eliminate these models from existence. It eliminated them from Google’s products. Several alternatives exist for advertisers who still want rule-based multi-touch attribution.
Third-Party Attribution Tools
Dedicated attribution platforms operate independently of the ad networks and support multiple attribution models — including linear and time-decay.
Hyros uses AI-powered multi-touch attribution that tracks the full customer journey across channels and devices using first-party data. Hyros can apply various attribution models to the same data set, letting you compare how credit shifts under different rules. With over 4,000 customers and more than $3.5 billion in tracked revenue, Hyros provides cross-platform attribution that doesn’t depend on any single ad network’s data. Entry pricing starts at $230/month (annual) or $379/month (monthly).
Northbeam focuses on media mix modeling and multi-touch attribution for DTC brands, starting at $1,500/mo (Northbeam’s published entry price). Northbeam offers customizable attribution models and incrementality testing.
Rockerbox provides multi-touch attribution with data warehouse exports (Snowflake, BigQuery, Redshift), starting at $1,000-$2,000/month for mid-market brands. Rockerbox includes pre-built model comparisons and deduplicated conversion reporting.
All three platforms let you run the same conversion data through multiple models simultaneously, which is the only way to understand how model choice affects your spending decisions.
Custom Spreadsheet Models
For smaller advertisers or teams that want to understand the math before investing in a platform, you can build both models in a spreadsheet.
Linear requires two columns: touchpoint name and conversion value divided by touchpoint count. That is the entire model.
Time-decay requires touchpoint name, timestamp, and the half-life formula: Weight = 0.5^(days before conversion / half-life). Normalize the weights so they sum to 1, multiply by conversion value, and you have your credit allocation. Any team with access to their touchpoint data and a spreadsheet can run this in an afternoon.
Data Warehouse Queries
If your organization pipes ad platform data into a warehouse (BigQuery, Snowflake, Redshift, or similar), you can implement both models as SQL queries. This approach scales to millions of conversion paths and lets you customize the half-life parameter, exclude certain touchpoint types, or weight touchpoints differently by channel.
The SQL for linear attribution is a simple COUNT of touchpoints per conversion path followed by division. Time-decay requires a timestamp diff and the exponential decay function, which most SQL dialects support natively or through a UDF. For the basics of what tracking infrastructure you need to support any attribution model, see our guide on what is ad attribution.
How Does Hyros Handle Multi-Touch Attribution?
I built Hyros because I needed something that didn’t force me to pick one model and live with its blind spots. The tool combines deterministic user tracking with AI-driven attribution that considers the entire customer journey.
Here is how it works in practice:
First-party data foundation. Hyros tracks users through server-side data collection and deterministic matching (email, phone, login). This means the attribution data isn’t degraded by ad blockers, cookie restrictions, or iOS privacy changes the way browser-based tracking is. Independent analysis by CheckThat.ai found that Hyros captures 29-33% more conversions than native platform reporting — conversions that would have been invisible to any model running on platform-side data alone.
Cross-device and cross-platform stitching. A customer who clicks a Meta ad on their phone, researches on their laptop, and buys through an email link on their tablet appears as one continuous journey in Hyros. Rule-based models like linear and time-decay can only work with the touchpoints they can see. If your tracking system misses half the journey, even the best model produces garbage output.
Model comparison built in. Hyros lets you view the same conversion data through different attribution lenses. You can see what your ROAS looks like under linear, under time-decay, or under Hyros’s AI model. This comparison reveals which campaigns are model-sensitive (their performance changes dramatically depending on the model) and which are model-stable (they look good under any model). Model-stable campaigns are your safest scaling candidates.
Real results from better data. According to a published Hyros case study, Dan Henry became 300% more profitable within 72 hours of implementing Hyros tracking, scaling from $20K/month to $300K/month in ad spend. The attribution data didn’t just change which channels looked profitable — it changed the entire scaling trajectory by showing which campaigns were actually producing revenue.
Hyros holds a 4.8 out of 5 rating on Trustpilot from 600+ reviews, with pricing starting at $230/month on an annual plan.
FAQ
Is linear attribution still available in Google Ads?
No. Google removed linear attribution (along with first-click, time-decay, and position-based) from Google Ads and GA4 in 2023. Conversion actions that were using these models were automatically migrated to data-driven attribution. If you want to use linear attribution today, you need a third-party attribution tool or a custom implementation in a spreadsheet or data warehouse.
What is the default half-life in time-decay attribution?
Google’s deprecated time-decay model used a 7-day half-life, meaning a touchpoint 7 days before conversion received half the credit of a touchpoint on the conversion day. Third-party tools and custom implementations let you set any half-life. Common choices range from 7 days for short sales cycles to 30 days or longer for B2B and high-ticket products. The right half-life should roughly match the length of your typical buying cycle.
Which model is better for e-commerce?
Neither is universally better. For e-commerce brands with short purchase cycles (under 7 days from first touch to sale), the difference between linear and time-decay credit allocation is small. Time-decay is generally more useful for e-commerce brands running retargeting-heavy strategies or selling higher-ticket items where the buying window stretches to 14-30 days. If your average path to purchase has only 2-3 touchpoints, start with linear for simplicity.
Can I use both models at the same time?
Yes, and you should. Running both models on the same data reveals how sensitive your channel performance is to the attribution methodology. If Facebook looks great under linear but mediocre under time-decay, it means Facebook is involved in many journeys but mostly at the beginning. If Google Ads looks mediocre under linear but strong under time-decay, it means Google is appearing near the end of journeys. These insights help you understand channel roles, not just channel credit.
Why did Google keep last-click but remove linear and time-decay?
Google’s stated reason was adoption: fewer than 3% of advertisers used the four removed models. Last-click survived because it remains useful as a comparison point and has a long history in the platform. Google’s preferred model is now data-driven attribution, which uses machine learning on Google’s own data. The practical effect is that transparent, rule-based multi-touch attribution is no longer available inside Google’s ecosystem. Advertisers who want it need to go outside the platform.
How does time-decay attribution handle touchpoints on the same day?
Touchpoints on the same day as the conversion all receive the maximum weight (weight = 1.0, since days-before-conversion = 0). If you have three touchpoints on the conversion day and one touchpoint from a week ago, the three same-day touchpoints each get far more credit than the week-old one. Some implementations break ties within a single day by using hourly timestamps instead of daily ones, giving slightly more credit to the very last interaction.
Standalone Summary
Linear and time-decay attribution are both multi-touch models that distribute conversion credit across every touchpoint in the customer journey. Linear splits credit equally, making it the simplest multi-touch model to implement and audit. Time-decay uses an exponential decay function with a half-life parameter to give more credit to touchpoints closer to the conversion, which better reflects purchase intent in longer sales cycles. Google removed both models from Google Ads and GA4 in 2023, leaving data-driven attribution as the default and last-click as the alternative. Advertisers who still want these rule-based models can use third-party attribution platforms like Hyros, build custom spreadsheet models, or run SQL queries in a data warehouse. Hyros provides server-side, cross-device tracking that captures 29-33% more conversions than native platform reporting, giving any attribution model applied to its data a more complete picture of the customer journey.
See how Hyros tracks every touchpoint across every channel –> Book a demo