


The CAC-to-LTV Ratio: How to Tell If Your Ad Spend Is Actually Profitable
Every business metric eventually reduces to one question: does the business model actually work? The LTV:CAC ratio is how you answer it with a number instead of a guess. I’ve seen businesses burning cash on acquisition while their founders swear the model is fine because their ads “look profitable.” They were measuring ROAS. They weren’t measuring what a customer was actually worth over their lifetime. The CAC-to-LTV ratio compares what you spend to acquire a customer against what that customer generates across their entire relationship with you. A ratio of 3:1 means each customer generates three dollars for every dollar you spent to get them. Below 1:1, you lose money on every customer. The math is simple. Getting both numbers right is the hard part, and most businesses get at least one of them wrong because their attribution data is incomplete.
TL;DR
- LTV:CAC ratio = Customer Lifetime Value / Customer Acquisition Cost. The minimum threshold is 3:1. Top-quartile SaaS companies maintain 4:1 to 6:1. Below 2:1 means you burn cash on every customer. Above 8:1 means you are likely underinvesting in growth. The ratio sets your CAC ceiling: if LTV is $900 and target ratio is 3:1, max CAC is $300.
- Both sides depend on attribution accuracy. CAC needs an accurate customer count and source. LTV needs tracking through every subsequent purchase. If attribution misses 30% of conversions, CAC is inflated by 43% and LTV is built on a biased sample. Per Databox, platform-reported conversions sum to 150-250% of actual closed customers.
- The ratio changes by channel, cohort, and time period. A blended 4:1 can hide a 6:1 on organic and 1.5:1 on paid social. Calculating by channel lets you shift budget toward sustainable unit economics. Hyros tracks the full journey from first click through every repeat purchase, enabling LTV:CAC analysis at the channel, campaign, and creative level.
What Is the CAC-to-LTV Ratio?

The CAC-to-LTV ratio (commonly written as LTV:CAC or CLV:CAC) measures the relationship between customer lifetime value and customer acquisition cost. It answers a single question: for every dollar spent acquiring a customer, how many dollars does that customer generate over their lifetime?
The formula is:
LTV:CAC Ratio = Customer Lifetime Value / Customer Acquisition Cost
A customer with an LTV of $1,500 acquired for $500 produces a 3:1 ratio. A customer with an LTV of $200 acquired for $150 produces a 1.3:1 ratio. The first is sustainable. The second is a countdown to running out of money.
This ratio matters more than ROAS, more than CPA, and more than any individual campaign metric because it operates at the business-model level. ROAS tells you if a specific campaign is generating revenue. LTV:CAC tells you if the business can exist. You can have a 5x ROAS on every campaign and still go bankrupt if your LTV:CAC ratio is below 1. ROAS only measures the first sale. LTV:CAC measures the entire customer relationship.
Despite this importance, less than 50% of SaaS companies actually measure the LTV:CAC ratio, even though 82% calculate LTV. Most businesses know what customers are worth but do not connect that number to what they cost. They operate with half the equation and guess at the other half.
For the detailed calculation of each component, see our guides on how to calculate CAC and customer lifetime value.
How Do You Calculate the LTV:CAC Ratio?

The calculation is a division, but getting accurate inputs requires work.
Step 1: Calculate Your LTV
Use the appropriate formula for your business model:
Ecommerce: LTV = Average Order Value x Purchase Frequency x Gross Margin x Average Customer Lifespan
SaaS / Subscription: LTV = ARPU x Gross Margin / Monthly Churn Rate
High-ticket / Services: LTV = Average Contract Value x Gross Margin x Average Number of Engagements
Include gross margin in the calculation. LTV should represent contribution margin, not top-line revenue. A $100 sale with 40% margin contributes $40 toward covering acquisition costs. Using revenue instead of margin makes the ratio look healthier than it is and leads to overspending on acquisition.
Step 2: Calculate Your Fully Loaded CAC
Include all costs:
– Ad spend across every platform
– Agency and consulting fees
– Marketing and sales team salaries (pro-rated for acquisition activity)
– Software and tooling costs
– Content production costs
– Event and sponsorship costs
Do not calculate CAC using ad spend alone. A brand that spends $50,000 on ads and $30,000 on marketing salaries to acquire 400 customers has a CAC of $200, not $125. Using the incomplete number produces a ratio that looks 60% better than reality.
Step 3: Divide and Interpret
Divide LTV by CAC. That is your ratio.
Example: DTC ecommerce brand
– LTV: $280 (AOV $75 x 3 purchases/year x 50% margin x 2.5-year lifespan)
– Fully loaded CAC: $80
– LTV:CAC Ratio: 3.5:1
Example: B2B SaaS company
– LTV: $5,000 ($200 ARPU x 75% margin / 3% monthly churn)
– Fully loaded CAC: $1,200
– LTV:CAC Ratio: 4.2:1
Example: Info-product business
– LTV: $3,500 ($2,000 initial course + $5,000 mastermind at 30% conversion, 90% margin)
– Fully loaded CAC: $600
– LTV:CAC Ratio: 5.8:1
Step 4: Calculate CAC Payback Period
The LTV:CAC ratio tells you if the math works. The payback period tells you how fast. CAC Payback Period = CAC / Monthly Gross Profit Per Customer.
A customer acquired for $600 who generates $150 per month in gross profit pays back in 4 months. A customer acquired for $1,200 who generates $75 per month pays back in 16 months. Both might have healthy LTV:CAC ratios, but the second ties up capital four times longer.
For venture-backed SaaS companies, the typical CAC payback target is under 12 months. Private SaaS companies averaged approximately 23 months in 2022. Ecommerce brands with higher purchase frequency often achieve payback in 1-3 months, which allows faster reinvestment.
What Is a Good LTV:CAC Ratio?
The “good” threshold depends on your business model, growth stage, and capital structure. Here is how to read the range.
The Standard Benchmarks
| Ratio | What It Means | Action |
|---|---|---|
| Below 1:1 | Losing money on every customer | Stop spending. Fix unit economics immediately. |
| 1:1 to 2:1 | Breaking even or barely profitable | Unsustainable at scale. Reduce CAC or increase LTV. |
| 3:1 | The minimum viability threshold | Sustainable if capital is patient. Room to grow. |
| 4:1 to 5:1 | Healthy growth territory | Strong economics. Scale confidently. |
| 6:1 to 8:1 | Highly efficient | Consider whether you are underinvesting in growth. |
| Above 8:1 | Potential underinvestment | A competitor spending more aggressively may outgrow you. |
The 3:1 threshold is the most widely cited benchmark. Investors and operators use 3:1 as the minimum because it provides enough margin to cover costs beyond CAC (overhead, R&D, operations) while still generating profit. Below 3:1, the customer’s lifetime contribution barely covers the cost of getting them plus the cost of serving them.
Benchmarks by Industry
| Industry | Typical LTV:CAC | Notes |
|---|---|---|
| DTC ecommerce | 2.5:1 to 4:1 | Depends heavily on repeat purchase rate |
| B2B SaaS (SMB) | 3:1 to 5:1 | Series A average is 3:1 |
| B2B SaaS (mid-market+) | 4:1 to 7:1 | Higher ARPU, lower churn |
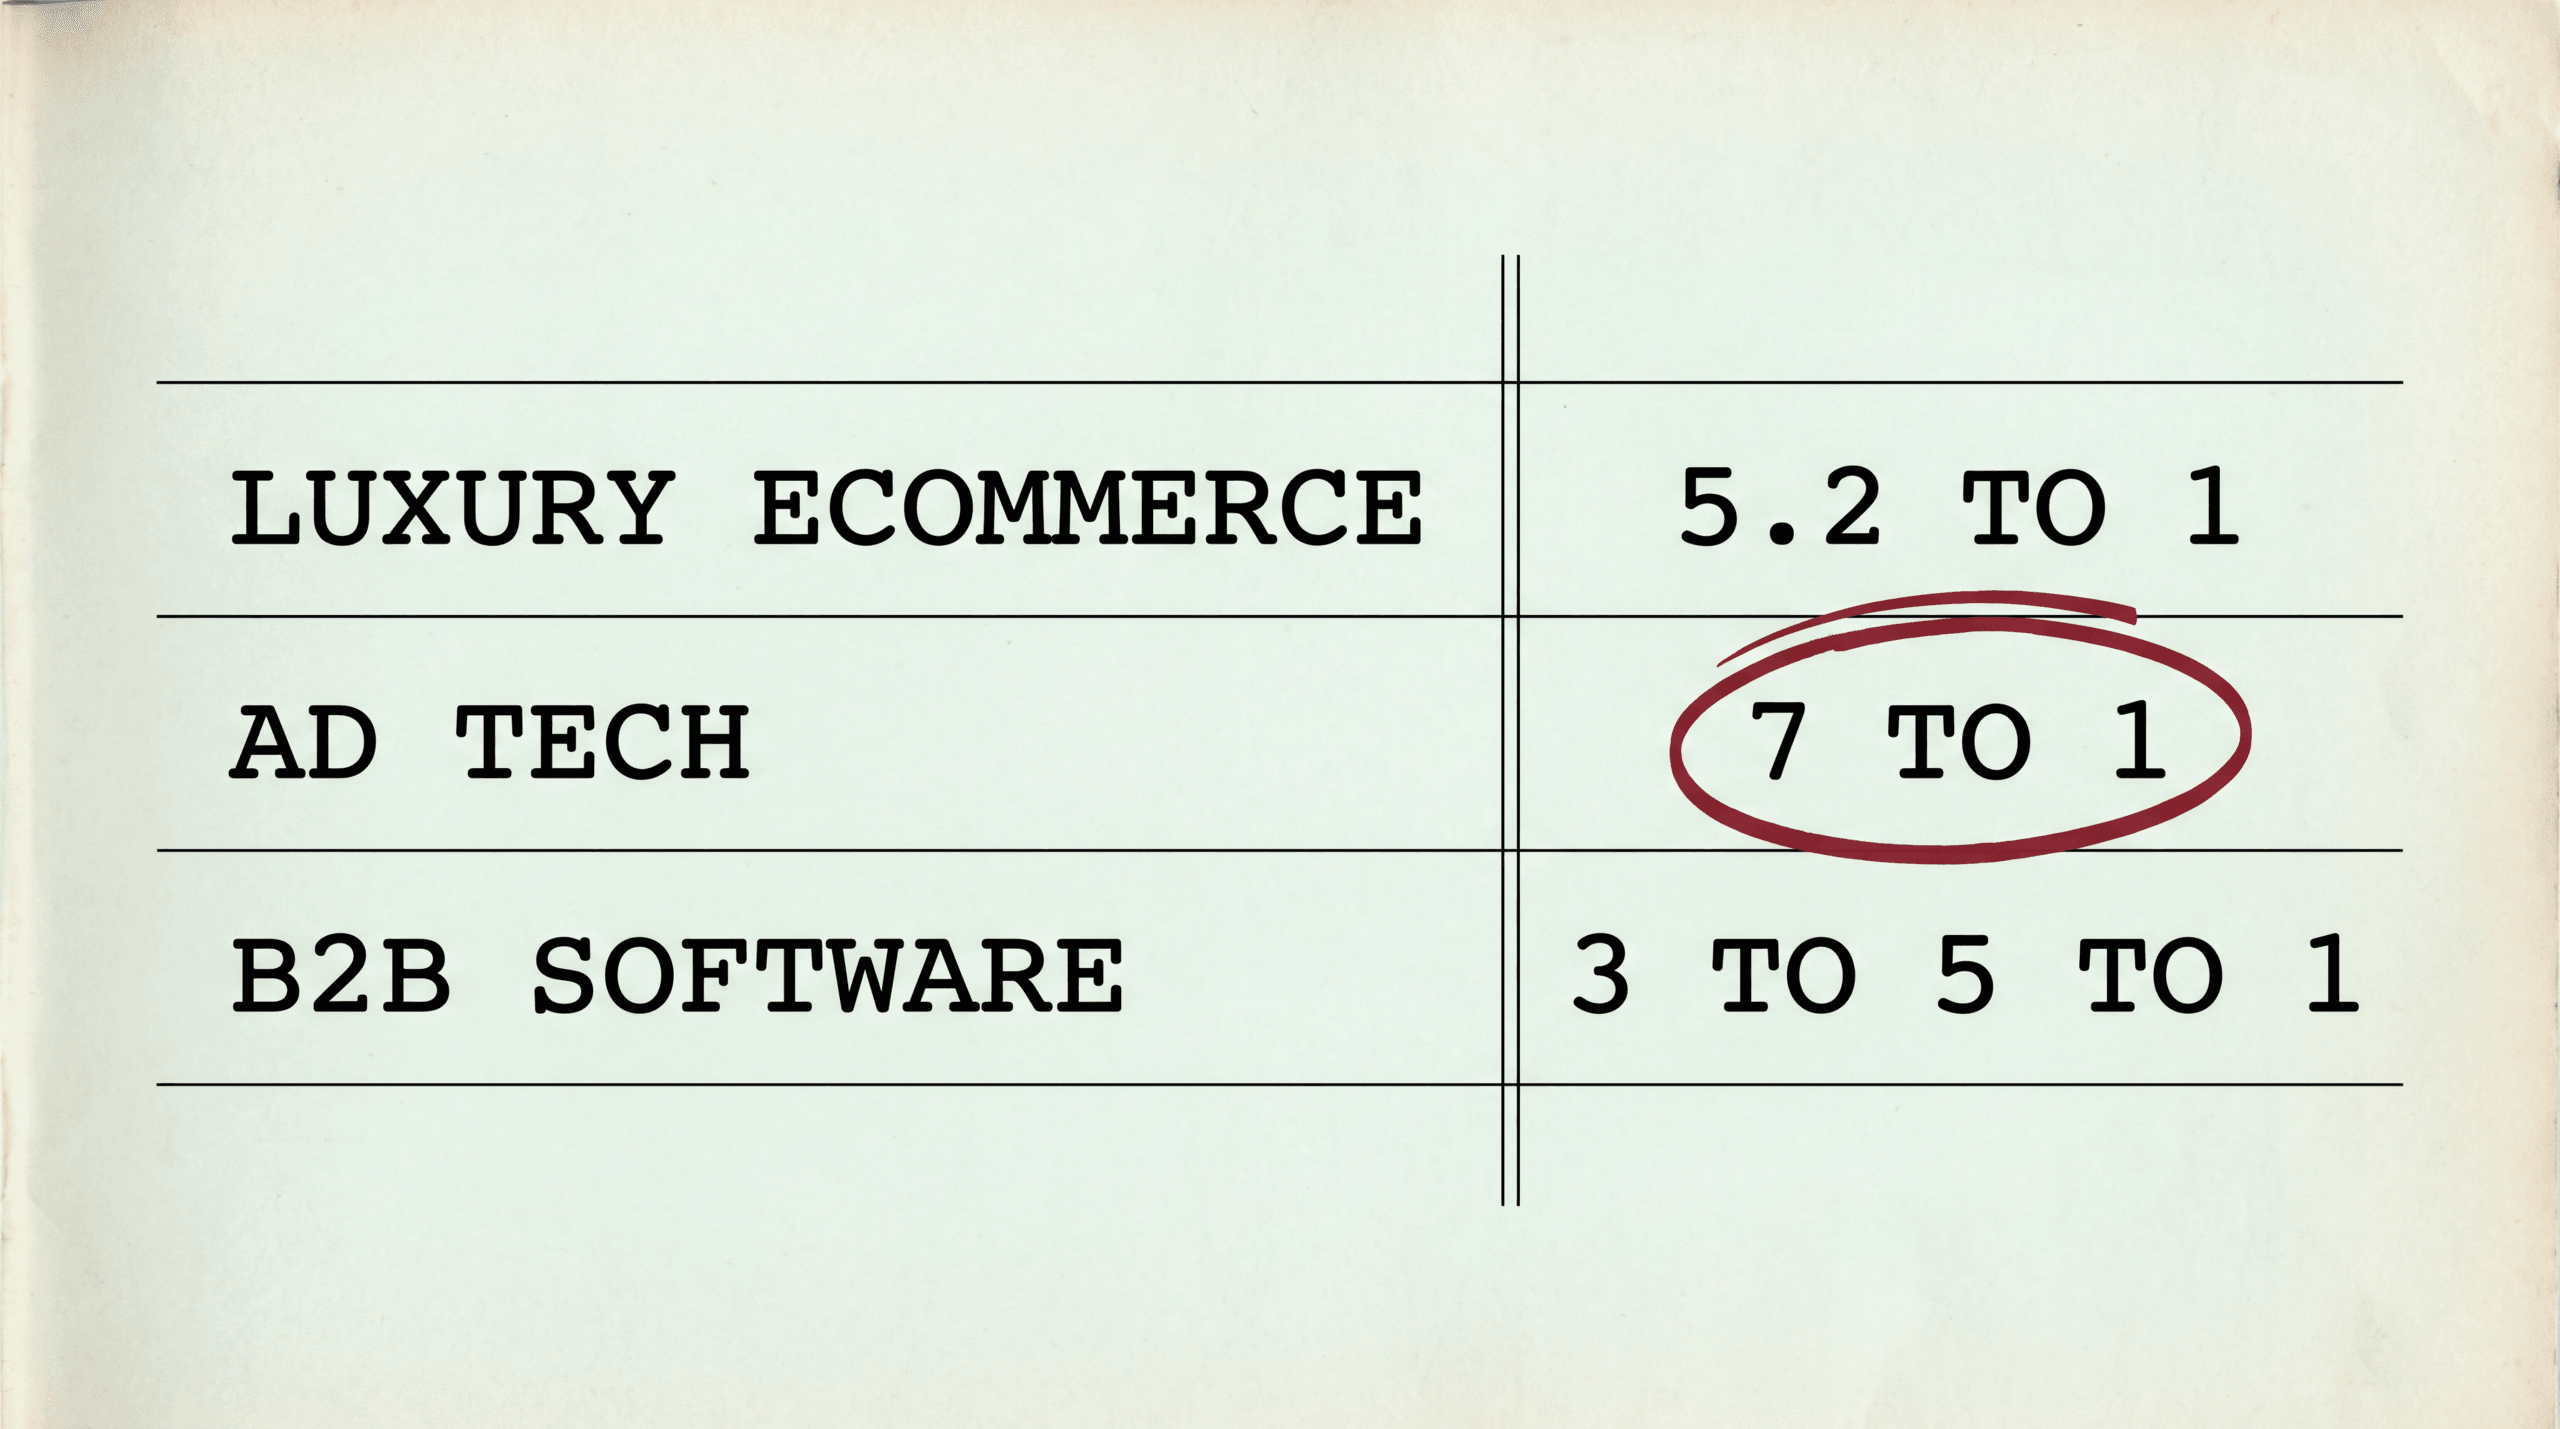
| Luxury ecommerce | 5.2:1 | Highest ecommerce ratio due to high AOV |
| Info-products / coaching | 4:1 to 8:1 | High margins, upsell paths |
| Ad tech | 7:1 | Industry-leading ratio |
| Business services | 3:1 | Average across B2B services |
| Financial services | 3:1 to 5:1 | High CAC offset by high LTV |
A DTC ecommerce brand at 2.5:1 is not necessarily in trouble if its payback period is short (1-2 months). Fast payback means capital turns over quickly, enabling rapid reinvestment even with a thinner ratio. A SaaS company at 4:1 with a 20-month payback period might have a prettier ratio but worse cash flow dynamics.
The Ratio Is a Range, Not a Target
Most companies aim for a ratio instead of hitting an exact number. The healthy range for growth-stage businesses is 3:1 to 5:1. Below 3:1 threatens viability. Above 5:1 may indicate an opportunity to spend more aggressively and capture market share before competitors do.
The exception is businesses with very short payback periods. An ecommerce brand with a 1-month payback can sustain a 2.5:1 ratio because capital recycles 12 times per year. A SaaS company with an 18-month payback needs a 5:1 ratio to survive the cash cycle.
Why Does Attribution Distort the LTV:CAC Ratio?

The LTV:CAC ratio is only as trustworthy as the attribution data behind both inputs. Attribution errors affect the ratio in compounding ways because they distort both sides simultaneously.
CAC Distortion (Denominator of CAC Formula)
Platform over-claiming inflates conversions. When Meta claims 350 conversions, Google claims 300, and TikTok claims 150 for a period where you actually had 500 unique customers, the channel-level denominator is inflated. This makes channel-level CAC look artificially low, which in turn makes the channel-level LTV:CAC ratio look artificially high. You think a channel is performing at 5:1 when it is actually at 3:1.
Tracking gaps deflate conversions. When your tracking misses 30% of actual conversions due to cookie expiration, ad blockers, and cross-device gaps, your denominator is too small. CAC appears higher than reality. The LTV:CAC ratio appears lower. You reduce spend on channels that are actually performing because the ratio says they are inefficient.
According to data from the Hyros Shopify integration page, Facebook underreports conversions by approximately 30%, Google by 29%, and TikTok by 33% compared to server-side tracked data. If you use platform-reported conversions to calculate channel CAC, your numbers carry these embedded errors into every LTV:CAC calculation.
LTV Distortion (Biased Customer Data)
When attribution only tracks 70% of customers, the tracked subset is not representative. Cookie-based tracking disproportionately captures desktop users, short-cycle converters, and single-device buyers. Mobile users with ad blockers, multi-device buyers, and customers with 3-week consideration periods are systematically excluded.
If the excluded 30% has different buying patterns (different AOV, different purchase frequency, different retention), your LTV calculated from the tracked subset does not represent your actual customer base. You might be making budget decisions based on the lifetime value of your easiest-to-track customers while remaining blind to the value of your most profitable ones.
Compound Distortion
When CAC is inflated by 30% (because tracking misses conversions) and LTV is calculated from a biased sample that underestimates true lifetime value by 15%, the combined effect on the ratio is severe:
- True ratio: LTV $500 / CAC $150 = 3.3:1
- Reported ratio: LTV $425 (biased sample) / CAC $214 (missed conversions) = 2.0:1
A 2.0:1 ratio triggers a different set of decisions than a 3.3:1 ratio. At 2.0, you cut spend. At 3.3, you scale. The business reality did not change. The measurement was wrong.
How Do You Calculate the Ratio by Channel?
The blended LTV:CAC ratio is useful for business-level health checks, but it hides critical variation across channels. Channel-level ratios tell you where to invest more and where to cut.
Why Blended Ratios Are Misleading
A blended ratio of 4:1 could mean:
– Organic search: 8:1 (high-intent customers, low acquisition cost, high retention)
– Email/referral: 10:1 (near-zero acquisition cost, highest LTV)
– Meta Ads: 2.5:1 (moderate CAC, average LTV)
– TikTok Ads: 1.5:1 (high CAC, lower LTV due to impulse purchases)
– Google Ads: 4:1 (moderate CAC, strong purchase intent, good retention)
The blended number looks healthy, but TikTok is losing money on every customer. A brand that shifts $50,000 from TikTok to Google and organic content will improve the blended ratio without spending an extra dollar.
Let’s imagine you’re the CMO looking at a blended 3.8:1 ratio and feeling good about it. Your board is satisfied. You’re hitting targets. But you’ve never broken this down by channel. When you finally do, you find Meta prospecting is at 2.3:1 and TikTok is at 1.4:1. Those two channels are consuming 60% of your budget. Organic search is at 7:1 and email is at 11:1. You’ve been systematically underfunding the channels that make money while scaling the ones that lose it, because the blended number looked fine. One channel-level breakdown changes your entire budget allocation strategy.
What You Need for Channel-Level Analysis
Calculating the ratio by channel requires two data points that most businesses lack:
1. Channel-attributed customer count with accurate CAC. You need to know which channel actually acquired each customer, not just which channel got the last click. Last-click attribution gives branded search and retargeting credit for customers that were actually acquired by prospecting campaigns. The CAC for the prospecting channel looks infinite (high spend, few attributed customers) while the closing channel looks cheap.
2. LTV tracked by acquisition source. You need to follow each customer through every subsequent purchase and tie it back to the channel that originally brought them in. Meta Ads does not track your customer’s fifth purchase. Google Ads does not know about the upsell. Only a system that tracks the full customer journey can provide this.
This is the core limitation of platform-side attribution for LTV:CAC analysis. Platforms are built to measure campaign performance on the first conversion. They are not built to measure customer lifetime value by acquisition source. That requires a dedicated attribution layer.
How Hyros Enables Channel-Level LTV:CAC
I built Hyros because channel-level LTV:CAC was the number I couldn’t calculate in my own businesses. Every platform was happy to tell me their CPA. None of them could tell me which channel was producing customers who came back and bought again six months later. That’s the real number. Hyros tracks every transaction tied to a customer profile, from the first attributed ad click through every repeat purchase, upsell, and renewal. This gives you channel-level LTV and channel-level CAC in a single system.
With this data, you can identify patterns like:
– Google Ads customers have a 4.2:1 LTV:CAC with 6-month payback
– Meta Ads prospecting customers have a 3.1:1 with 4-month payback
– Meta Ads retargeting customers have a 2.0:1 (because the prospecting campaign did the real work)
– YouTube customers have a 5.5:1 with 8-month payback
– Email-acquired customers have a 12:1 with 1-month payback
Each of these ratios points to a different budget action. Without the data to calculate them, you are guessing.
According to a published Hyros case study, Regenalight discovered that $80,000-$100,000 per month in ad spend was going to campaigns producing zero return, effectively infinite CAC on those campaigns, which means a 0:1 ratio. After cutting that waste and reallocating budget based on channel-level economics, the company grew from $1M to $3M per month in revenue.
How Do You Improve the LTV:CAC Ratio?
There are only two ways to improve the ratio: reduce CAC or increase LTV. Everything else is a tactic within one of these two categories.
Reduce CAC
Fix attribution to find hidden winners. Across the ad accounts I’ve seen through Hyros data, 25-45% of winning ads are missed by standard tracking. Finding those ads and scaling them produces more customers from existing spend, directly reducing CAC. Hyros reports that brands see at least a 15% increase in ad revenue on average after implementation. Not from spending more. From spending smarter.
Eliminate verified waste. Use channel-level LTV:CAC data to identify and cut channels where the ratio is below 2:1 with no path to improvement. Reallocate that budget to channels at 4:1+.
Improve conversion rates. Every percentage point of conversion rate improvement reduces CAC proportionally without any additional ad spend. Landing page optimization, offer testing, and sales process improvements directly drive this.
Invest in organic and referral channels. Customers acquired through organic search, content marketing, referrals, and word-of-mouth have near-zero marginal acquisition cost. Every organic customer drags the blended CAC downward. It costs 5-25x more to acquire a new customer than to retain an existing one, making retention and referral the cheapest acquisition channels.
Increase LTV
Increase repeat purchase rate. For ecommerce, email sequences, loyalty programs, and post-purchase nurture campaigns drive incremental purchases. Personalized retention campaigns achieve 3x higher engagement than acquisition campaigns. The difference between a customer who buys twice and a customer who buys five times is a 2.5x multiplier on LTV.
Reduce churn. For subscription businesses, churn reduction directly extends the lifespan in the LTV formula. A 5% improvement in retention drives 25-95% profit increases (Bain & Company). Predictive health scoring can flag at-risk customers 3-6 months before they churn, and proactive intervention saves 25-40% of flagged accounts.
Launch upsell and expansion paths. Adding higher-tier products, complementary services, or usage-based pricing tiers lets existing customers spend more. SaaS companies with Net Revenue Retention above 120% grow from existing customers faster than churn erodes them. Their LTV increases over time instead of decaying.
Improve product quality and customer experience. 93% of customers are likely to repurchase from companies with excellent service. Product improvements that reduce support burden and increase satisfaction compound into higher retention and larger purchase values.
The Attribution-Specific Improvement
Fixing attribution often improves the measured ratio immediately. Not because the business changed. Because the measurement became accurate. A company that discovers its actual CAC is $150 instead of $214 (because it was missing 30% of conversions) sees its ratio jump from 2.0:1 to 3.3:1 overnight. The economics were always healthy. The measurement was wrong.
Tony Robbins’ ad team used Hyros to scale ad spend by 43% on Business Mastery and over 100% on Unleash The Power Within over six months. Those decisions required knowing the true LTV:CAC ratio at the campaign level, not the blended ratio averaged across a portfolio.
For more on how different attribution models distribute credit and affect which channels look profitable, see our guides on first-click vs last-click attribution and multi-touch attribution.
FAQ
What is a good LTV:CAC ratio for ecommerce?
For DTC ecommerce, the typical healthy range is 2.5:1 to 4:1. Luxury ecommerce averages 5.2:1 due to high average order values. Subscription DTC brands often reach 3:1 to 5:1 because recurring revenue increases the lifespan multiplier. The key variable is repeat purchase rate: a brand that gets 4+ repeat purchases per customer can sustain a higher CAC than one that averages 1.5 purchases. Compare your ratio against your payback period: a 2.5:1 ratio with 1-month payback is healthier than a 4:1 ratio with 18-month payback.
What is a good LTV:CAC ratio for SaaS?
Series A SaaS companies average 3:1. Series B and beyond should target 4:1 to 5:1. Enterprise SaaS with strong Net Revenue Retention (NRR above 110%) often reaches 6:1 to 7:1 because existing customers expand their spending over time. B2B SaaS companies should also track CAC payback period alongside the ratio. Target under 12 months for venture-backed companies.
How often should I recalculate the LTV:CAC ratio?
Quarterly for strategic planning. Monthly if you are actively scaling or adjusting spend. The LTV component needs time to stabilize; 12 months of cohort data is the minimum for a reliable estimate. CAC fluctuates more frequently due to seasonal ad costs, campaign launches, and competitive dynamics. Recalculating monthly lets you catch CAC spikes early while the LTV denominator remains relatively stable.
Is a very high LTV:CAC ratio always good?
Not always. A ratio above 8:1 often means you are underinvesting in acquisition. You could afford to spend more to acquire customers and still be profitable. In competitive markets, a competitor with a 3:1 ratio who spends aggressively will capture market share while you optimize for efficiency. The exception is bootstrapped businesses with limited capital. A high ratio means healthy cash flow, which is more important than market share when you cannot raise funds to close the gap.
How does attribution affect the LTV:CAC ratio?
Attribution affects both sides. On the CAC side: platform over-claiming inflates your customer count and makes CAC look low, while tracking gaps shrink your customer count and make CAC look high. On the LTV side: tracking that misses 30% of customers produces a biased sample that may not represent your actual customer base. The compound error can shift the measured ratio by 30-60% from its true value. Independent attribution from platforms like Hyros provides accurate customer counts and full-journey tracking for both sides of the equation.
Can I calculate LTV:CAC by campaign, not just by channel?
Yes, with the right attribution platform. Campaign-level LTV:CAC tells you which specific campaigns produce the most valuable customers, not just which channels. This is more actionable than channel-level analysis because it lets you scale specific winners and cut specific losers within a channel. Hyros tracks customers from the campaign and ad set that acquired them through every subsequent purchase, enabling campaign-level and even creative-level LTV:CAC analysis.
Standalone Summary
The LTV:CAC ratio divides customer lifetime value by customer acquisition cost to measure whether a business model is financially sustainable. The minimum viability threshold is 3:1, meaning each customer generates at least three dollars for every dollar spent to acquire them. Top SaaS companies maintain 4:1 to 6:1. DTC ecommerce typically ranges from 2.5:1 to 4:1. Ratios above 8:1 may indicate underinvestment in growth. The ratio depends on accurate attribution for both inputs: CAC requires an accurate customer count and acquisition source, while LTV requires tracking those customers through every subsequent purchase. Platform-reported conversions sum to 150-250% of actual customers across channels, making platform-sourced CAC numbers unreliable. Blended ratios hide channel-level variation that drives budget decisions. Improving the ratio comes from reducing CAC (fixing attribution, eliminating waste, improving conversion rates) and increasing LTV (driving repeat purchases, reducing churn, launching upsell paths). Hyros provides full-journey tracking from first ad click through every repeat purchase, enabling LTV:CAC analysis at the channel, campaign, and creative level with data verified against actual payment processor records.
Calculate your true LTV:CAC ratio across every channel with Hyros. Book a demo