


Why Your Meta Ads ROAS Is Lying to You
TL;DR
- Pixel undercounts iOS conversions after ATT while view-through over-credits inflates the total
- AEM is a statistical model, not a measurement, hiding modeled data behind clean dashboards
- Server-side UID attribution catches both lies; reported ROAS typically runs 1.5x to 2x real
Meta Ads ROAS is inaccurate because the pixel misses a large share of iOS conversions after Apple’s ATT framework, over-credits view-through events Meta never actually drove, and uses Aggregated Event Measurement (AEM), a statistical model that hides the true number behind clean-looking dashboard math. The lie runs two ways: under-reporting on iOS, over-reporting from view-through inflation. Server-side, UID-based attribution is the only fix that catches both sides. Most accounts I see have a reported ROAS that’s 1.5x to 2x higher than the real one. The fix is measuring revenue against people, not cookies.
How Meta Reports ROAS (And Why It Looks Clean Even When It’s Wrong)
I know what you’re thinking. “My Ads Manager shows 4.2x ROAS. That’s the number.” Because the dashboard hides what’s underneath. I built Hyros because I couldn’t scale my own businesses on platform-reported ROAS. Every time I trusted the number, I ended up killing winners and pouring money into losers.
Meta’s ROAS comes from three layers stacked together. The browser pixel, the Conversions API (CAPI), and Aggregated Event Measurement. The pixel fires when a customer hits your site. CAPI sends server-side events from your backend to Meta. AEM is a statistical model Meta uses to fill gaps where the pixel and CAPI can’t see. Meta blends all of that into one ROAS number and ships it to your dashboard.
That blending is the problem. It looks like measured data. A lot of it isn’t. AEM is statistical estimation, and Meta says so in their own help docs. You’re seeing a mix of observed conversions and modeled guesses, presented as if they’re equally trustworthy. They aren’t.
For the full breakdown, see Meta Ads Reporting and Attribution Accuracy.
Lie #1: Under-Reporting from iOS 14.5 + ATT
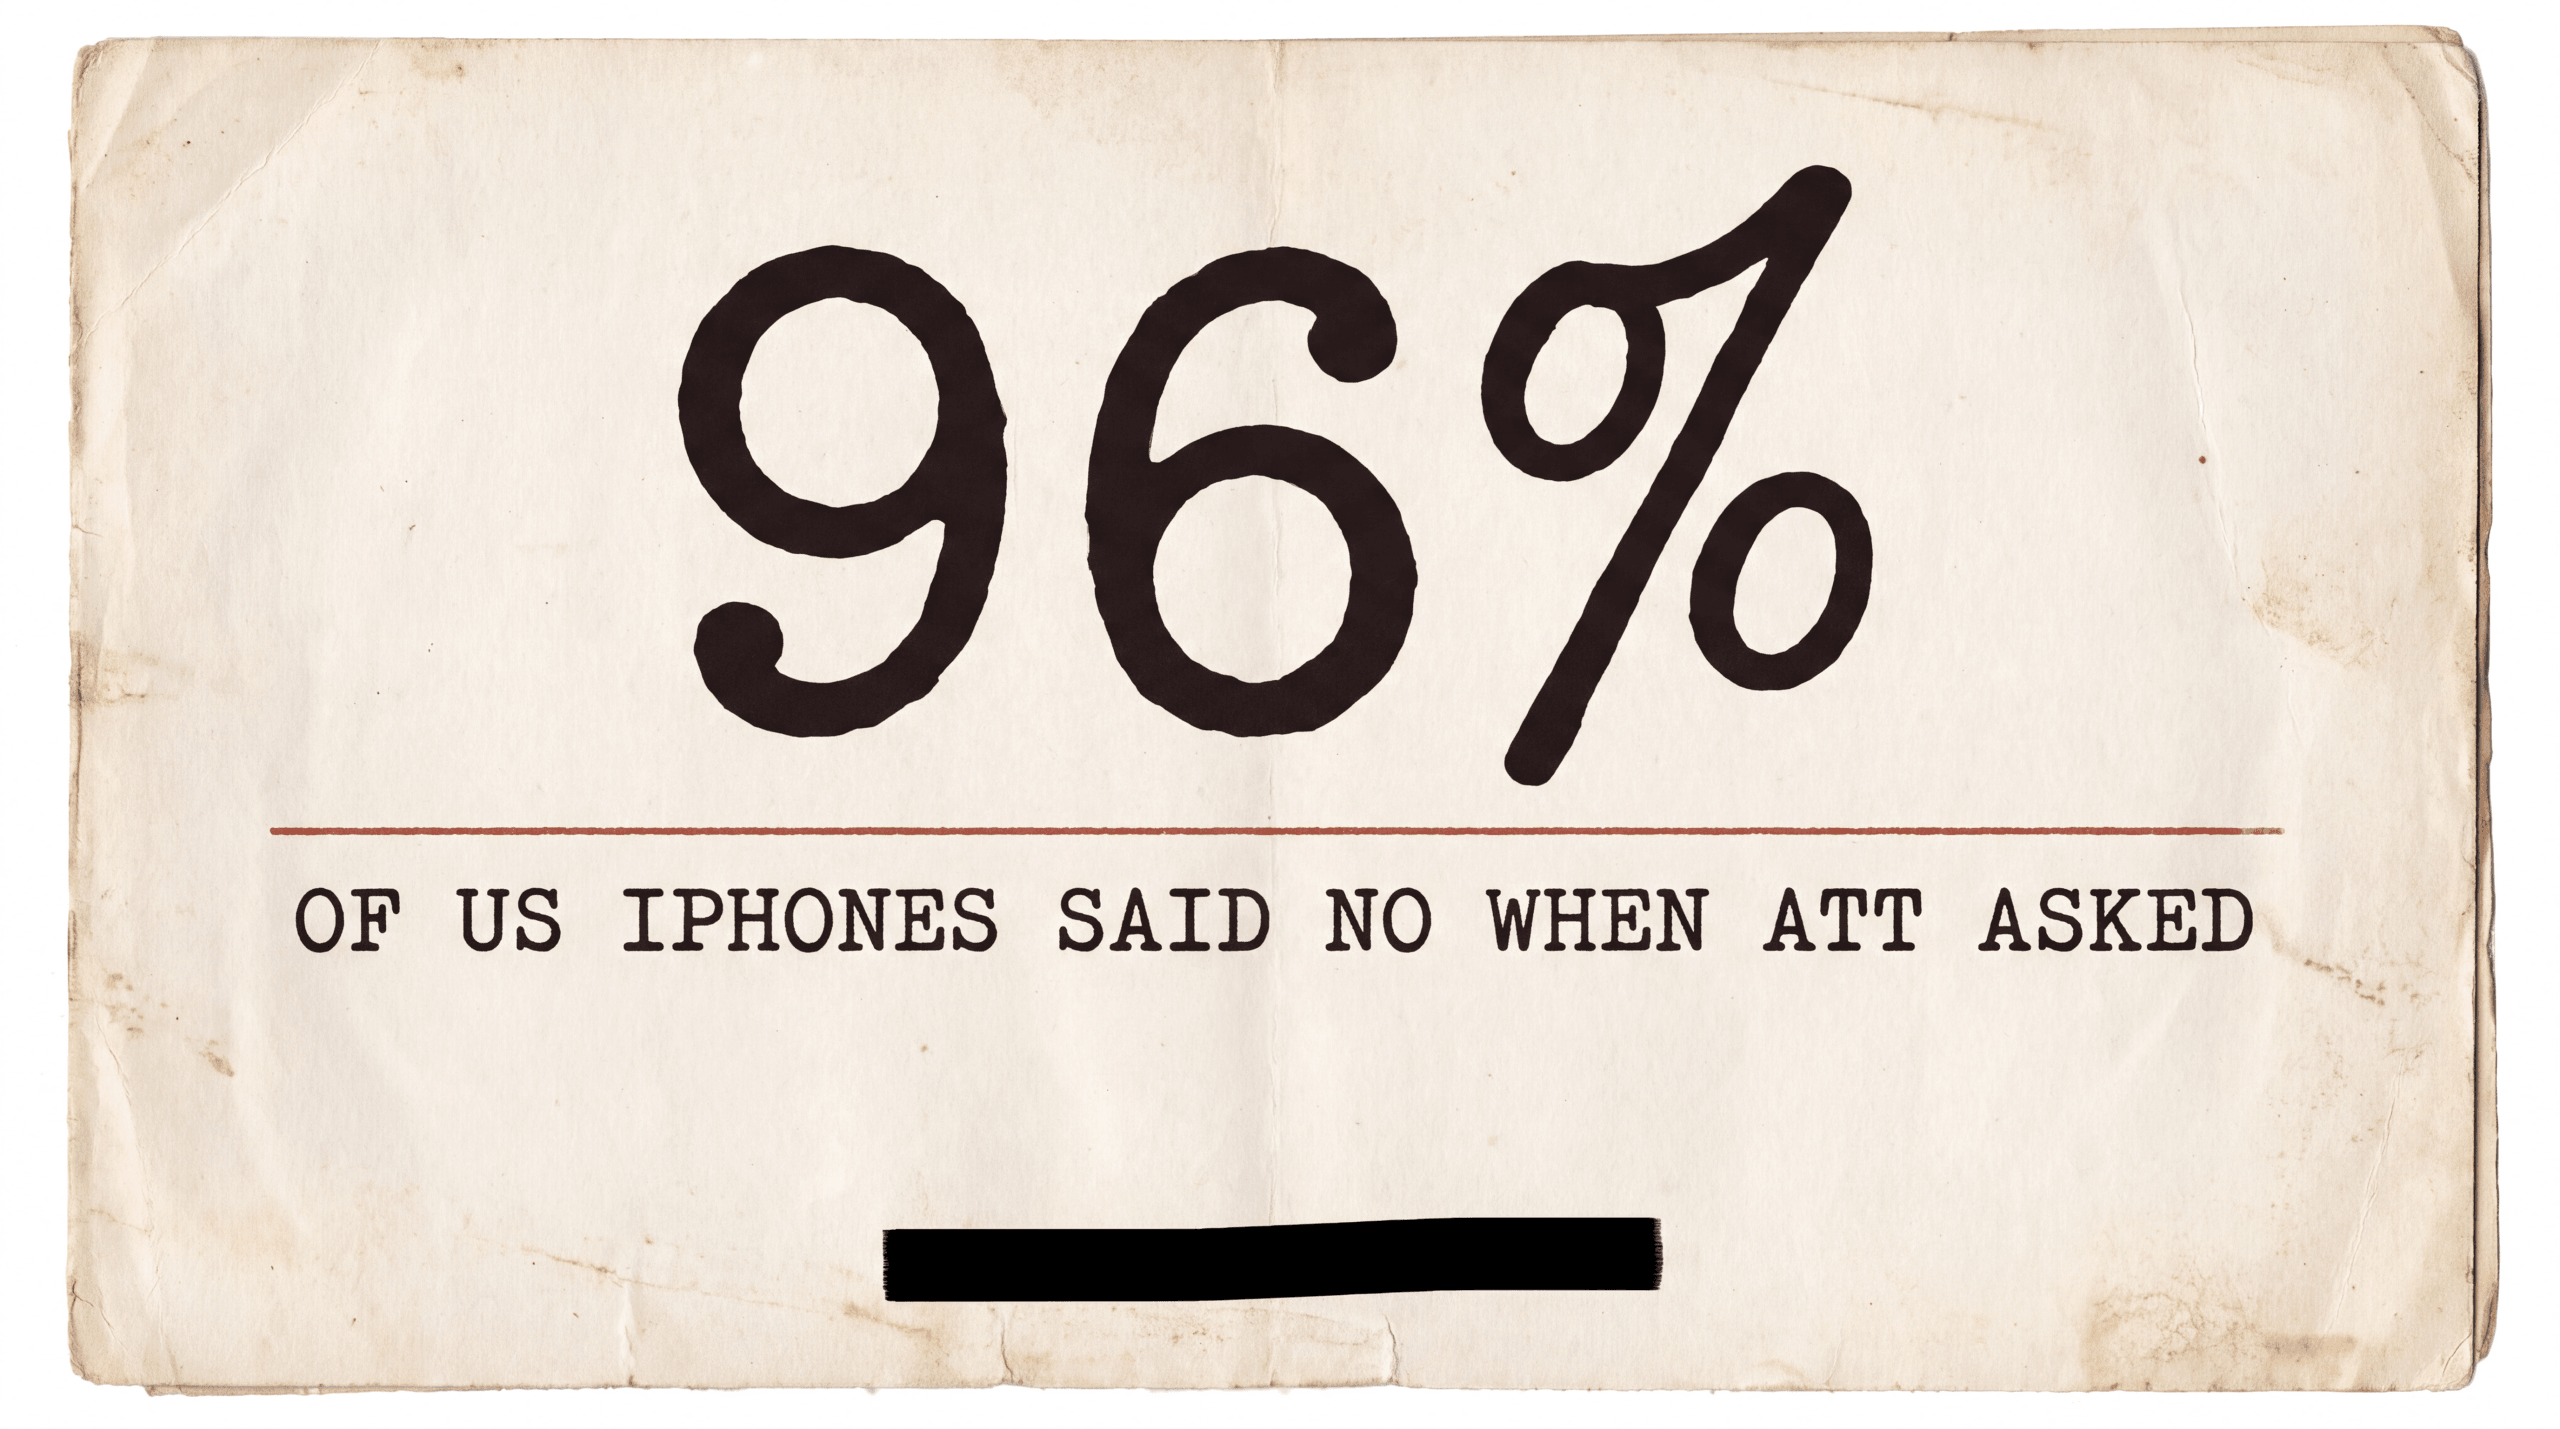
Most people know iOS 14.5 hurt Facebook ads. They don’t know how badly, or how much of that damage is still active in 2026. Apple shipped ATT in April 2021. The framework forced apps to ask permission before accessing the IDFA, the unique device identifier Meta used to thread conversions back to ads. Roughly 96% of US iPhone users initially opted out (Flurry Analytics, 2021), and opt-in has climbed only to approximately 35-37% as of 2025 (Adjust Q2 2025).
Five years in, two-thirds of iPhone users still say no. The pixel cannot fire reliably on the majority of iOS conversions. Meta projected approximately $10 billion in 2022 ad revenue loss from iOS ATT changes (Meta Q4 2021 earnings call, February 2022, CFO David Wehner).
What does that mean for your dashboard? Meta fills the iOS gap with modeled estimates. Based on Hyros customer audits we’ve seen, the iOS undercount in raw pixel data runs roughly 40-60% of true conversions before modeling kicks in. Modeling closes some. Not all. The modeling itself introduces noise that propagates into your ad-set-level reporting. You think you’re scaling a winning audience. You’re actually scaling a sample-size artifact.
For the full mechanics, see How iOS 14.5 Changed Ad Attribution Forever.
Lie #2: Over-Reporting from View-Through Conversions
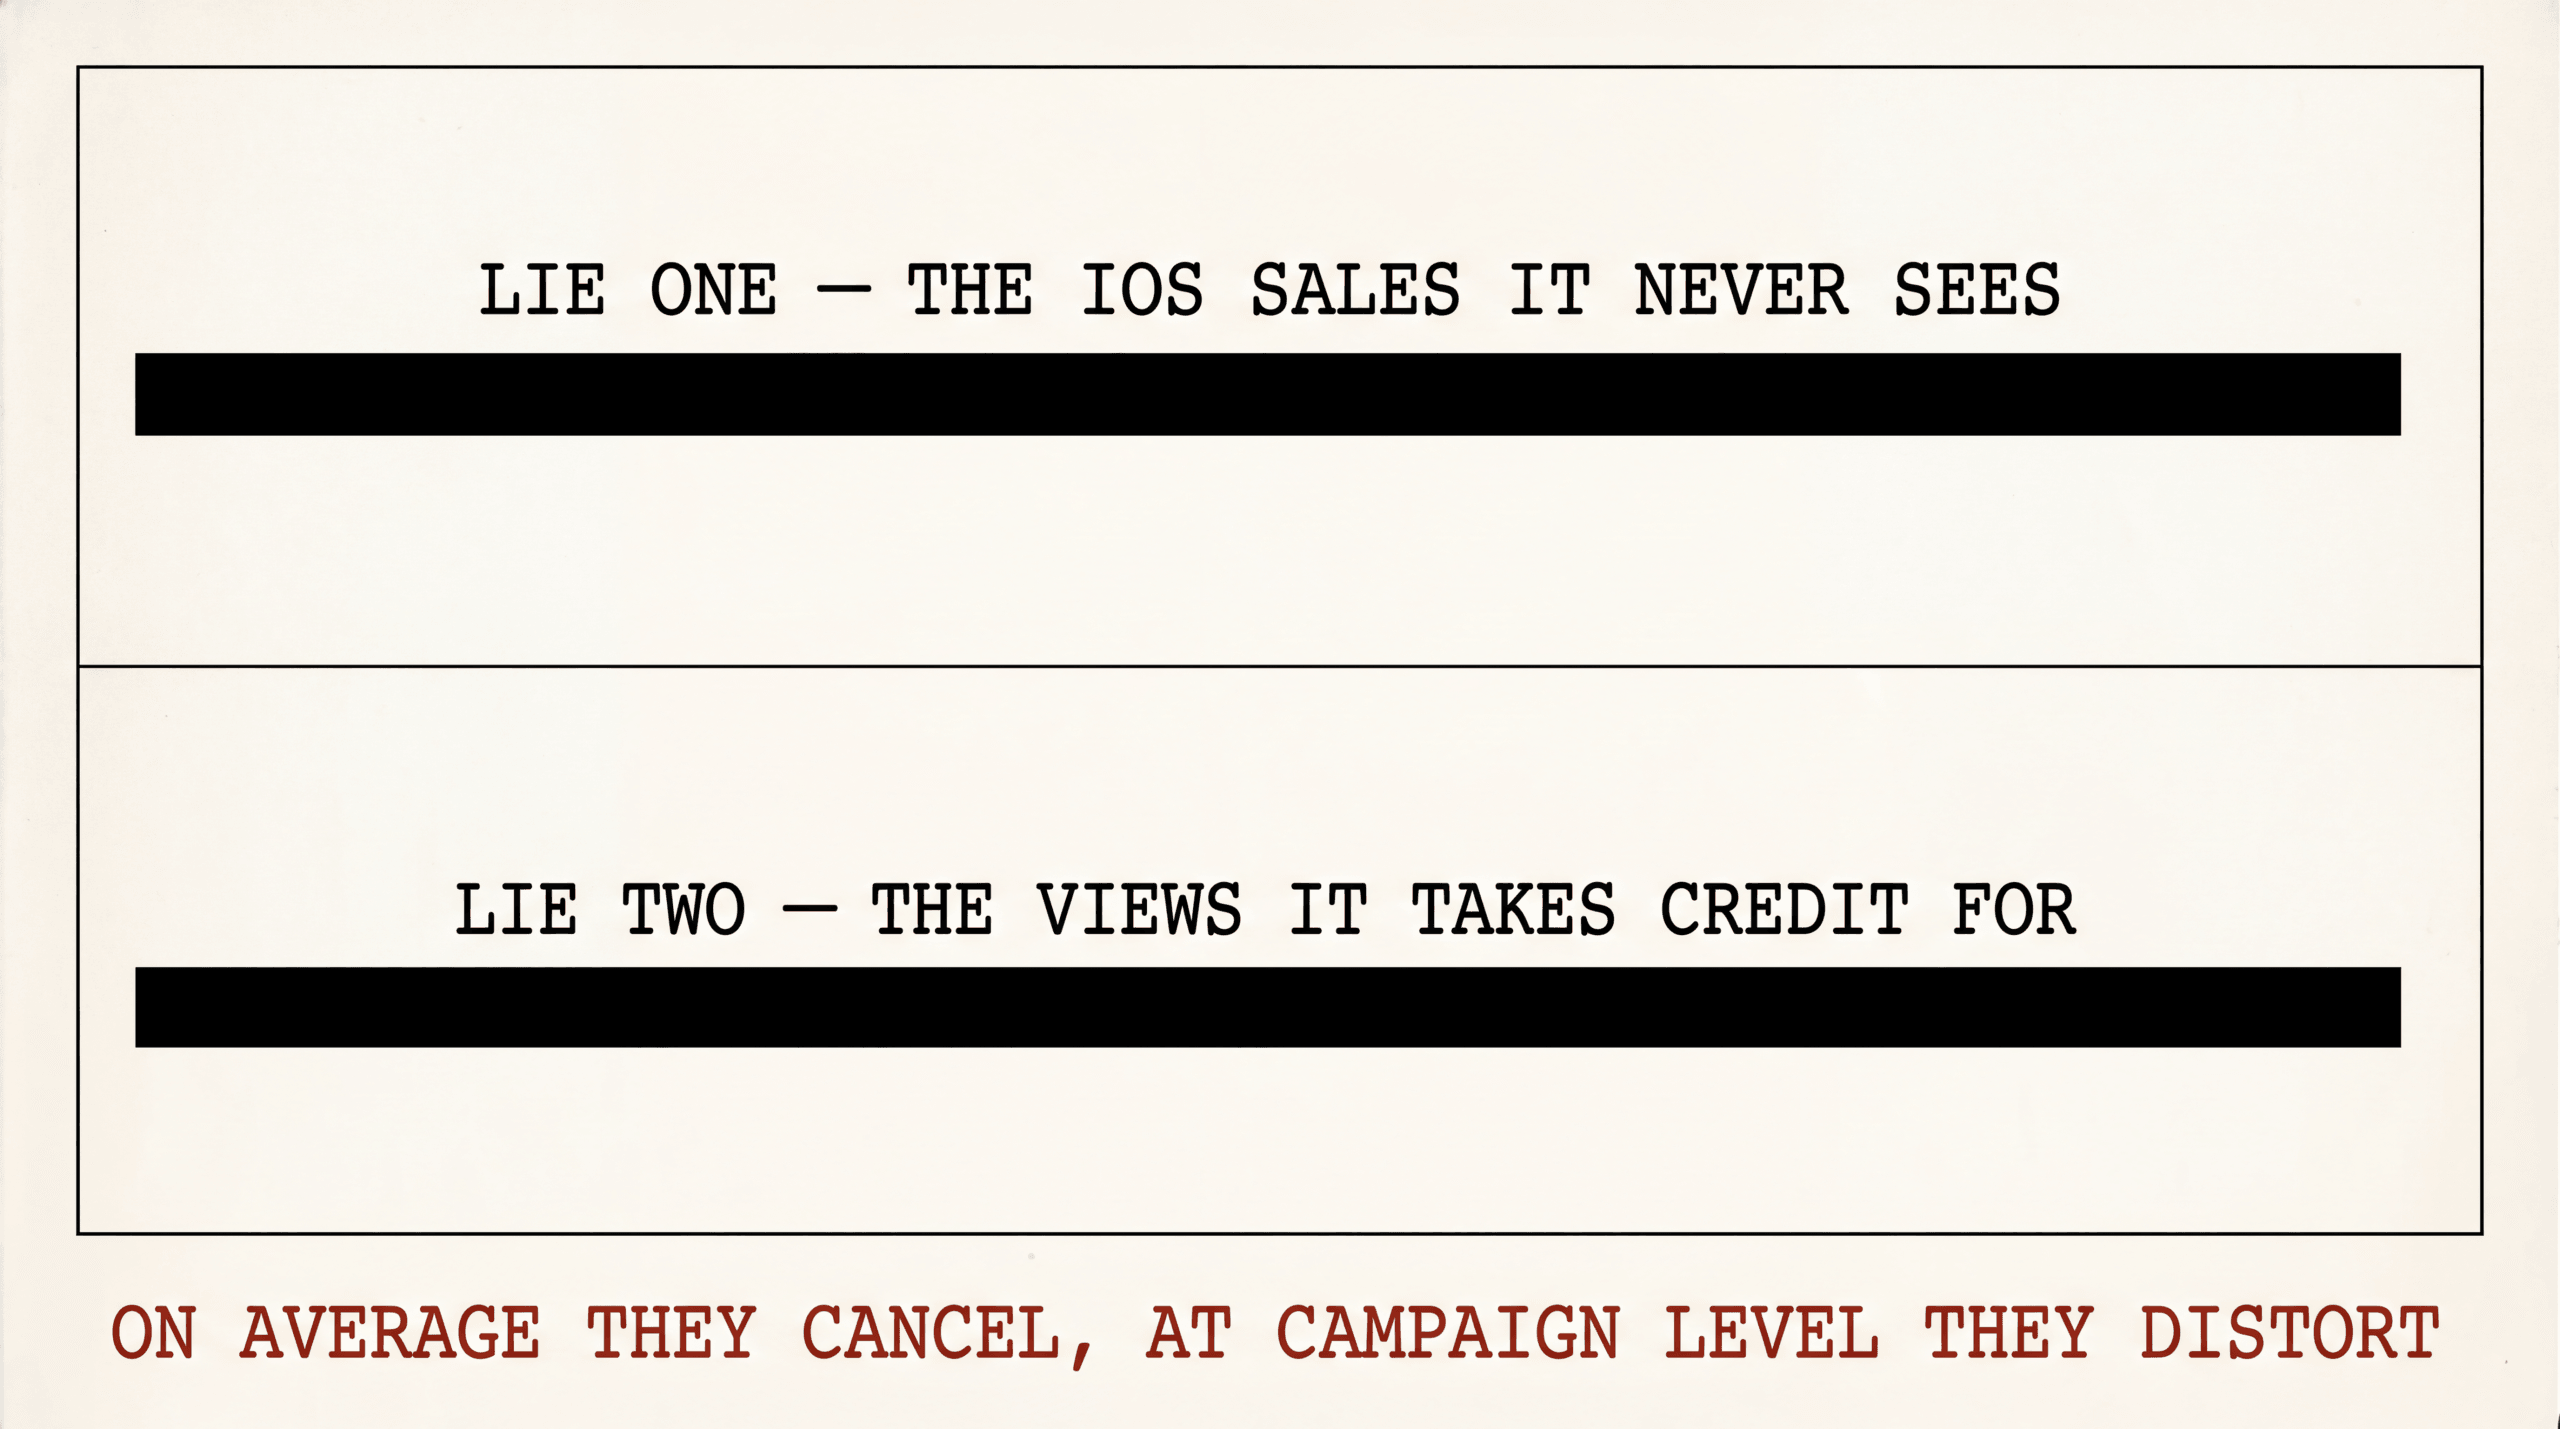
The second lie runs in the opposite direction. Meta’s default attribution window is 7-day click, 1-day view. That 1-day view is where things get crooked. A view-through means someone saw your ad (didn’t click), then bought on your site within 24 hours. Meta claims the sale.
This is where the inflation lives. Based on Hyros customer audits we’ve seen, view-through can account for a meaningful chunk of total reported conversions in info-product and DTC accounts, often well over half of the apparent volume. Most would have happened without the impression. The customer was already going to buy.
So you have two lies stacked. iOS undercount pulls the number down. View-through over-credit pushes it up. The AVERAGE ROAS looks plausible because they cancel across the account. At campaign and ad-set level, they don’t cancel. They distort. You cut a profitable campaign because undercount made it look bad, while keeping a losing campaign because view-through inflated it.
Picture this. Campaign A spends $10,000, drives $30,000 in real revenue, but Meta only sees $18,000 because most buyers were iOS opt-outs. Reported ROAS: 1.8x. You cut it. Campaign B spends $10,000, drives $12,000 in real revenue, gets another $20,000 credited in view-through from people who would have bought anyway. Reported ROAS: 3.2x. You scale it. You just cut a 3x and doubled down on a 1.2x.
Lie #3: Aggregated Event Measurement Is a Model, Not a Measurement
Aggregated Event Measurement is Meta’s privacy-first measurement layer for web events. The headline constraint is the event cap, originally introduced as 8 prioritized events per domain. Meta has rolled out per-domain limits in different phases since launch, so the exact current cap should be confirmed against Meta’s AEM help docs.
What matters more than the cap is the architecture. AEM uses statistical modeling to estimate conversions for users whose activity can’t be directly observed. Meta’s own help documentation acknowledges this. Dashboard numbers are partly observed, partly inferred. No toggle shows the split. No confidence interval is displayed. The UI shows “$42.17 CPA, 3.8x ROAS” with the same precision whether the data is rock-solid or mostly fabricated by a model.
Looking at hundreds of Hyros customer accounts side by side with platform numbers, the variance wasn’t random. It was systematically biased against the marketer. Smaller iOS traffic got worse modeling. Longer cycles got cut off at the 7-day window. View-through-heavy delivery got inflated. Every structural bias pushed marketers toward worse decisions.
For more on the CAPI half of this stack, see Meta Conversions API.
The 7-Day Click Window Is Structurally Broken for High-Consideration Funnels
The rest of the SERP refuses to cover this. The 7-day click window is a disaster for any funnel where the buyer takes longer than a week to convert. Info-product launches. Coaching programs. High-ticket DTC (mattresses, furniture, premium supplements). B2B SaaS. Anything over $500 AOV with a real consideration loop.
Most of my own businesses had purchase cycles between 14 and 30 days. When the buyer cycle is three or four times longer than the attribution window, the window doesn’t measure anything useful. The first ad click and the actual purchase are too far apart for Meta to connect them. Either the conversion gets credited to whatever ad happened to be in the 7-day window when they finally bought (last-click bias), or to nothing at all (dark funnel).
For these businesses, the 7-day window isn’t slightly inaccurate. It’s structurally incapable of capturing the truth. Most SERP-leading articles target generic e-commerce. The high-consideration funnel is the blind spot.
A Real Hyros Customer Audit: Reported 4.2x ROAS, Actual 2.1x
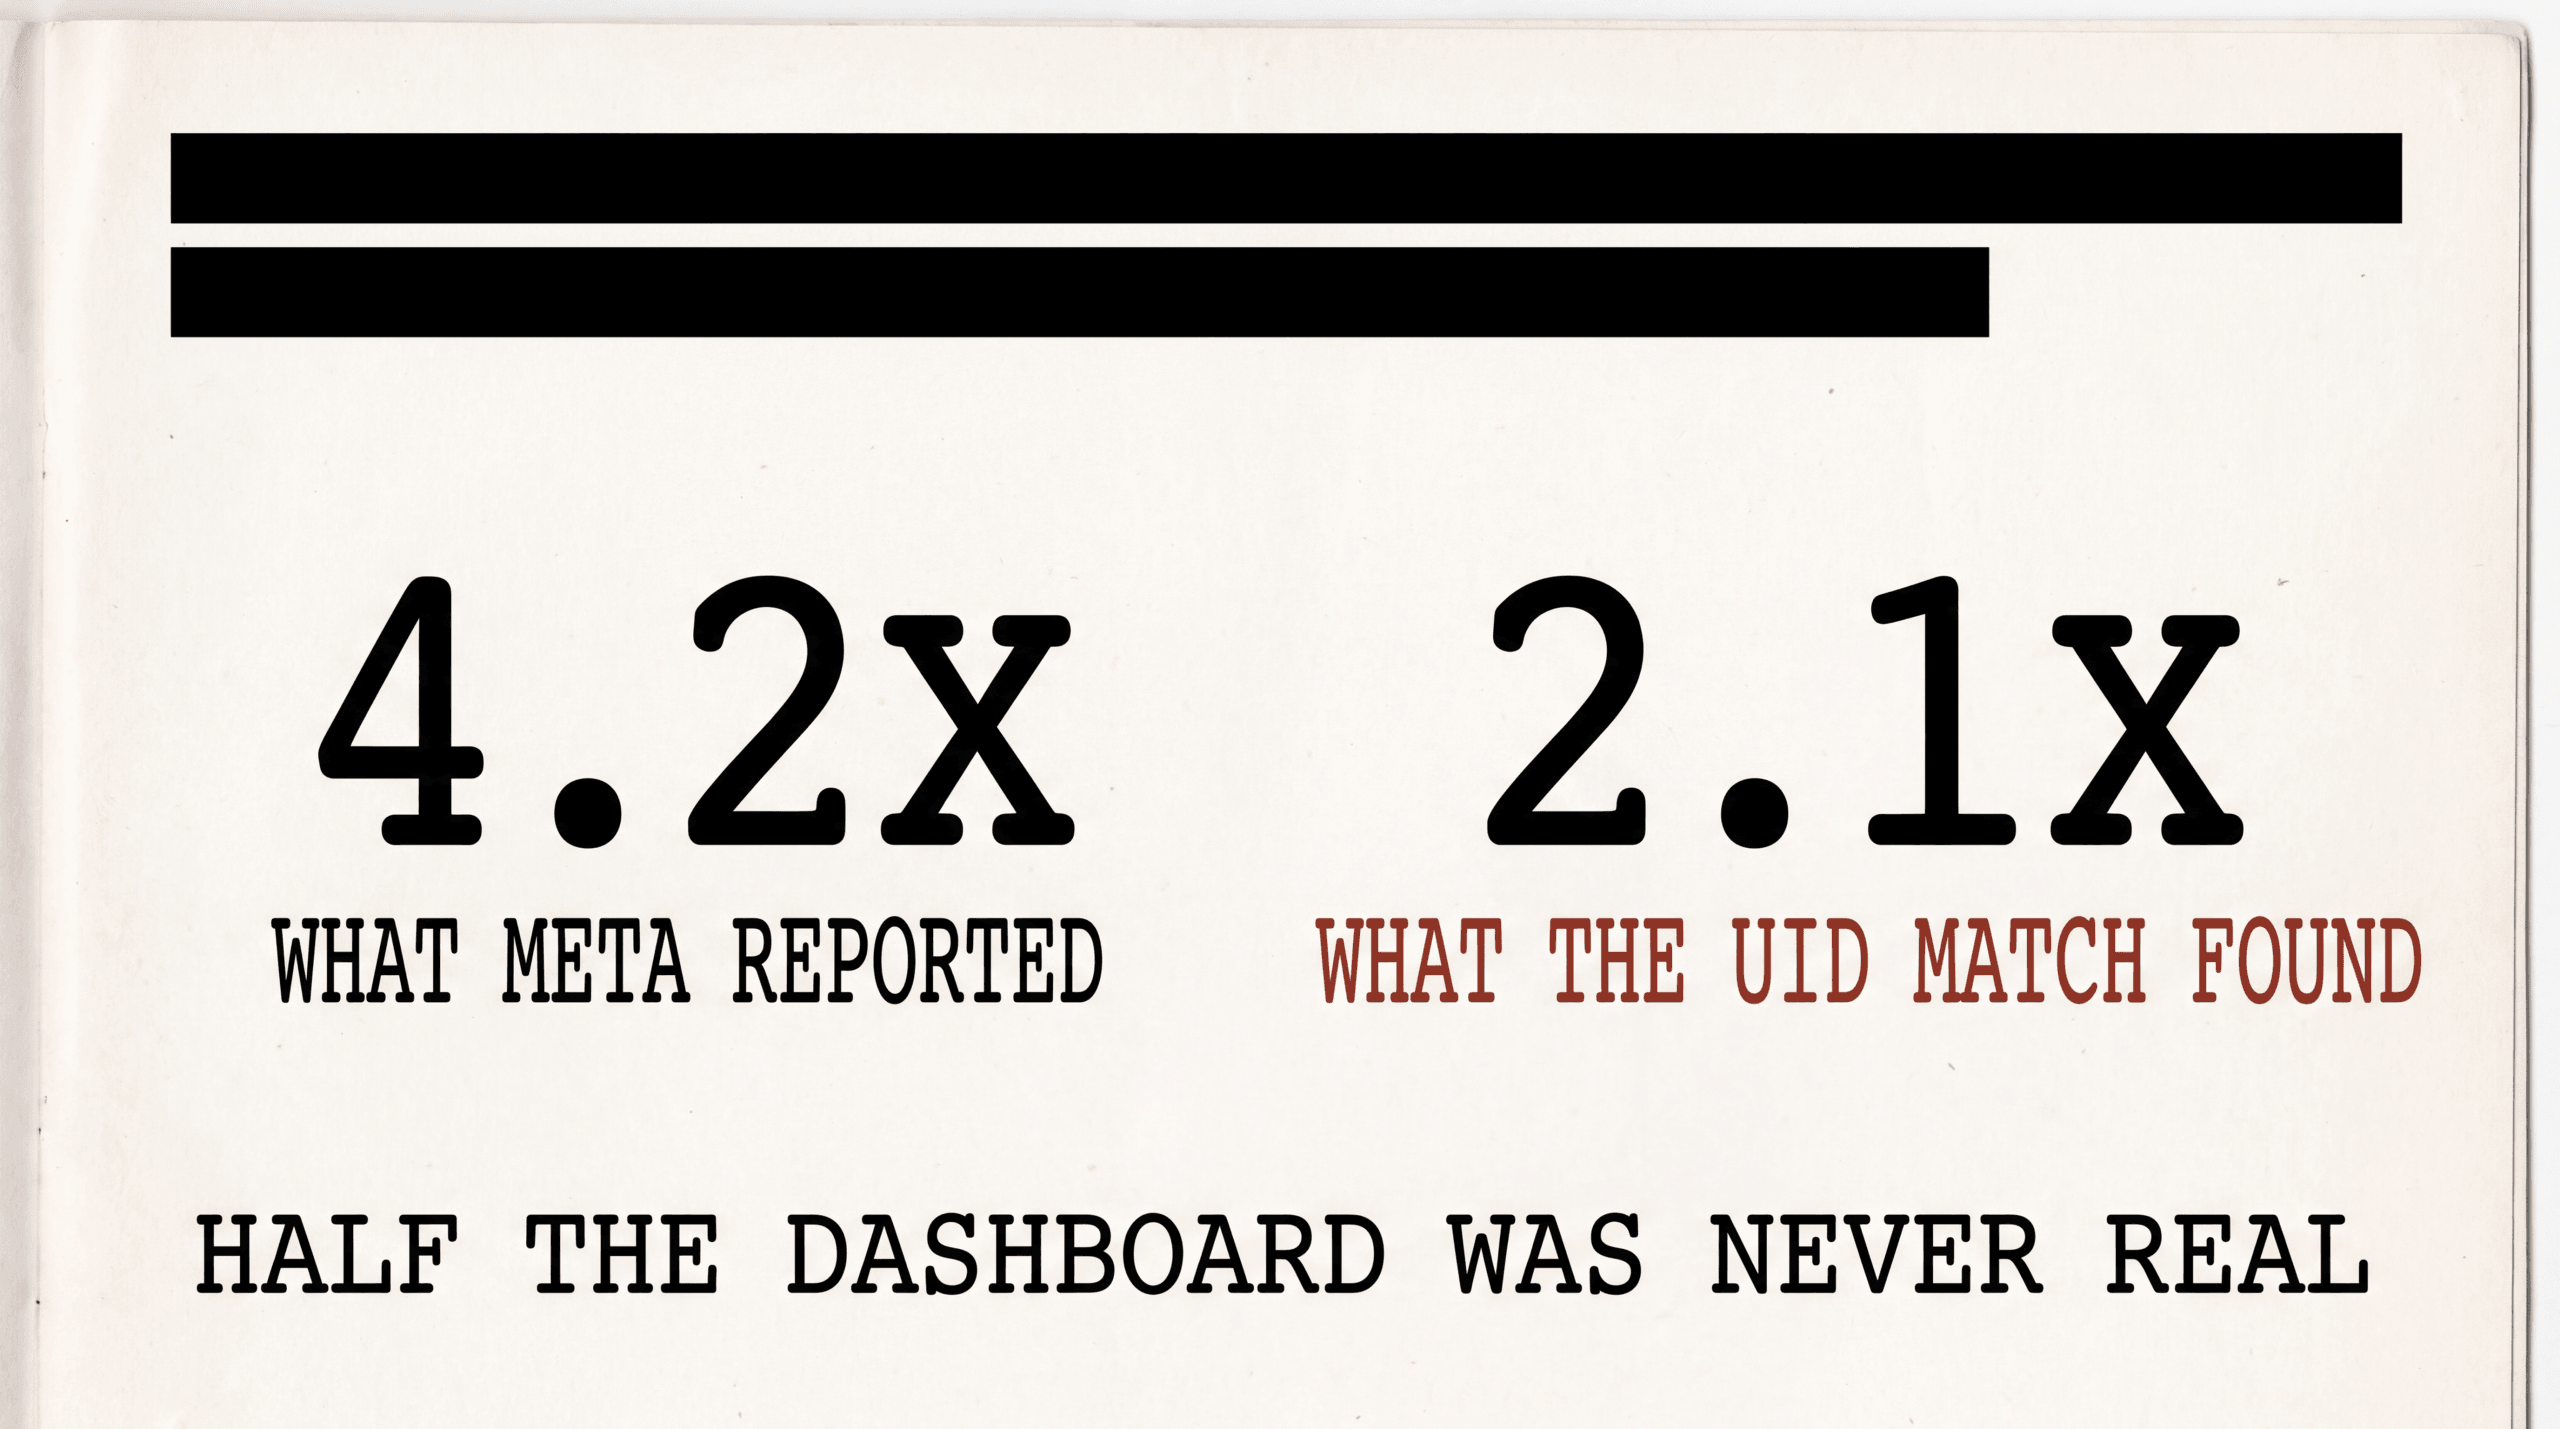
A reconciliation pattern we’ve seen across Hyros audits. Specifics anonymized.
The account: a DTC supplement brand running Meta and Google. Roughly $200,000/month in Meta spend. Meta-reported ROAS: 4.2x. Meta-reported revenue: $840,000.
The account was opted into Hyros, so every checkout was matched server-side to its original click source using a hashed email. When we pulled the actual revenue Meta drove, we got $420,000. That’s 2.1x ROAS. Half of what the dashboard claimed.
Where did the other $420,000 go?
Roughly $150,000 was view-through credit Meta took for sales from email, organic search, and direct traffic.
Roughly $180,000 was double-counted with Google. Without independent attribution, the account looked like $1.3M from $300K in combined spend. Actual was around $700K.
Roughly $90,000 was modeled-conversion inflation in AEM. No observable event, no view-through, just Meta’s statistical estimate.
Hyros tracks $3.5 billion+ in revenue across 4,000+ customers. This pattern shows up in the majority of accounts we audit.
For the math behind ROAS, see How to Calculate ROAS.
Why CAPI Alone Doesn’t Fix It
Meta’s Conversions API is the recommended fix, and it’s a real improvement. CAPI sends events server-side from your backend to Meta, bypassing the browser. Meta itself reports that advertisers with a Conversions API setup for web events saw an average 17.8% lower cost per result compared to those without (Meta, April 2026).
But CAPI is a half-solution. CAPI restores events. It doesn’t restore independence. The events still flow into Meta’s measurement system, which still uses Meta’s modeling, Meta’s attribution window, and still credits Meta’s own ads for view-throughs the same way it always has. You’ve handed Meta cleaner data to do the same biased math with.
CAPI fixes the iOS undercount partially. It cannot fix the view-through over-credit because that’s a measurement-philosophy problem, not a data-loss problem. Meta wants to claim credit for view-throughs because it makes Meta look like a better channel than it actually is. CAPI also does nothing about double-counting with Google. The only way to catch that is to measure outside the platforms entirely.
The Fix: Server-Side, UID-Based Attribution
The architecture that fixes both lies at once is server-side attribution built on UID matching.
Every customer who interacts with your business gets a stable identifier. Usually their email, sometimes phone, sometimes a fingerprint of device, IP, and user-agent signals layered together. When that customer clicks a Meta ad, the click gets logged against the UID. When they enter their email on your opt-in, the UID gets enriched. When they purchase three weeks later from a different device, the purchase gets matched to the same UID via the email hash. Every touchpoint, across every device and any window, gets connected to the same person.
This architecture beats the pixel for three reasons.
First, no IDFA or cross-app tracking, so iOS ATT can’t break it. Email is first-party data. Apple has no authority over it.
Second, it runs its own attribution logic. You can choose first-click, last-click, time-decay, or any custom model. You can pick a 30-day or 60-day window for high-consideration funnels. You’re no longer stuck with Meta’s 7-day click choice.
Third, it sees what every platform is doing at the same time, so it catches double-counting. When Meta claims a sale and Google also claims it, the UID-based system sees the actual click sequence and assigns credit honestly. Independent reviews of Hyros consistently report 29-33% more conversions versus native platform reporting (CheckThat.ai review, 601 Trustpilot reviews aggregated).
For the foundational architecture, see Server-Side Tracking Guide.
How to Audit Your Own Meta ROAS This Week
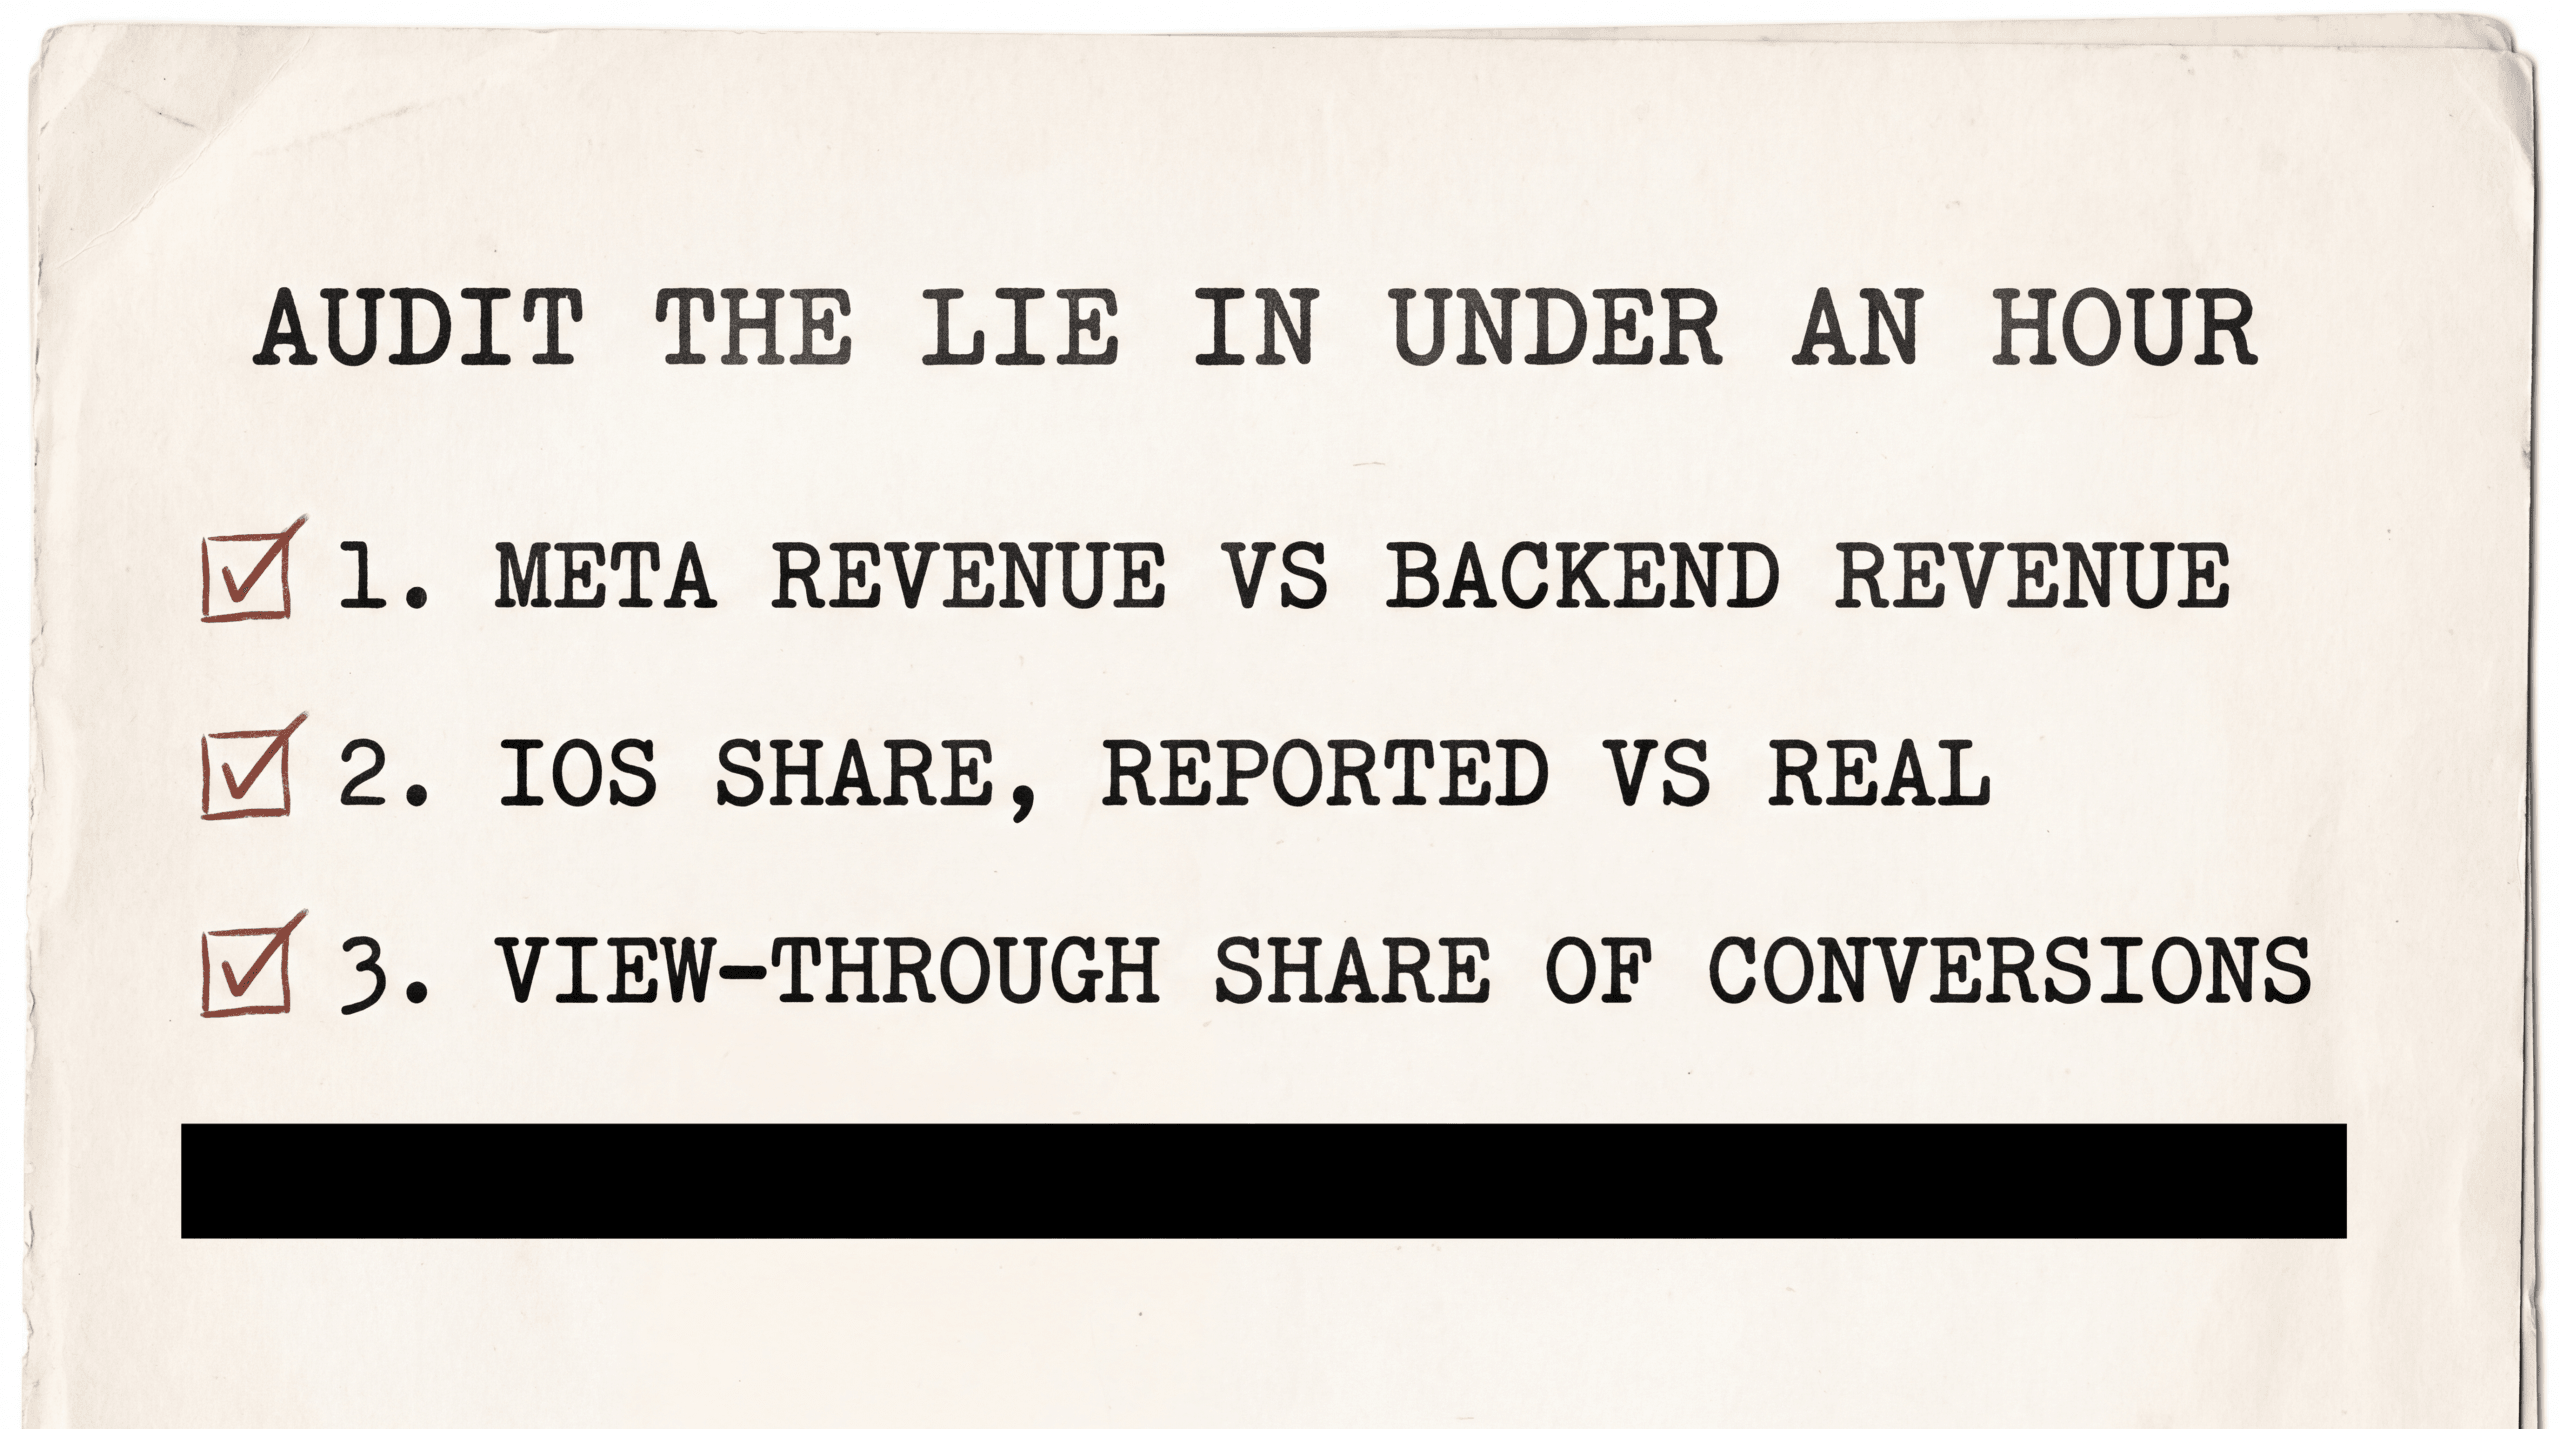
You don’t need to buy anything to find out if Meta is lying. Run this audit yourself in under an hour.
Step 1: Compare Meta-Reported Revenue to Source-of-Truth Revenue
Pull the last 30 days of “Purchase value” from Meta Ads Manager. Pull total revenue from Shopify or Stripe for the same period. The Meta number should not exceed your backend revenue. If Meta’s reported revenue is more than 60-70% of your total across all channels, that’s a red flag. No DTC brand running ads on multiple platforms gets 70% of revenue from Meta alone. View-through over-credit and double-counting are puffing the number.
Step 2: Segment by iOS vs Android
Break out reported conversions in Meta by platform. Do the same on your backend (most checkout systems capture this). The iOS share of reported conversions in Meta should roughly match the iOS share of your real customer base. If Meta shows 25% iOS and your actual base is 55% iOS, you’ve quantified the undercount. The missing iOS conversions are where your real winners are hiding.
Step 3: Check View-Through % of Total Reported Conversions
Change the attribution comparison setting to show click-only and click+view side by side. Calculate the view-through share. If view-through is more than 30-40% of your total reported conversions, you’re sitting on probable over-credit. Pull a week of view-through customers and check whether they were already on your email list or had visited organically in the prior 30 days. If most had, those are sales Meta took credit for that you would have gotten anyway.
Run those three steps and you’ll know within an hour whether your reported ROAS is plausible or fantasy.
FAQ
Why is my Meta ROAS so different from my Shopify revenue?
Three reasons stack. Meta’s pixel misses a large share of iOS conversions because ATT blocks cross-app tracking. Meta’s default 1-day view-through window credits Meta for sales it didn’t actually drive. Both Meta and Google often claim the same sales, so when you add up reported revenue from both, the total exceeds your real revenue. The fix is server-side, UID-based attribution that measures what each platform actually contributed, independent of the platforms’ own reports.
Does CAPI fix Meta ROAS inaccuracy?
Partially. CAPI restores some of the event data the pixel loses after iOS 14.5, and Meta reports CAPI setups see an average 17.8% lower cost per result. But CAPI sends events into Meta’s own measurement system, which still uses Meta’s attribution window and still over-credits view-throughs. CAPI is a real improvement, but the whole fix requires independent measurement.
What is Aggregated Event Measurement and why does it matter?
AEM is Meta’s privacy-first measurement layer that uses statistical modeling to estimate conversions Meta can’t directly observe. Meta’s help documentation acknowledges that some dashboard numbers are modeled instead of measured. When you see “3.8x ROAS” you can’t tell how much is observed and how much is algorithmic guess. For accounts with smaller iOS traffic or longer purchase cycles, the modeled share is higher and the noise is worse.
Is server-side tracking accurate enough to replace platform reporting?
The point is reconciliation, not replacement. Server-side UID-based attribution gives you an independent view of which platform drove which sales. In Hyros customer audits, the gap typically runs 29-33% across the account (CheckThat.ai review, 2026), and at the campaign level the variance is much higher. For the full vertical-by-vertical ranges these audits produce, see the 2026 attribution benchmarks. Platform reporting is still useful for real-time optimization signal. It just shouldn’t be your sole source of truth for budget allocation.
Why is the 7-day click window such a problem for info products?
Because info-product and coaching purchase cycles routinely run 14 to 30 days. When the buyer takes three or four times longer than the attribution window, the window can’t connect the ad click to the eventual sale. The sale gets credited to whatever ad was in the 7-day window when they finally bought (last-click bias) or to nothing at all (dark funnel). You need a longer attribution window and a UID-based system that connects clicks to sales across the whole consideration cycle.
Standalone Summary
Meta Ads ROAS is inaccurate in two opposite directions at once. The pixel misses a substantial share of iOS conversions because Apple’s ATT framework caused roughly 96% of US iPhone users to opt out initially (Flurry Analytics, 2021), with opt-in only at approximately 35-37% as of 2025 (Adjust Q2 2025). Meta projected approximately $10 billion in 2022 ad revenue loss from these changes. On the other side, Meta over-credits view-through conversions and uses Aggregated Event Measurement, a statistical model. CAPI improves the iOS-side data loss (17.8% lower cost per result per Meta, April 2026) but doesn’t fix view-through inflation, double-counting, or the biased 7-day attribution window. Server-side, UID-based attribution catches both lies at once. Independent reviews of Hyros report 29-33% more conversions surfaced versus native platform reporting (CheckThat.ai, 2026). Across 4,000+ Hyros customers tracking $3.5 billion+ in revenue, reported ROAS runs 1.5x-2x higher than UID-tracked ROAS often enough that any advertiser can audit it in under an hour.
Stop trusting a number that’s lying to you in two directions at once. See what each platform actually drove → Book a demo
Related in This Series
Silo: Channel-Specific Attribution
- Meta Ads Reporting and Attribution Accuracy
- Meta Conversions API: Implementation and Benefits
- How iOS 14.5 Changed Ad Attribution Forever
- How to Calculate ROAS
Also explore: