

Hyros 2026 Attribution Benchmarks: First-Party Customer Data
TL;DR
- Figures come from Hyros customer-account audits and in-product reconciliation across five direct-response verticals
- Native ad-platform reporting under-counts revenue; CheckThat.ai puts the median gap at 29 to 33 percent
- Gap widest in high-ticket coaching (45-90 days) and PLG enterprise SaaS (60-90+ day cycles)
- Page exists as the canonical URL for reused operational figures across Hyros content
Hyros has audited the attribution stacks of customer accounts across every major direct-response vertical, and the figures below come from those audit logs and from in-product reconciliation between platform-reported revenue and Hyros UID-stitched revenue on the same accounts during the same windows. Across every vertical we audit, native ad-platform reporting under-counts ad-driven revenue by an observed range, and CheckThat.ai’s third-party measurement of the Hyros tracking gap puts the cross-account median in the 29 to 33 percent band. The gap is widest in high-ticket coaching (45 to 90 day cycles) and PLG enterprise SaaS (60 to 90+ day trial-to-paid windows). It is narrowest in self-serve PLG SaaS (~14 day cycles) and direct-response ecommerce with one-session purchases. This page exists so other Hyros content (and outside writers citing our work) can point to a single canonical URL for the most-reused operational figures, instead of hedging.
Why We Published This Page
I built Hyros because I could not scale my own ad accounts on what the platforms were reporting. Every coaching, SaaS, and agency account I audited told the same story. The platform dashboard said one number. The bank statement said another. We have spent years quantifying that gap inside customer accounts.
For a long time we did not publish the operational ranges. They live in customer audit reports, support tickets, sales calls, and the heads of the team. That created a problem in our own content. Writers covering coaching attribution, SaaS attribution, or agency reporting kept needing to cite ranges we had seen across customer accounts. The honest framing was “Hyros-observed,” which is accurate but leaves a reader without a specific reference.
This page is that reference. Numbers here come from Hyros customer audits, not from third-party industry surveys. Where a third party has independently validated a number (CheckThat.ai’s 29-33 percent tracking-gap study is the main example), I name them. Everything else is first-party observational data, with the methodology described below so readers can decide how to weight it.
How to Read These Ranges
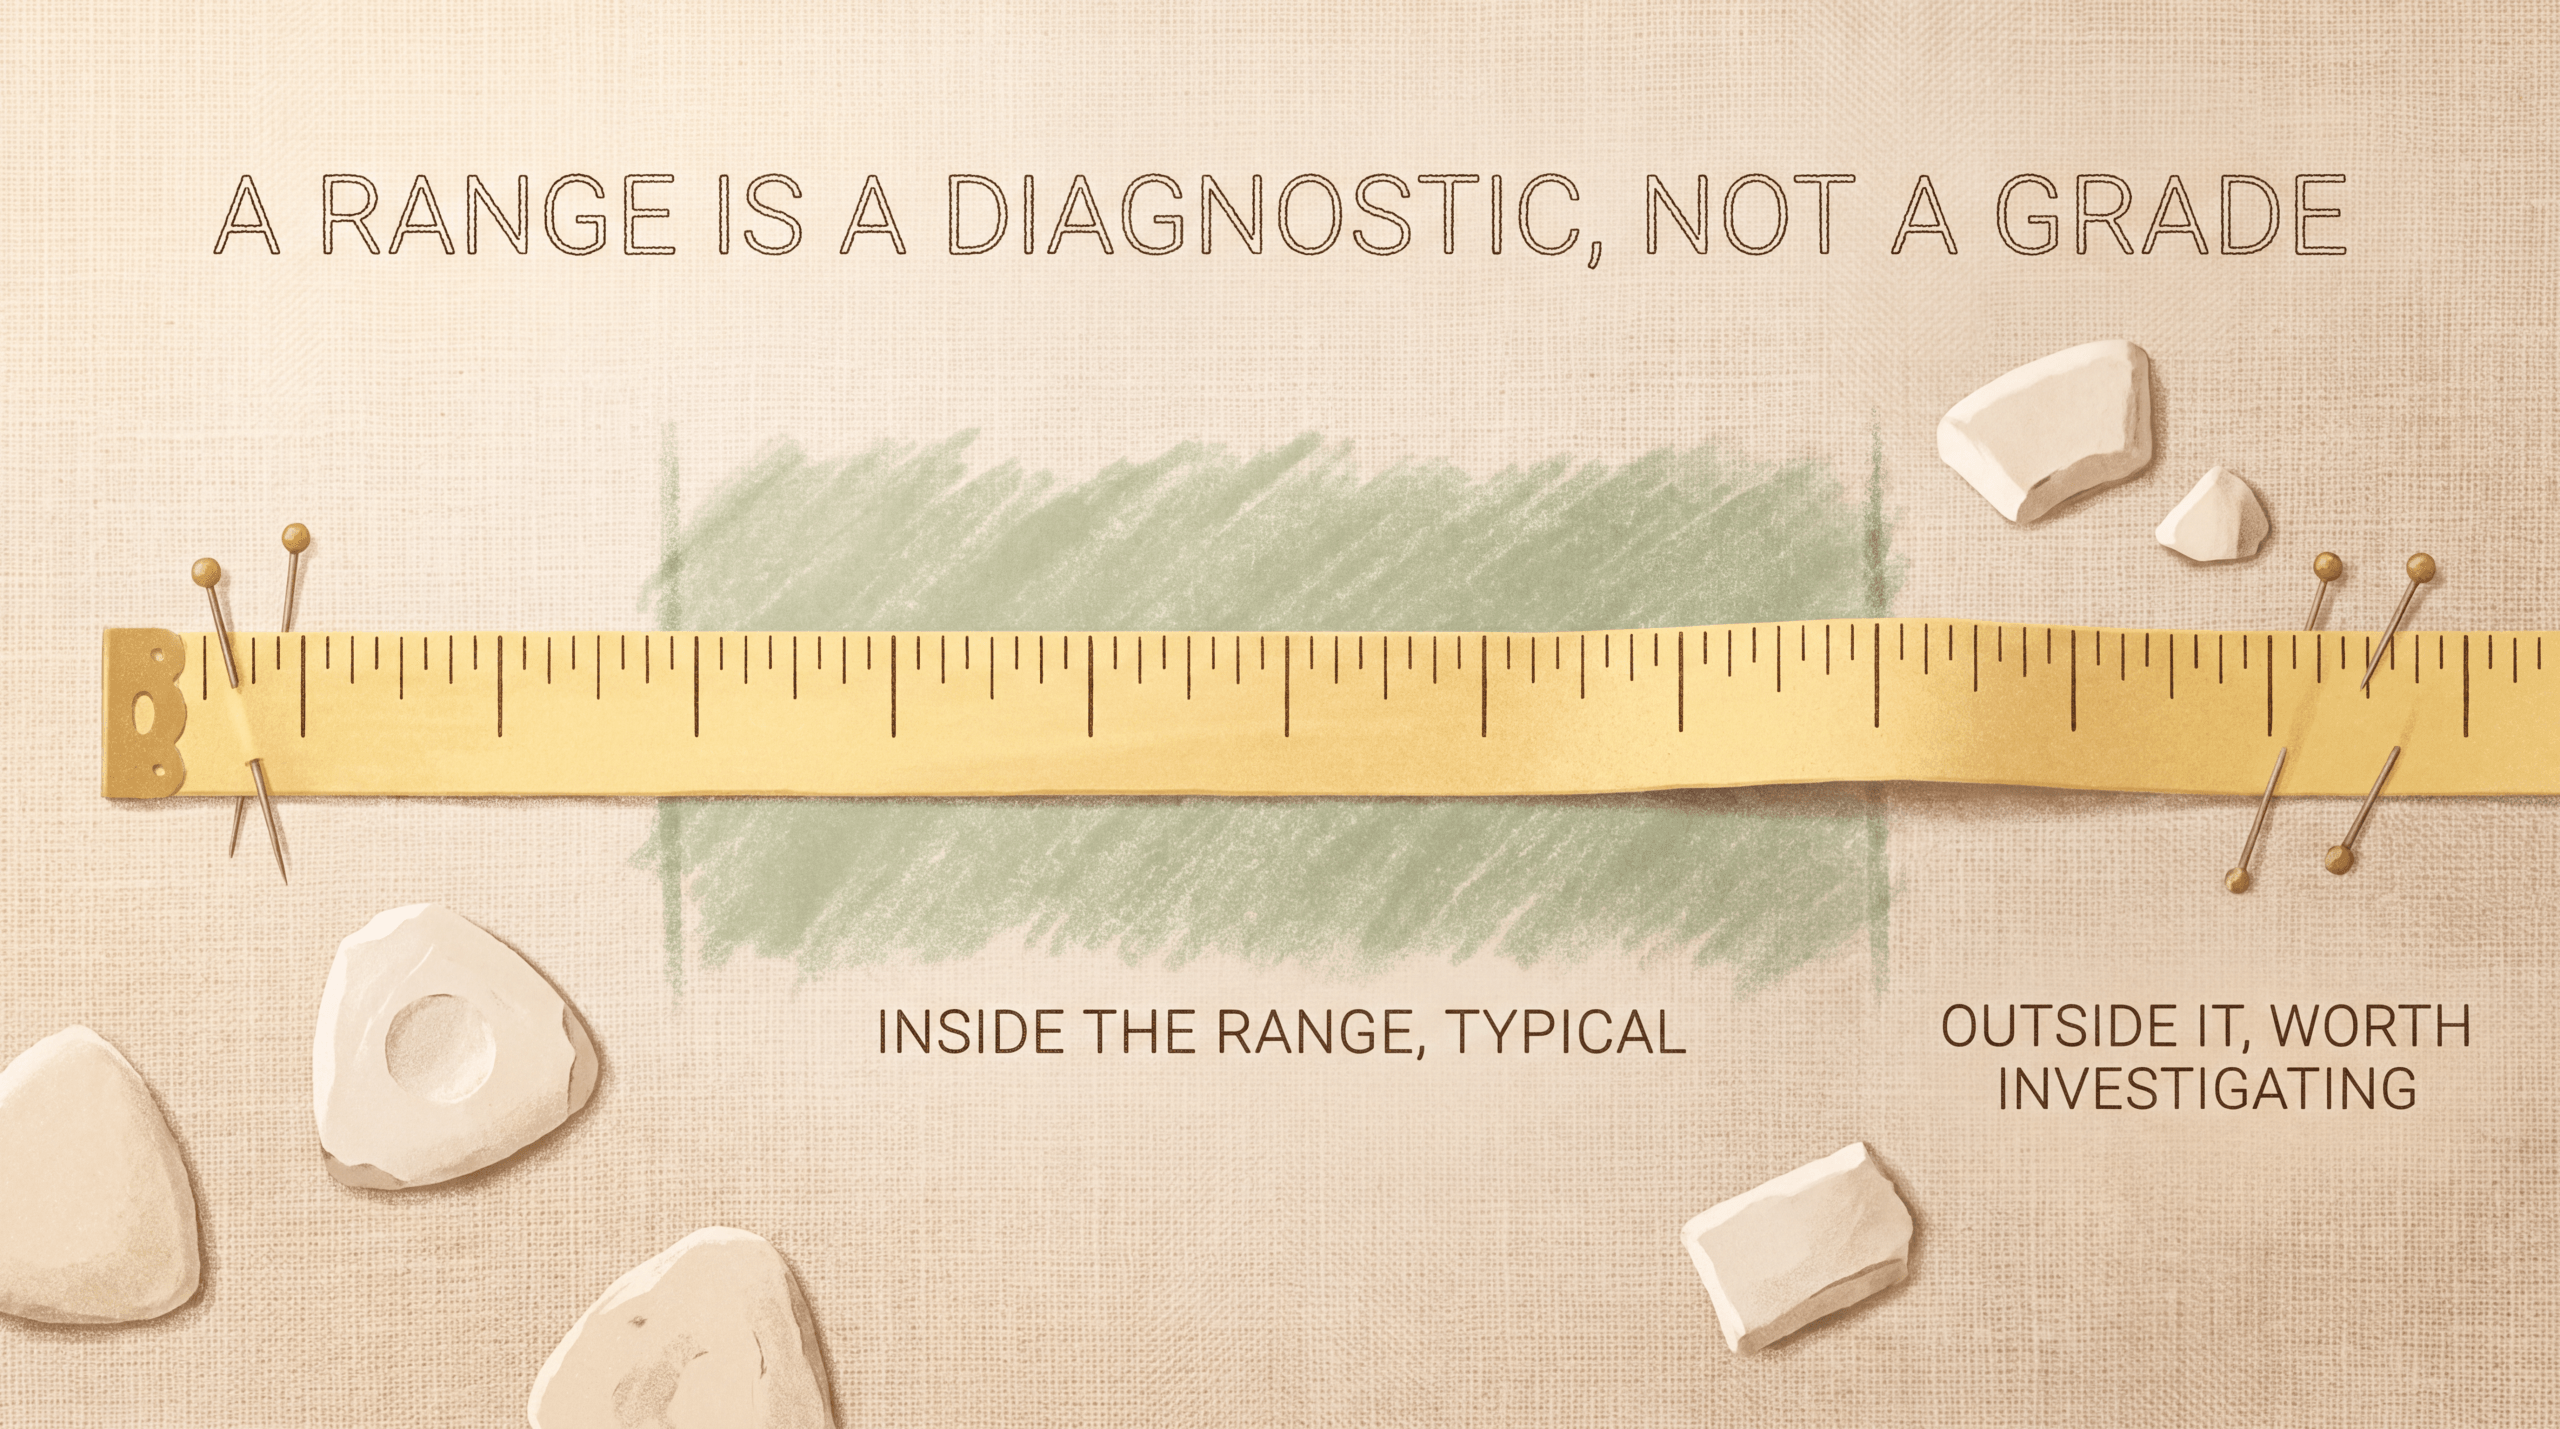
A range like “20 to 40 percent browser-pixel miss” is the observed spread across the audit sample, not a confidence interval. The audit method is described under Methodology below. The figures answer the question “what range does Hyros typically see across customer accounts in this vertical,” not “what is the population-wide median for the entire industry.”
Two practical rules for using these ranges:
If your account’s number lands inside the range, you are inside the typical operating band Hyros customers see. That does not mean your tracking is correct or incorrect. It means you are not an outlier worth alarming over.
If your number lands outside the range on either side, that is a diagnostic signal worth investigating. Numbers far below the range usually indicate underreporting on the platform side. Numbers far above usually indicate double-counting or duplicate event firing.
These are field benchmarks. Use them as orientation, not as a substitute for measuring your own account.
High-Ticket Coaching
Coaching offers in the $2,000 to $25,000+ band, sold through long funnels that include opt-ins, webinars, applications, sales calls, and email follow-up. The shared characteristic is a buying cycle that exceeds every native ad-platform attribution window.
| Metric | Observed range | Caveat |
|---|---|---|
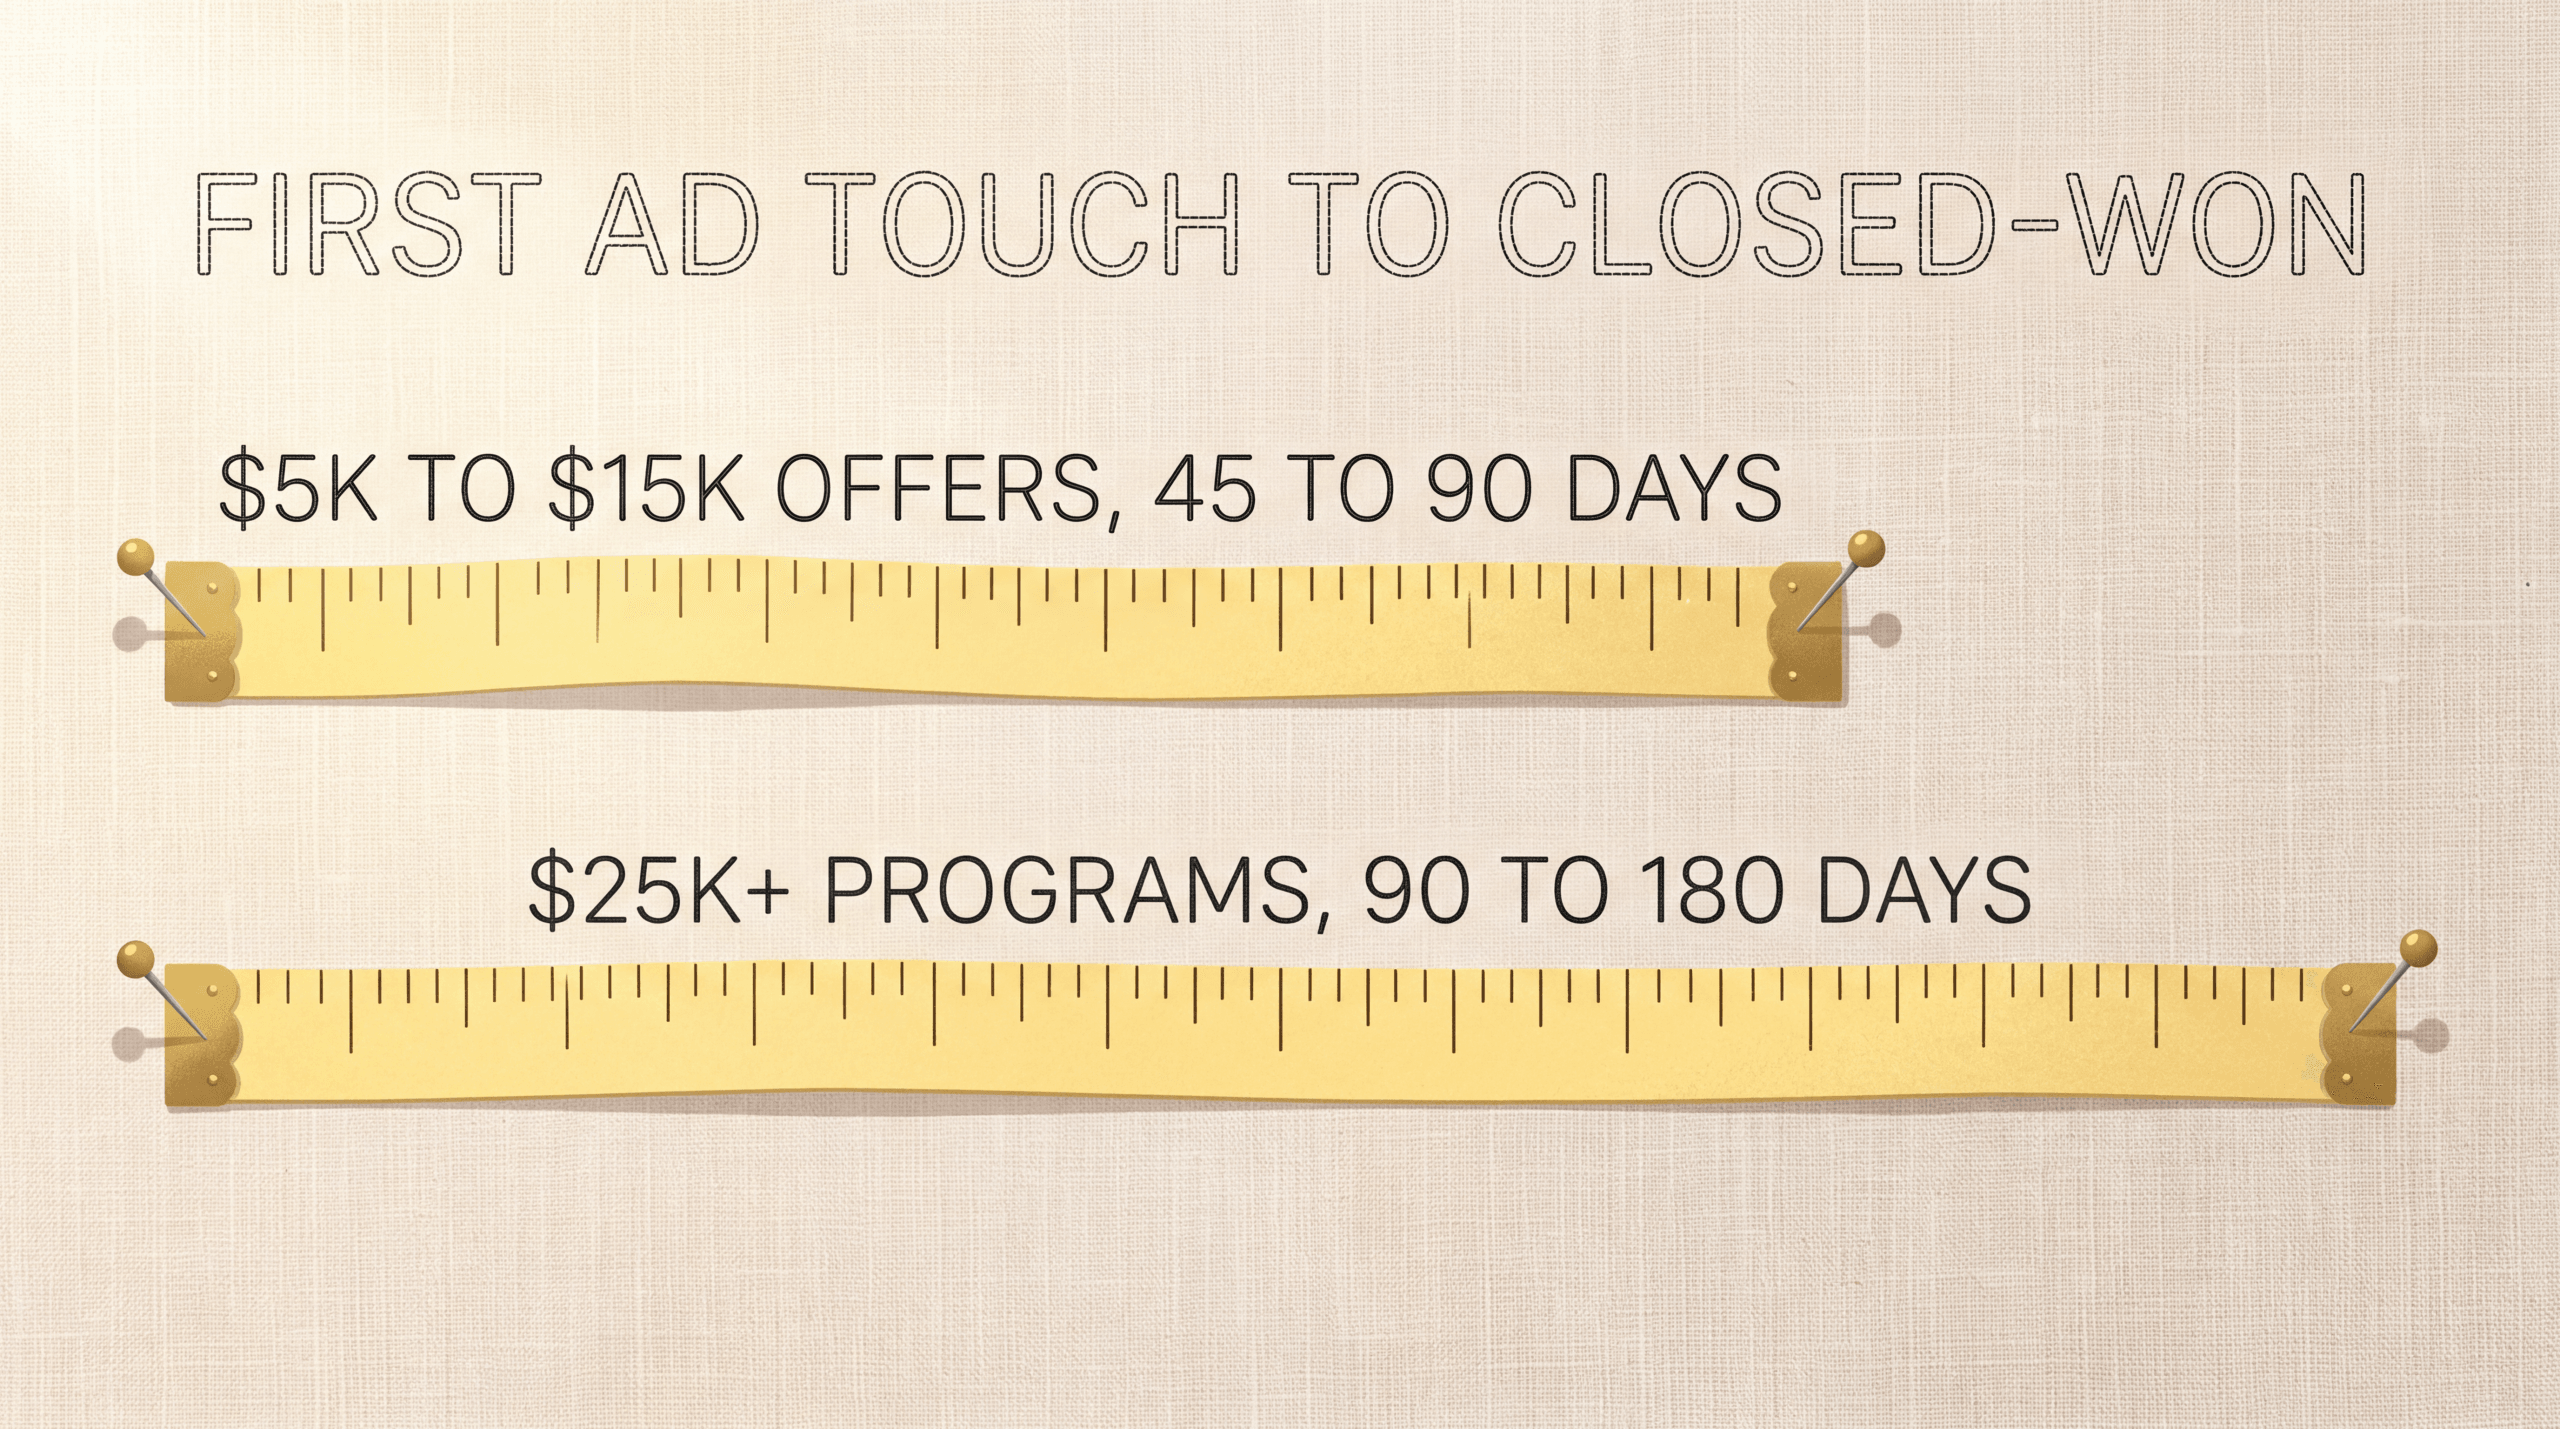
| Time from first ad touch to closed-won, $5K-$15K offer | 45 to 90 days | Cycle compresses for live-webinar buyers, extends for replay+nurture buyers |
| Time from first ad touch to closed-won, $25K+ programs | 90 to 180 days | Often runs longer; 180 is the realistic minimum window setting |
| Closes with no traceable ad source under default platform attribution | 30 to 50 percent | Measured before five-wire setup; drops materially after wire-in |
| Browser-pixel event miss across the funnel | 20 to 40 percent | Driven by cookie blockers, iOS privacy settings, ad blockers |
| Number of separate tools in the average coaching funnel stack | 4 or more | Counted as distinct vendors handling ad, lead, email, webinar, CRM, call, checkout |
| Wires actually in place when a new account starts an audit | 1 to 2 of 5 | Five wires are UTM schema, server-side pixel, CRM stitch, call-tracking, refund events |
What “Hyros customer audit” means here. A documented review of a customer’s attribution stack performed by the Hyros team. The audit compares native ad-platform reported conversions to Hyros’s UID-stitched revenue over a shared 30 to 90 day window, then breaks down where signal is lost. The customer accounts in this vertical are coaching businesses running significant monthly paid acquisition.
Public case studies that anchor the vertical. Dan Henry (GetClients.com): 300 percent more profitable within 72 hours of implementing Hyros, scaled from $20K/month to $300K/month in ad spend. Sam Ovens (Skool): documented Hyros customer credited with reshaping ad measurement after years on platform-reported data. Tony Robbins’ team: scaled ad spend 43 percent on Business Mastery and 100+ percent on Unleash The Power Within over six months. Source: hyros.com/our-results.
SaaS (Self-Serve, Sales-Assisted, PLG)
SaaS attribution breaks at the trial-to-paid boundary. Trial windows run 14 to 90+ days and outlast both cookies and most native ad-platform attribution windows. Each go-to-market motion breaks attribution differently.
| Metric | Observed range | Caveat |
|---|---|---|
| Self-serve trial-to-paid window | Most pay events land within ~14 days of signup | Faster cycles compress to 7 days; longer to 21 |
| Sales-assisted trial-to-paid window | Most closed-won lands ~30 days after signup | Range driven by SDR/AE follow-up cadence |
| PLG enterprise trial-to-paid window | 60 to 90+ days from signup to paid upgrade | Driven by activation event timing, not signup |
| Ad-driven paid conversions uncredited in native platform reporting | 25 to 50 percent | Worst gaps in motions with longest trial windows |
| CheckThat.ai independent measurement of the Hyros tracking gap | 29 to 33 percent more conversions vs native platform reporting | Validates the SaaS observational range within band |
What “Hyros customer audit” means here. A review of a SaaS customer’s trial-to-paid attribution stack. The audit compares the ad platform’s reported paid-conversion count for a 90 day window to the customer’s billing-system actual paid-conversion count for the same window, then segments by GTM motion. Customer accounts in this segment are SaaS businesses with meaningful paid-acquisition budgets.
Why the ranges are wider than industry medians might be. Hyros’s customer base over-indexes on motions where attribution is hardest: PLG with in-product activation events, sales-assisted with offline closes, and self-serve with cross-device journeys. A pure e-commerce shop with one-session purchases would not show numbers in this range. The benchmark is for SaaS motions, not all SaaS companies.
Agency (Multi-Client Reporting)
Agencies running ads on behalf of clients sit downstream of the same attribution gaps every brand sees, multiplied across the client roster. The metrics below come from agency reporting audits where Hyros reviewed the dashboards the agency was sending to clients.
| Metric | Observed range | Caveat |
|---|---|---|
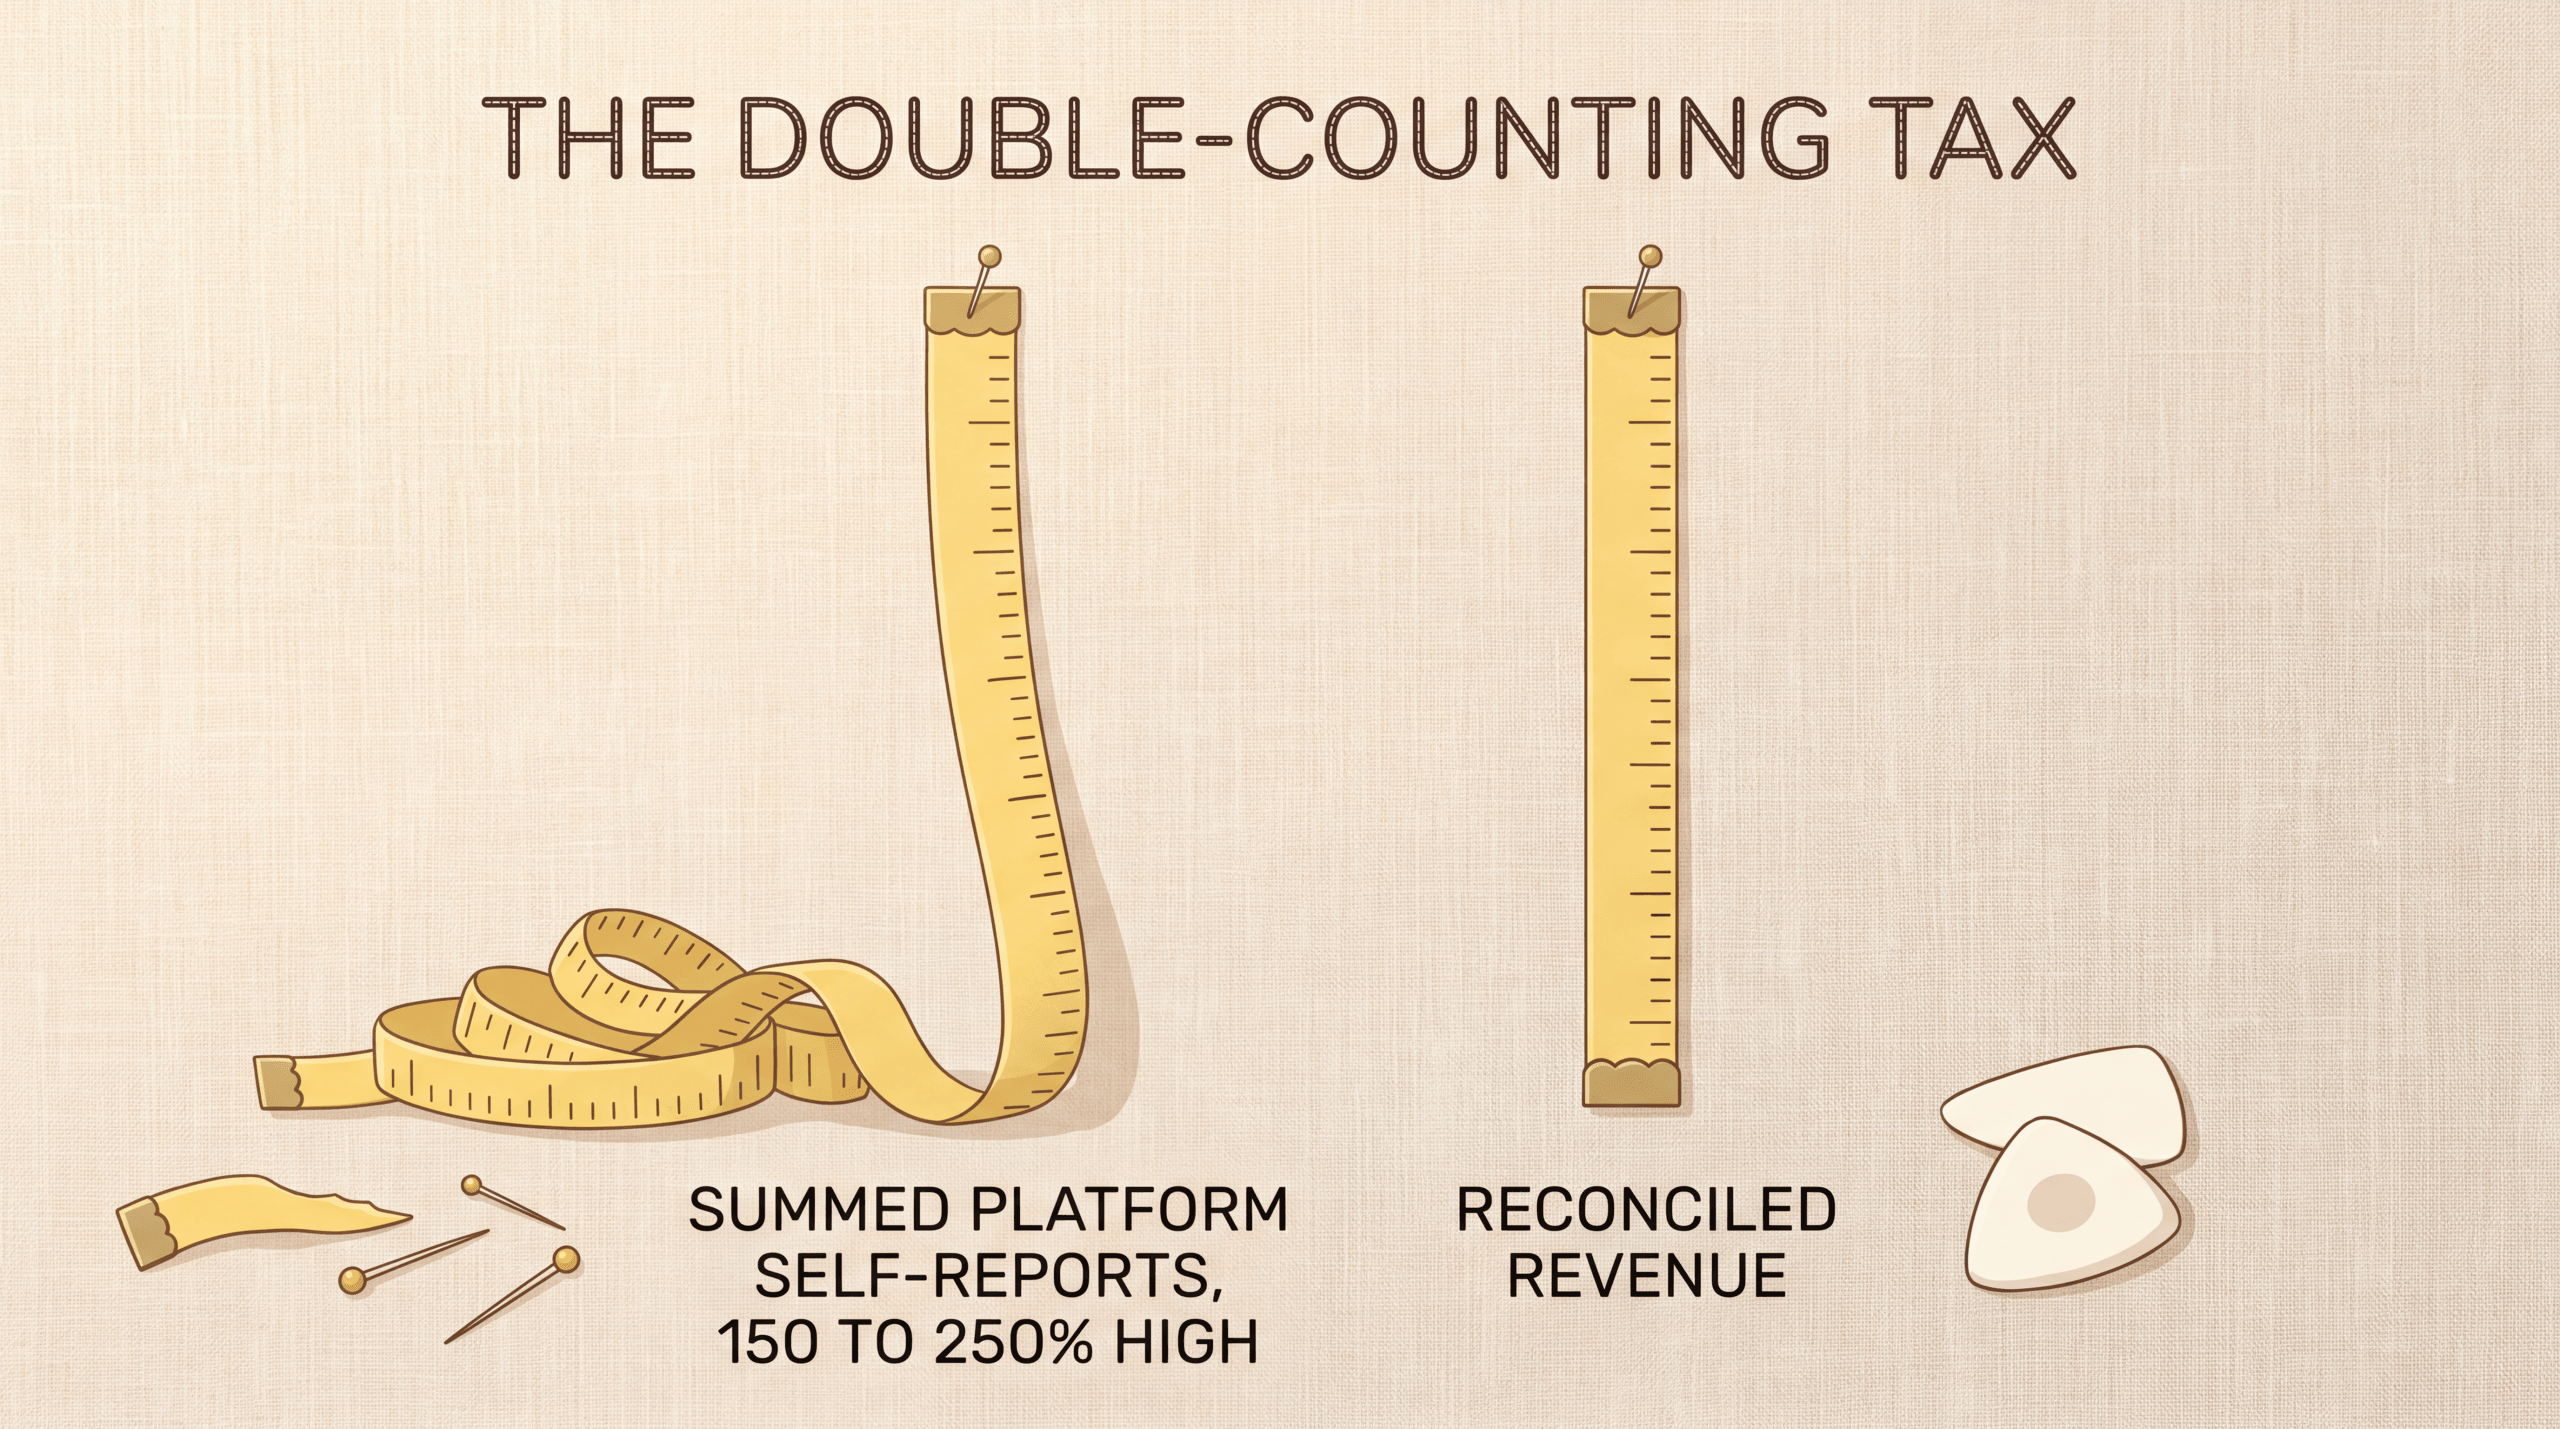
| Reported revenue inflation from summed platform self-reports vs reconciled revenue | 150 to 250 percent | Driven by cross-platform double-counting; widest on accounts running 3+ paid channels |
| Reconciled blended ROAS divergence from summed-platform blended ROAS | Material on multi-channel accounts | Worked example: summed 5.25x vs reconciled 3.88x |
| Last-quarter revenue from cohorts showing decay signals (churn-risk indicator) | Material share for ecom DTC accounts | Specific percent varies by client; worked example showed 24% of last-quarter revenue at risk |
What “Hyros customer audit” means here. A review of an agency’s client reporting workflow. The audit reconciles the dashboard the agency is sending the client (typically AgencyAnalytics, Whatagraph, DashThis, Databox, or Cometly) against Hyros UID-stitched data on the same accounts during the same windows. Agency customer accounts in this segment are paid-media agencies managing multiple client accounts across several paid channels.
Why double-counting hits agencies harder. Every client is a separate retainer. Every wrong number is a separate cancellation risk. Most page-one agency dashboard tools white-label the wrapper but pipe in the same platform self-reports underneath, which is the structural source of the inflation range above. The reconciliation layer is what changes the number.
Direct Response and Ecommerce
Direct-response ecommerce accounts running paid acquisition into one-session purchase patterns. Cycles are short, AOVs vary widely, and the dominant attribution failures are double-counting and view-through misattribution, not long-cycle window expiration.
| Metric | Observed range | Caveat |
|---|---|---|
| Hyros Shopify integration: Facebook underreporting versus server-side tracked data | ~30 percent | Reported on the Hyros Shopify integration page |
| Hyros Shopify integration: Google underreporting versus server-side tracked data | ~29 percent | Reported on the Hyros Shopify integration page |
| Hyros Shopify integration: TikTok underreporting versus server-side tracked data | ~33 percent | Reported on the Hyros Shopify integration page |
| UTM-only setups missing revenue paths across cross-device, dark-social, AI-referral, view-through, and ATT-opted-out paths combined | 30 to 50 percent | Range is the combined blind-spot estimate, not a single-cause figure |
What “Hyros customer audit” means here. A review of a direct-response customer’s attribution stack, with reconciliation between Shopify or other ecommerce platform actuals, Hyros UID-stitched revenue, and ad-platform self-reports. Customer accounts in this segment are ecommerce businesses running meaningful paid acquisition.
Info-Product and Hybrid Coaching/Course
Info-product businesses overlap with high-ticket coaching at the architecture level but differ in price band, fulfillment, and refund dynamics. The benchmark table below is for businesses selling courses, memberships, and lower-ticket programs ($497 to $3,000) where the cycle is shorter than coaching but longer than DR ecommerce.
| Metric | Observed range | Caveat |
|---|---|---|
| Time from first ad touch to first purchase, mid-ticket info-product ($497 to $3,000) | 14 to 45 days | Compresses for live-launch and replay buyers; extends for evergreen funnels |
| Upgrade rate from front-end offer ($497 to $3K) into back-end mastermind ($10K+) over 12 months | Material share but offer-specific | Specific rate varies widely by offer; worked example used “roughly a quarter” as illustration |
| Browser-pixel event miss across the funnel | 20 to 40 percent | Same driver as coaching: cookie blockers, iOS privacy, ad blockers |
What “Hyros customer audit” means here. A review of an info-product customer’s funnel stack, focused on attribution from cold-traffic ad spend through opt-in, webinar or VSL, email nurture, and first purchase. Customer accounts in this segment are info-product businesses running cold-traffic paid acquisition at scale.
How to Use These Benchmarks
For marketers, agencies, and analysts who want to compare their own numbers against these ranges.
If you are a marketer running your own ads. Pull the same metric from your account over a comparable window. Land inside the range, your account is operating in the typical Hyros customer band. Land far outside, that is a diagnostic signal. Numbers below the underreporting ranges usually mean your platform pixels are firing cleanly. Numbers above usually mean event duplication or double-counting between channels.
If you are an agency. Use the reported-revenue-inflation range as a credibility check on dashboards you inherit from a client’s previous agency. Summed-platform ROAS 220 percent of actual revenue is not rare. The 150 to 250 percent range is what we see across the audit sample, not a worst-case outlier.
If you are writing or citing. This page is the canonical reference for the figures above. Cite it directly. Do not aggregate ranges into a single “average” number. The audit data does not support a population-wide point estimate. The honest framing is “Hyros observes a typical range of X to Y across audited customer accounts in vertical Z.”
If you are evaluating Hyros. These ranges are the operational picture, not the case-study highlight reel. The case-study page (hyros.com/our-results) shows what specific customers achieved. This page shows what we typically see across the customer base.
Methodology
Six clarifications on how these ranges were generated.
1. What counts as a “Hyros customer audit.” A documented review of a customer’s attribution stack performed by the Hyros team, comparing native ad-platform reported conversions to Hyros UID-stitched revenue over a shared time window of at least 30 days. Each audit produces a structured report with field-level reconciliation between platforms.
2. Time period. Audits are drawn from a rolling recent window. We update this page semi-annually to refresh ranges as the audit sample grows.
3. Customer base. Hyros has 4,000+ customers and tracks $3.5 billion+ in attributed revenue. The audit sample is a subset of that customer base, not the entire base. Customers who opted into formal audit reviews are over-represented.
4. Sample size per vertical. Sample sizes vary by vertical. Smaller verticals have wider ranges and weaker statistical weight. Larger verticals (coaching and ecommerce) have tighter ranges and stronger weight. We do not claim population-level representativeness.
5. What we cannot publish. Customer-level data is confidential. We publish ranges and central tendencies, not specific customer attribution numbers. Public case studies (Dan Henry, Sam Ovens, Tony Robbins, RegenALight, Legion Athletics) are sourced from hyros.com/our-results, with the customer’s permission.
6. Limitations. These are observational ranges from Hyros customers, not random samples of all advertisers. Hyros’s customer base over-indexes on verticals where attribution is hardest: high-ticket coaching, info-products, B2B SaaS with long trial cycles, multi-channel ecommerce. A randomly selected SMB advertiser would not necessarily see numbers in these ranges. The benchmarks describe operating reality in our customer base, not the universe of paid acquisition.
FAQ
Are these published peer-reviewed studies?
No. These are first-party observational ranges from Hyros customer-account audits, not academic studies. The closest thing to independent validation is CheckThat.ai’s measurement of the Hyros tracking gap at 29 to 33 percent more conversions surfaced versus native platform reporting. Peer-reviewed academic research on attribution-gap measurement at this granularity does not exist as of publication. The benchmark publication exists so working marketers have a single reference point that is more specific than industry-wide hand-wave numbers and more honest about its sample-frame limits than typical vendor research.
How often do you update these benchmarks?
Semi-annually. The audit sample grows quarterly and the ranges shift modestly as customer mix evolves. We commit to refreshing this page every six months with the current audit sample, marking which figures shifted and which held. The methodology block at the top will name the audit window for each refresh.
Can I cite these benchmarks in my own content?
Yes. Cite the canonical URL of this page (hyros.com/data/2026-attribution-benchmarks). The honest framing for outside writers is “Hyros observes a typical range of X to Y across audited customer accounts in vertical Z, per their published 2026 benchmark page.” Please do not collapse a range into a single average. The audit data does not support a population point estimate, only a typical operating band.
Why are your ranges wider than what I see on industry-survey pages?
Two reasons. First, industry-survey pages tend to publish single numbers from one survey wave, even when the underlying distribution is wide. We publish ranges because the underlying distribution genuinely is wide across our customer base. Second, our customer base over-indexes on verticals where attribution is structurally harder (long-cycle coaching, PLG SaaS, multi-channel ecom). A range that looks wide on this page looks closer to median when filtered to those specific motions.
What if my account’s number lands outside the range?
That is a diagnostic signal, not a diagnosis. Numbers far below the underreporting ranges usually indicate that your platform pixels are firing unusually cleanly, your cycle is unusually short, or your channel mix is single-channel. Numbers far above usually indicate event duplication, double-counting across channels, or platform conversions firing on engagement events that should not count as conversions. Either case is worth a 30-minute audit of the event configuration in your platform’s events manager.
How do I know these numbers are accurate?
You do not have to take them as gospel. The methodology block above names what counts as an audit, what time window, and what the limits are. CheckThat.ai’s independent measurement of the Hyros tracking gap at 29 to 33 percent corroborates the central observational range within the band. Beyond that, the right test is running the audit on your own account. The four-step audit in our SaaS attribution guide and the five-step audit in our coaching attribution guide both produce the gap number for your specific account in under an hour.
See how the gap on your account compares to the ranges above. [Book a demo.](https://hyros.com/book-a-call)
Related References
- What Is Ad Attribution? A Complete 2026 Guide
- Attribution for High-Ticket Coaches: The 5-Wire Setup
- SaaS Attribution: Free Trial to Paid Conversions
- Agency Ad Reporting Dashboard (2026 Template)
- Incrementality Testing Without Engineers
- UTM Parameters: The Complete 2026 Guide
- CheckThat.ai independent review of Hyros