

What to Include in an Agency Ad Reporting Dashboard (2026 Template)
TL;DR
- Page-1 agency dashboards white-label the wrapper but pipe in the same platform-reported lies
- Nine components defend retainers: blended ROAS, MER, reconciled CAC, three-model attribution, cohort LTV, churn risk, anomaly alerts, branding, and forward recommendations
- Reconciled attribution underneath white-label branding is the wedge; build once, ship every client
Every page-1 “agency dashboard” tool white-labels the wrapper but pipes in Google and Meta’s self-reported numbers. Pretty logo, your colors, same lying data. The component checklist below is built around 9 metrics that defend retainers: blended ROAS, MER, reconciled CAC by channel, three-model attribution breakdown, cohort LTV, churn risk, anomaly alerts, white-label branding, and a forward recommendations panel. Most templates skip churn risk and cohort retention — the two components that turn an agency from a media buyer into a strategic partner. The Hyros wedge: white-label rebranding sits on top of a reconciled attribution layer, so the numbers your client sees in your colors are numbers the ad platforms can’t inflate. Template structure included at the end. Build it once. Ship it to every client. Keep your retainers.
The Agency Reporting Paradox
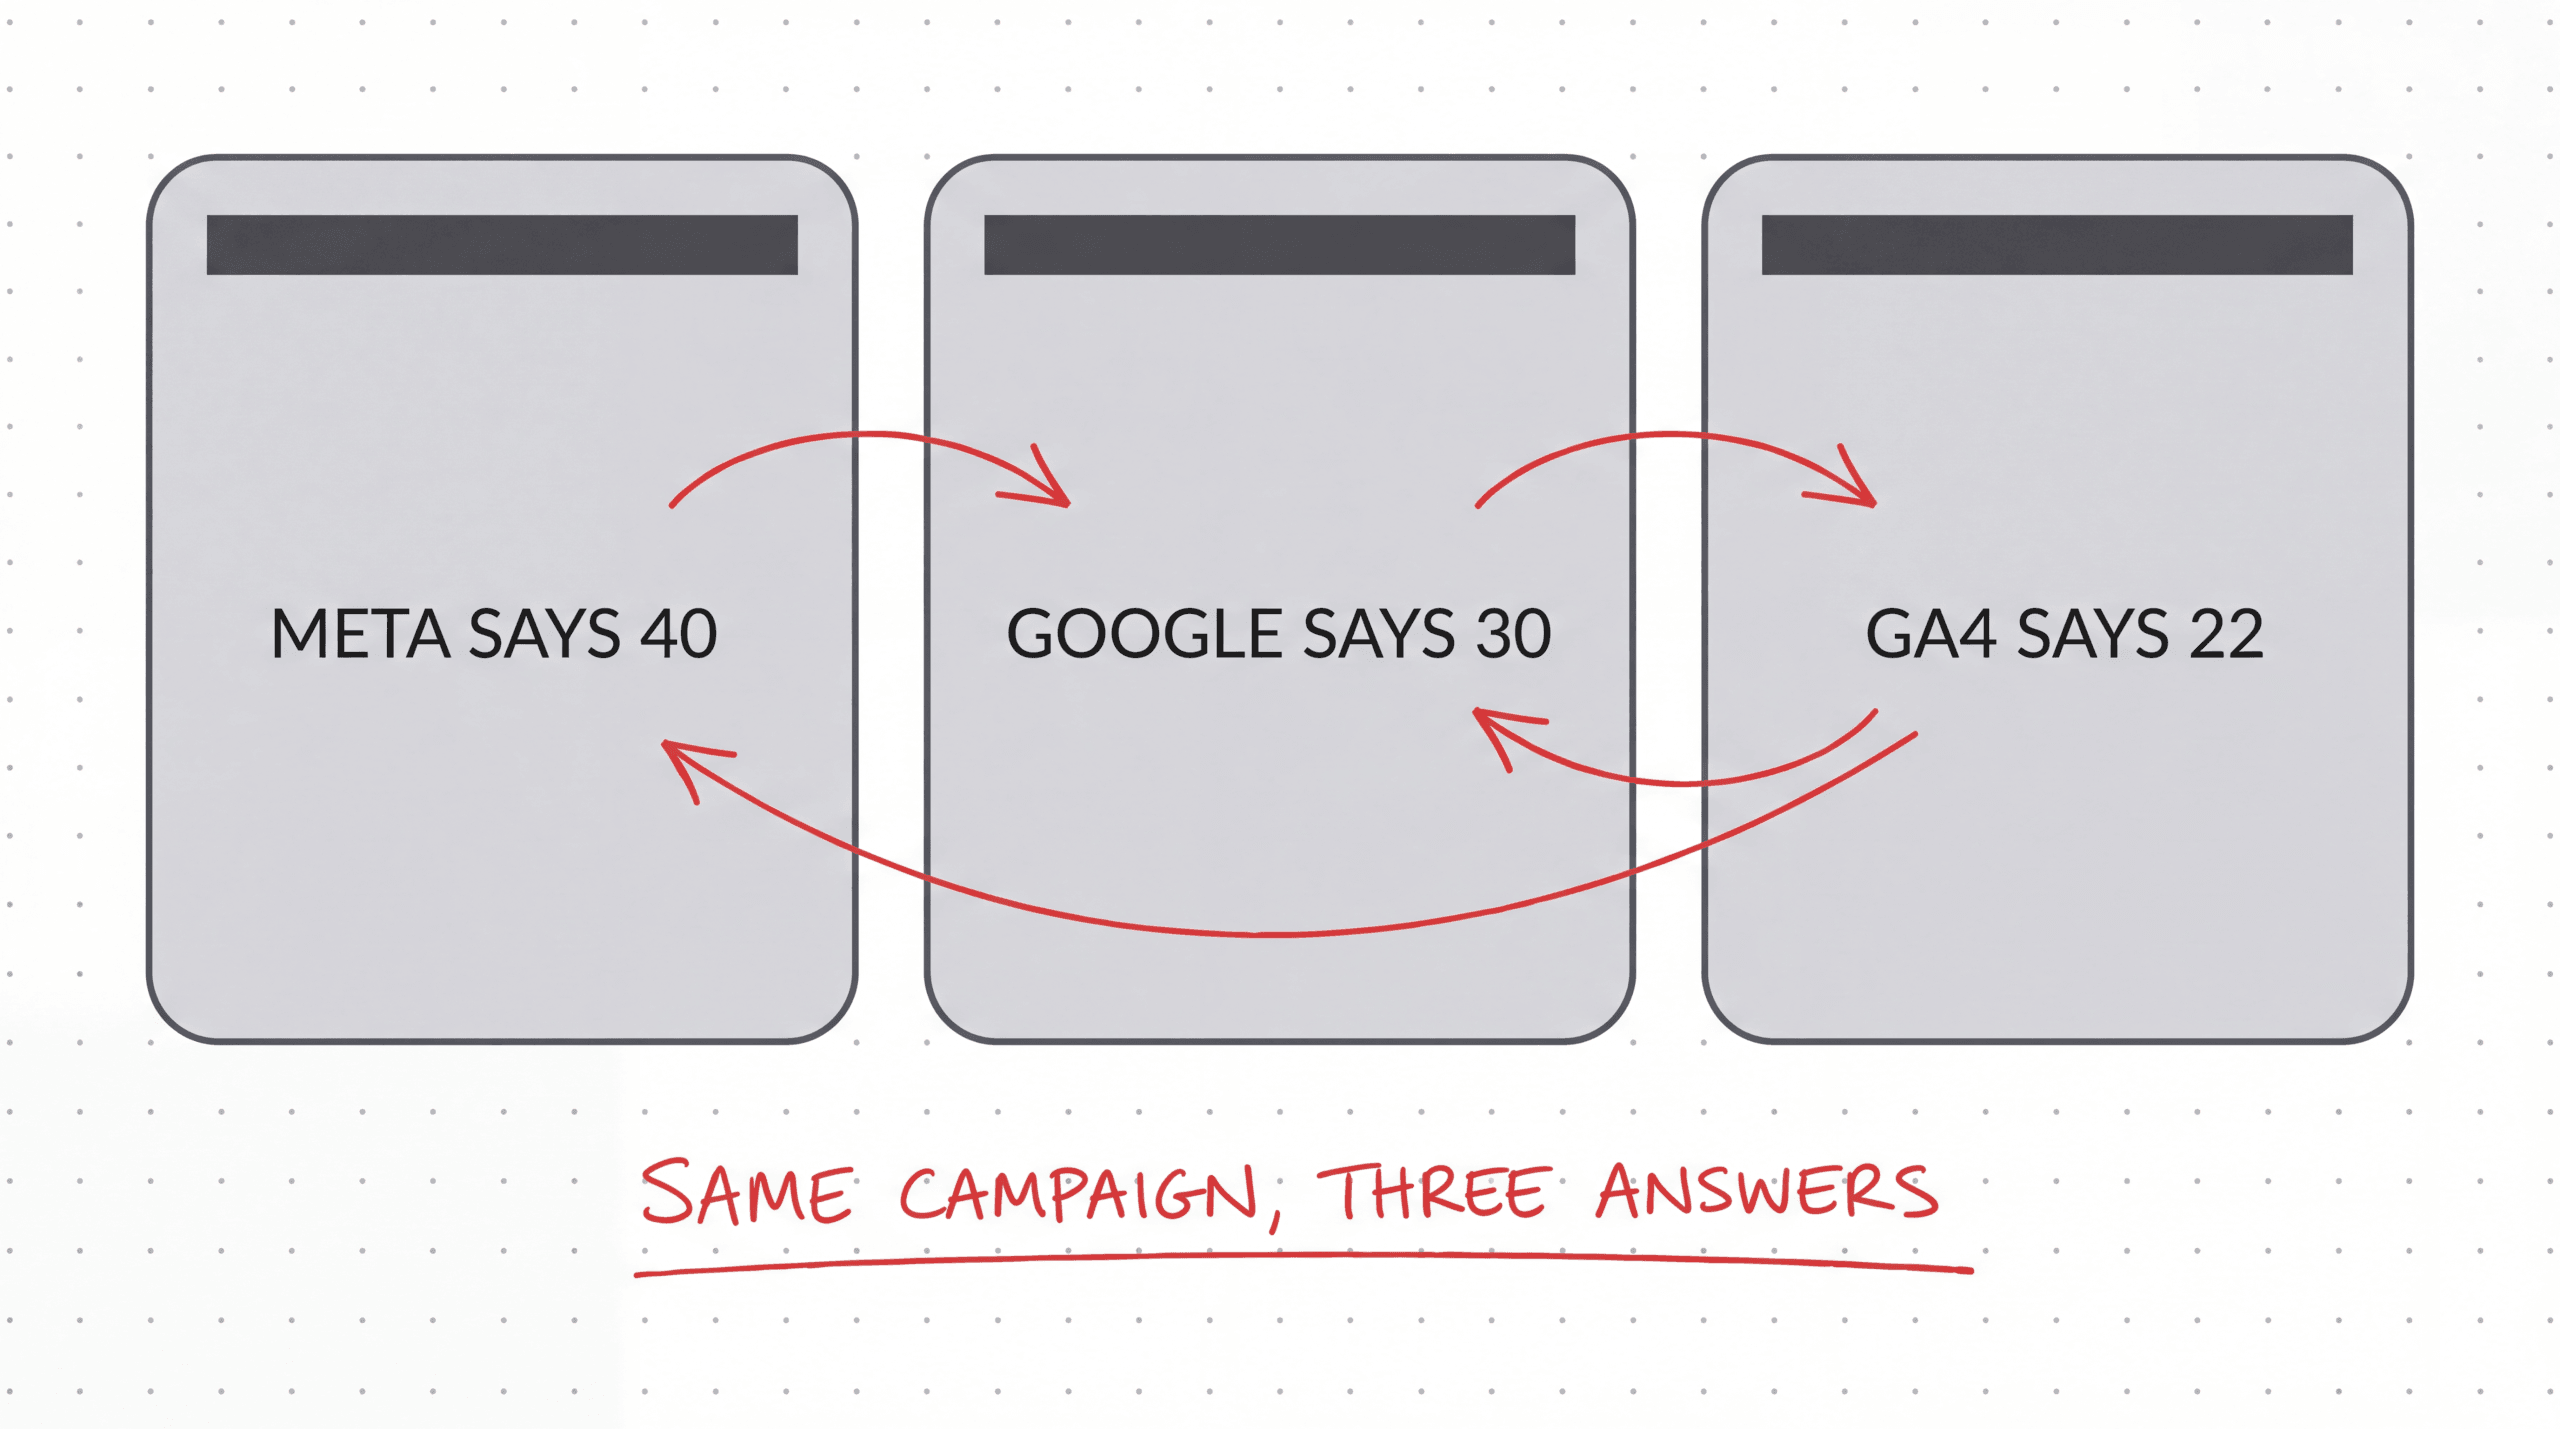
Your client wants one dashboard that answers a simple question: “What’s working?” But every ad platform reports a different ROAS for the same campaign. Meta says 40 sales. Google says 30. GA4 says 22. The client picks the smallest number, then wonders why the retainer is $8,000 a month.
This is the trap every page-1 dashboard tool falls into. AgencyAnalytics, Whatagraph, DashThis, Databox, Cometly. I’ve looked at across customer accounts at the feature pages. They all let you white-label the wrapper, swap the logo, change the colors, custom domain. Then they pipe in the same Google and Meta numbers underneath. The dashboard your client sees is a prettier version of what they could pull from their own ad manager on their phone.
That’s a screenshot service with a logo on it.
Look, I built Hyros because I needed honest attribution data for my own ad accounts and nothing else gave me numbers I could trust. The same problem hits agencies harder: every client is a separate retainer and every wrong number is a separate cancellation risk. So this isn’t theory. It’s the component checklist I wish I’d had when I was running ads. Nine components. One template at the end. Use it.
Why Most Agency Dashboards Fail
Three failures stack on top of each other. Each one is a retainer killer.
The first is the vanity tile problem. CTR, CPC, impressions, frequency. These metrics tell your client absolutely nothing about whether their money worked. The moment a client sees a dashboard full of acronyms they don’t recognize, they start asking what they’re paying for.
The second is the platform-self-report problem. Meta claims X conversions, Google claims Y, GA4 claims Z. The agency picks whichever number makes the retainer survive that week, and the client eventually notices the gap between the dashboard and their bank account.
The third is double-counting. When five channels each claim 100% credit for the same purchase, “total ROAS” becomes fiction. I’ve reviewed agency reports where summed platform revenue was 220% of actual revenue. The agency had no idea. The client did the math the night before the renewal call.
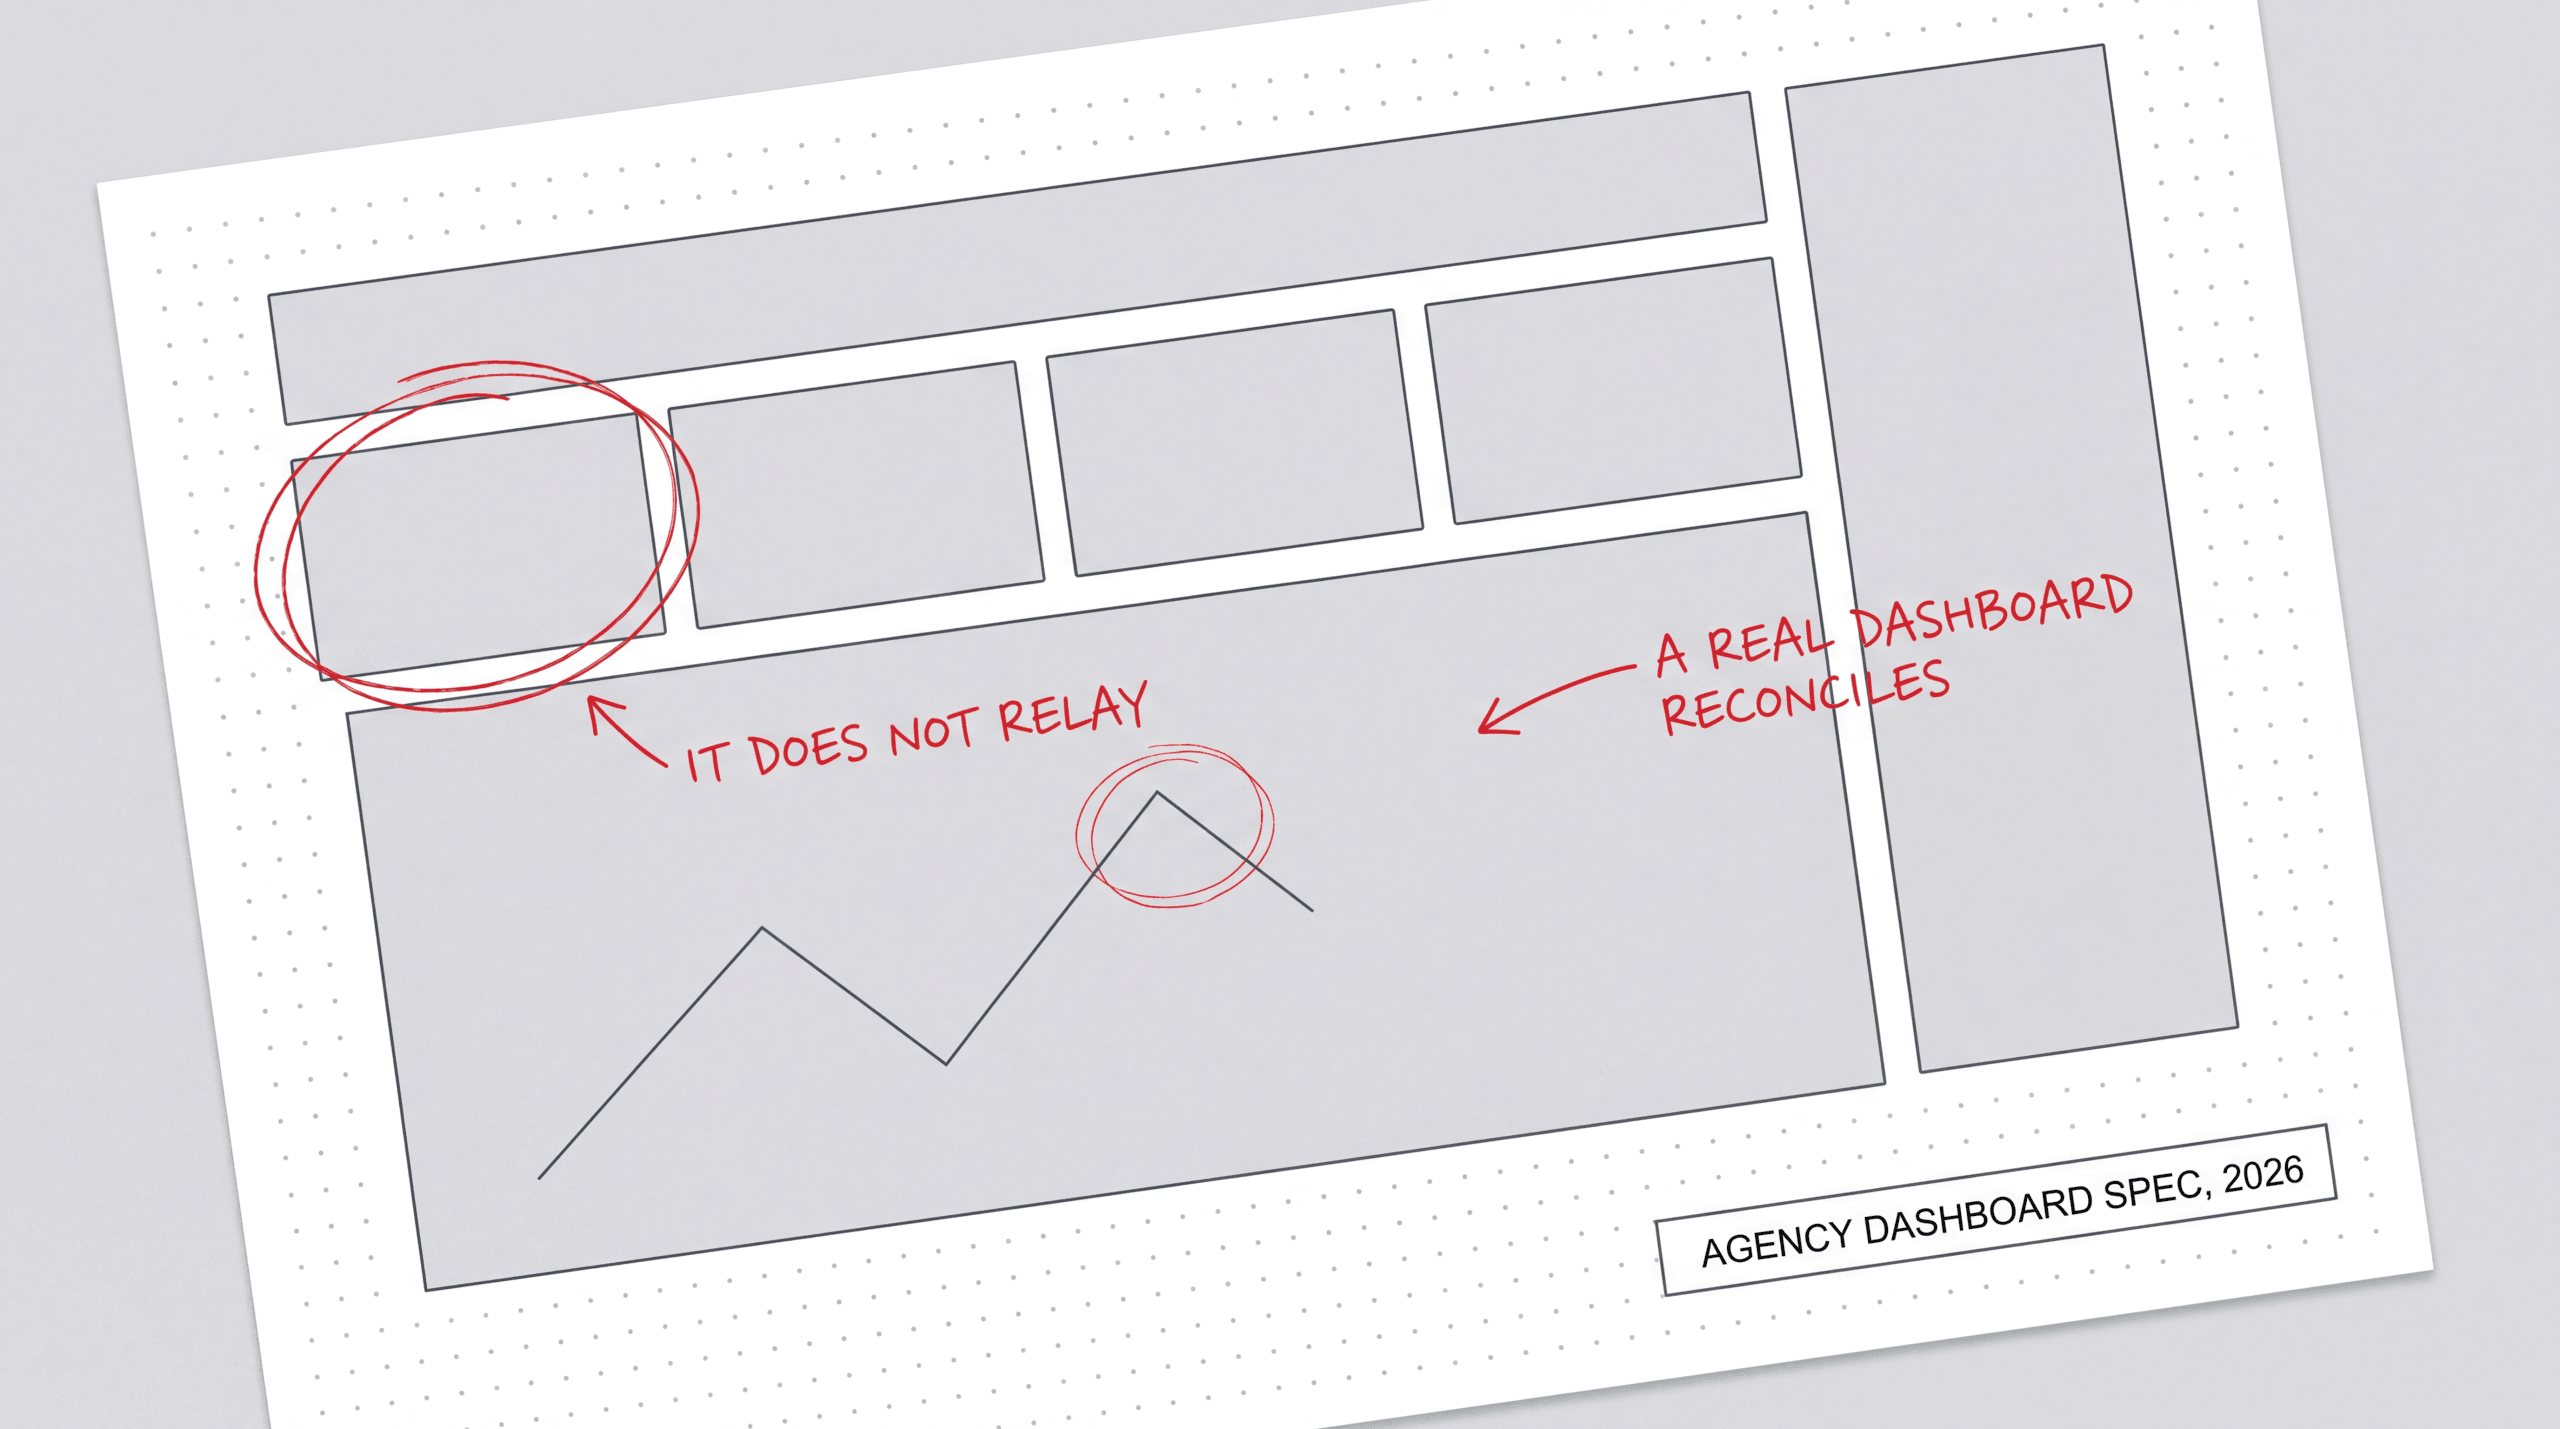
A real dashboard reconciles. It doesn’t relay.
The 9 Components Every Agency Dashboard Needs
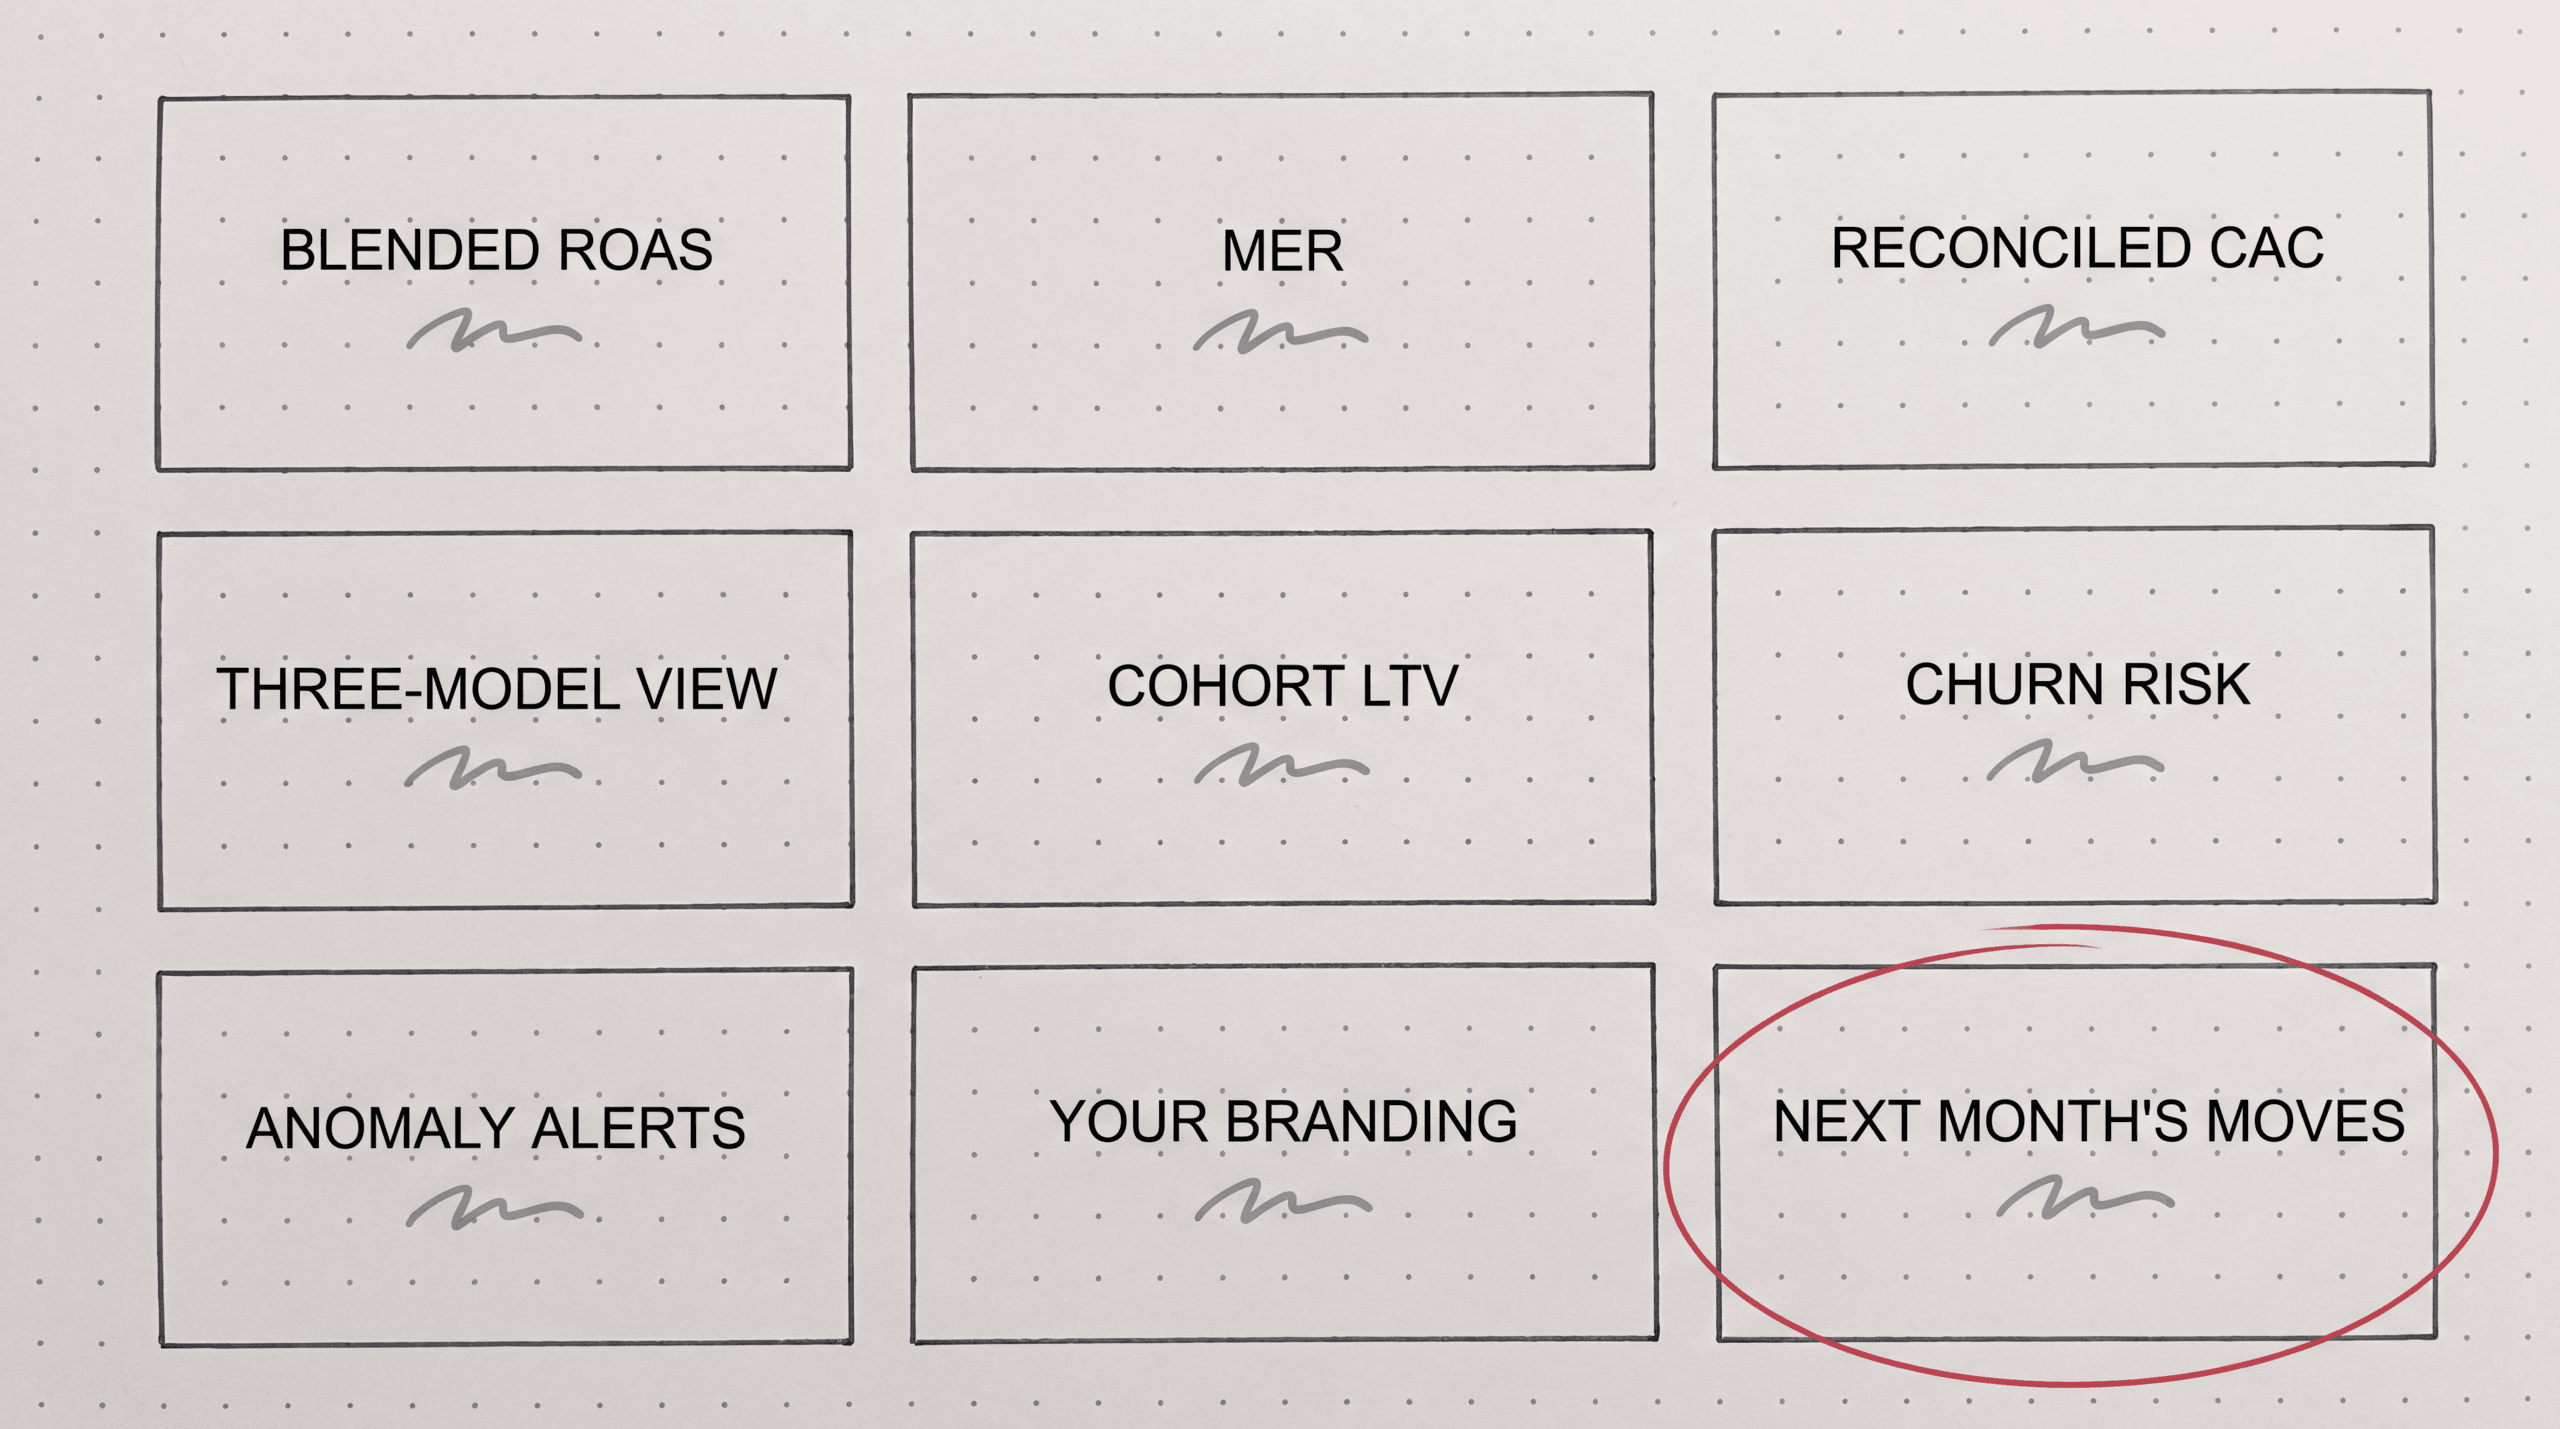
This is the spine of the template. H3 per component, one-line definition, why it matters, and where Hyros’s attribution layer changes the answer compared to the page-1 tools that pipe in platform numbers.
1. Blended ROAS (not platform ROAS)
Definition: total tracked revenue divided by total ad spend across all channels.
Why it matters: the only ROAS number that can’t be double-counted, because there’s one revenue line and one spend line.
Hyros note: most dashboards calculate blended ROAS from summed platform-reported revenue. That’s where the 150-250% inflation comes from. Hyros pulls reconciled revenue from the UID layer, so the blended ROAS in your client dashboard reflects actual attributed sales, not summed platform claims.
2. MER (Marketing Efficiency Ratio)
Definition: total revenue divided by total marketing spend, including paid, organic, tools, and creative production.
Why it matters: the CFO metric. ROAS can look fine on every channel while MER quietly bleeds out, because tooling costs and organic spend never show up on platform dashboards. The client’s CFO is looking at MER even when the client isn’t.
Hyros note: include MER as a trendline, not a single snapshot number. Directional truth (is MER improving week over week?) matters more than the value on any given day.
3. CAC by Channel (Reconciled)
Definition: customer acquisition cost split per source, after deduplicating cross-platform credit.
Why it matters: tells the client where to add spend and where to cut. Get it wrong and the client scales losers and kills winners.
Hyros note: competitors literally can’t deliver this honestly. They show CAC per platform using each platform’s claimed conversions. Meta reports its own CAC at $32, Google at $28. Reconciled CAC, after deduplicating overlap, is $51 on Meta and $44 on Google. Hyros deduplicates. The aggregators don’t.
4. Attribution Model Breakdown (Three Lenses)
Definition: the same conversion shown through last-click, first-touch, and multi-touch models side-by-side.
Why it matters: ends the “Meta says 40, GA4 says 22, what’s true?” meeting. When the client sees all three models on one panel, the conversation shifts from “which platform is lying?” to “which model fits our buying cycle?”
Hyros note: Hyros exposes all three models simultaneously without forcing the client into a single one. Most attribution tools pick one and hide the rest.
5. Cohort Retention + LTV
Definition: revenue per acquired cohort across months 1, 3, 6, and 12.
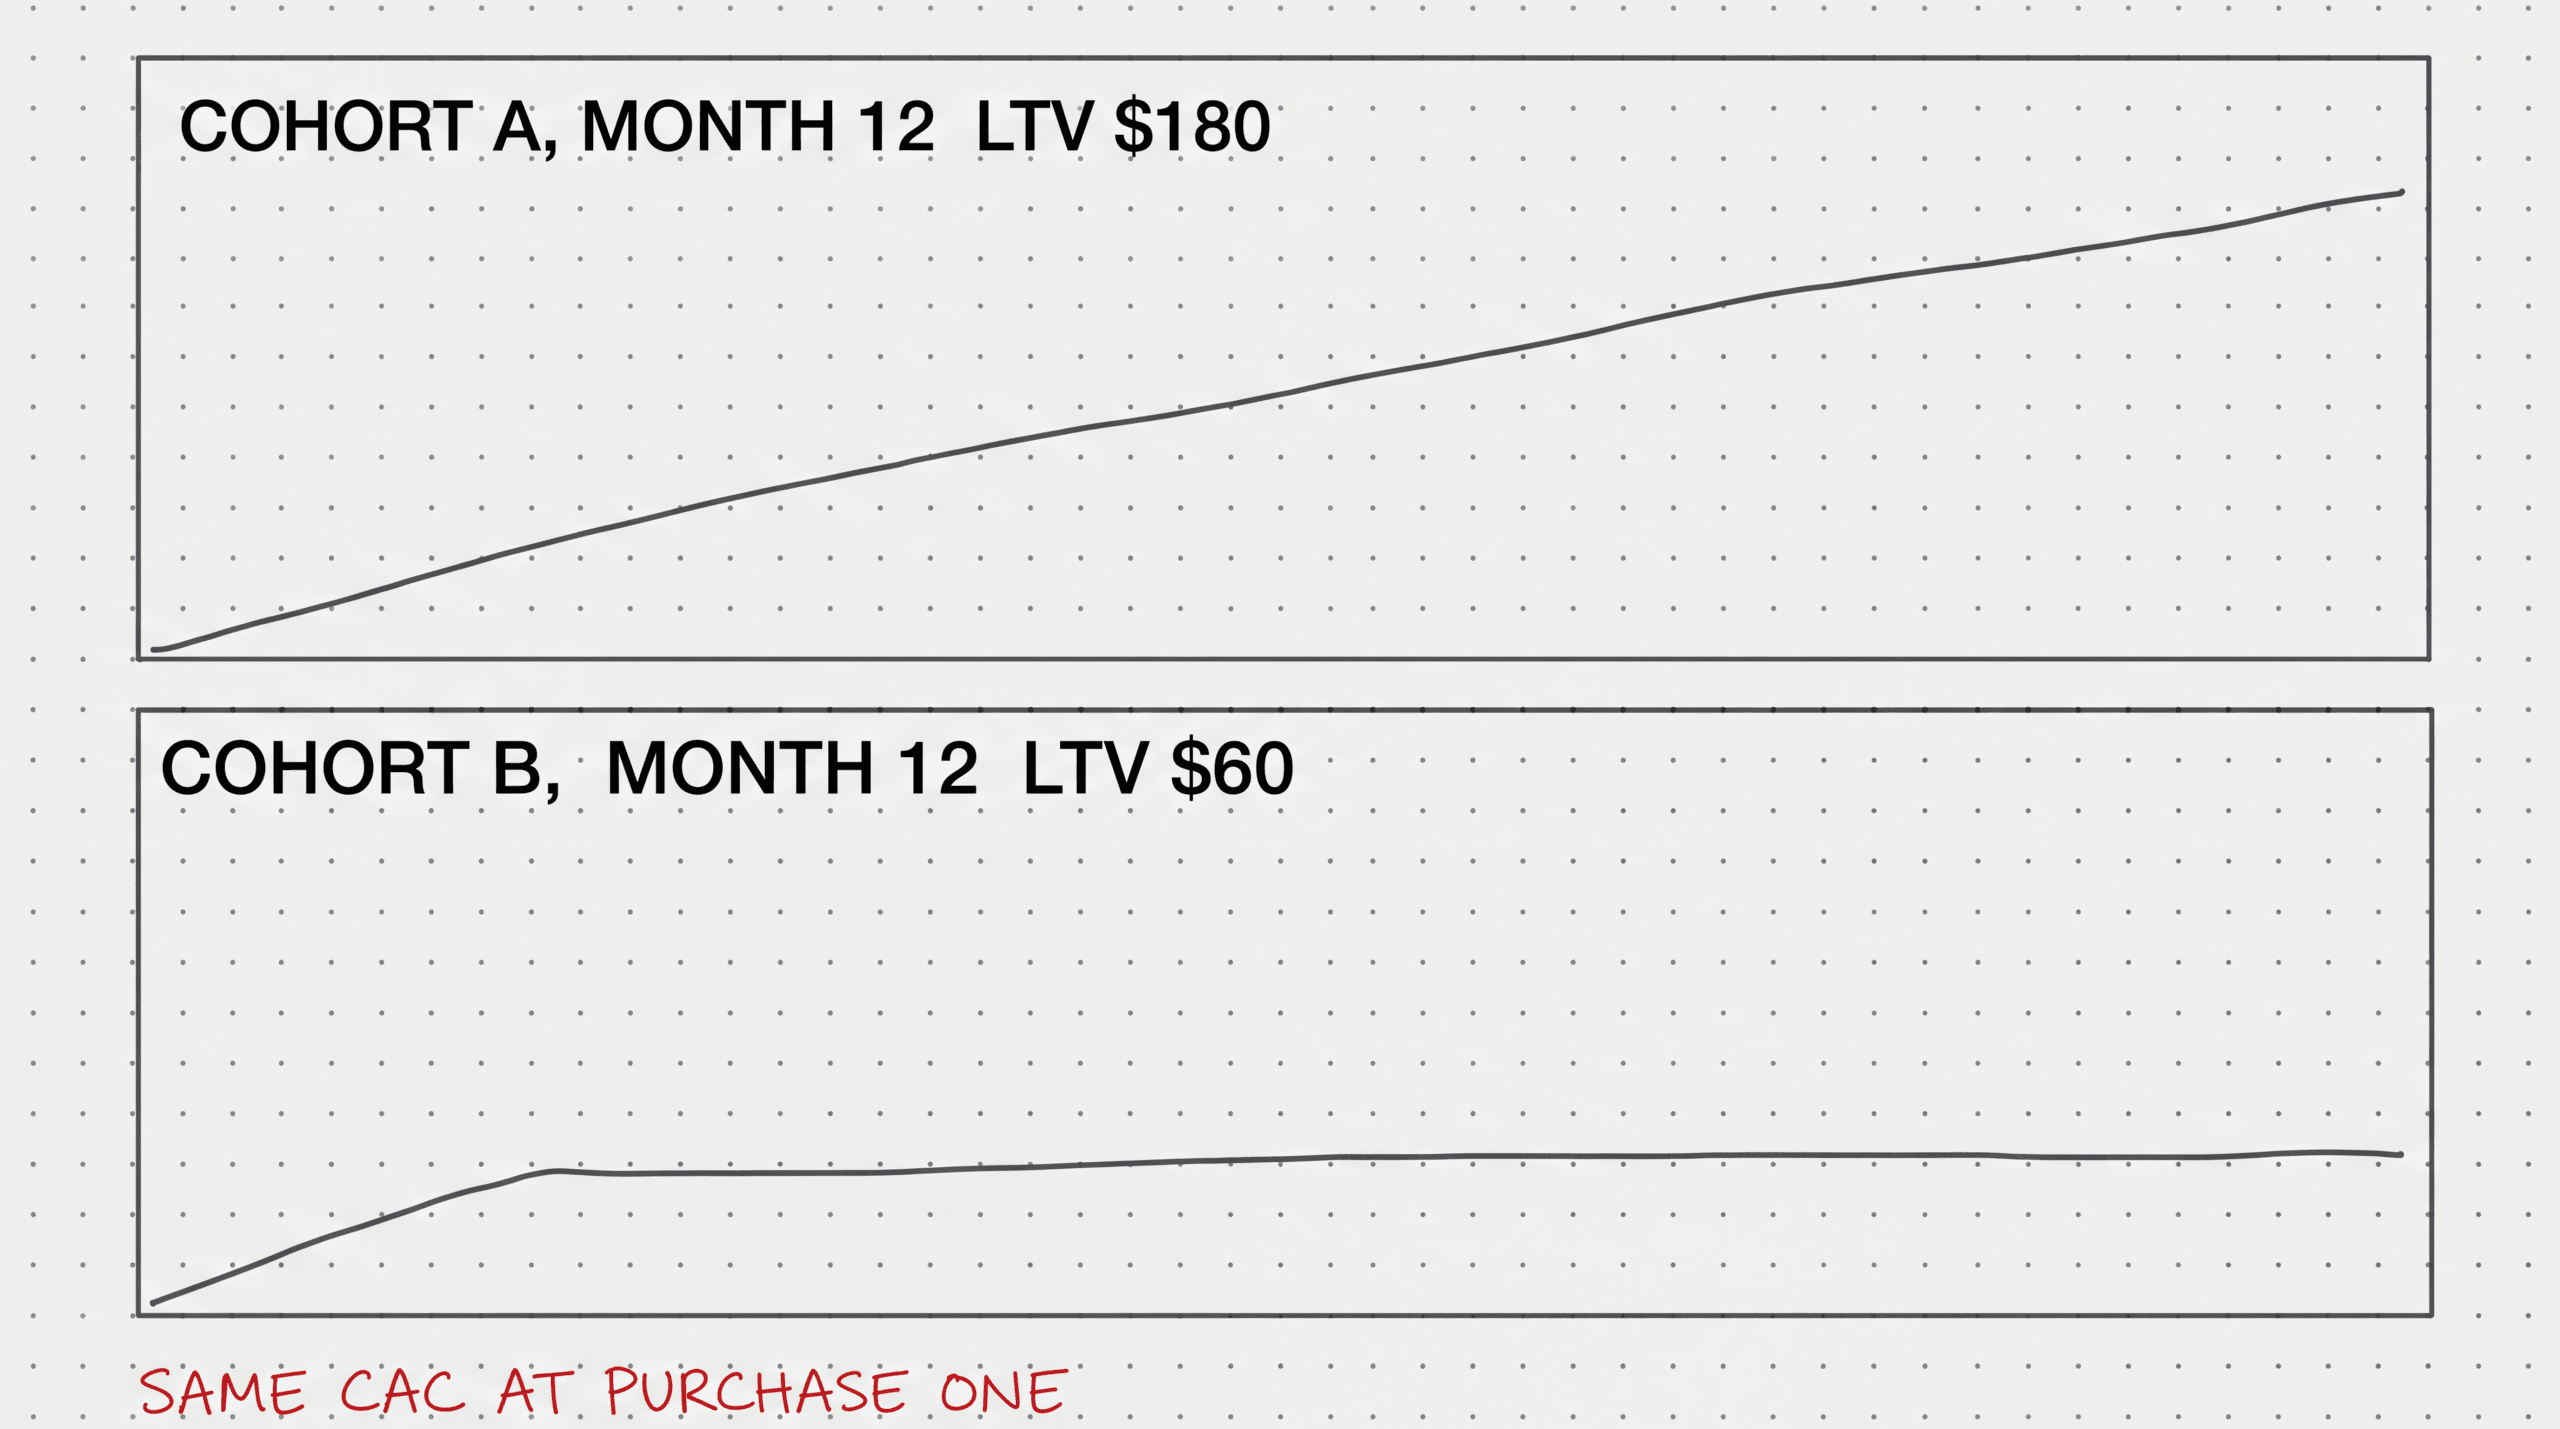
Why it matters: separates “channels that buy customers” from “channels that buy one-time buyers.” A Facebook cohort with a 12-month LTV of $180 looks very different from a TikTok cohort at $60, even if first-purchase CAC was identical.
None of the SERP page-1 dashboards include cohort retention. Adding it positions the agency as a retention partner, not a media buyer.
6. Churn Risk / At-Risk Revenue
Definition: percentage of last-quarter revenue from cohorts showing decay signals (declining repeat-purchase rate, declining email engagement, declining session frequency).
Why it matters: gives the client a forward-looking number instead of a rear-view mirror. Most dashboards report what already happened. A churn risk tile predicts what’s about to happen, which is what the client actually wants.
Pair the churn risk number with proactive recommendations the agency can pitch (retargeting flow, win-back email sequence, loyalty program). That’s the difference between a report that gets read and a report that gets ignored.
7. Automated Anomaly Alerts
Definition: rule-based or ML-flagged spend, ROAS, or CTR deviations beyond a defined threshold.
Why it matters: scheduled email reports are dead. The 2026 standard is Slack or email pings on real anomalies, not weekly PDFs the client never opens.
Hyros note: anomaly detection on reconciled data catches issues 24-48 hours faster than platform-native alerts, because the platforms don’t flag their own over-reporting. When platform ROAS suddenly spikes 40%, the platform is celebrating. Independent attribution flags the spike for what it usually is: a duplicate-counting episode that’s about to invert your optimization.
8. White-Label Branding
Definition: agency logo, agency colors, custom domain, no vendor mention anywhere in the client view.
Why it matters: your client should never see “Powered by [tool]” at the bottom of their dashboard. Every visible vendor logo erodes your agency brand and reminds the client that what you’re delivering is a tool they could subscribe to themselves.
Hyros note: white-label is table stakes in 2026. Every dashboard tool offers it. The wedge isn’t white-label alone. The wedge is white-label sitting on top of reconciled data. Branding the wrapper is easy. Branding numbers the platforms can’t inflate is the actual product.
9. Forward Recommendations Panel
Definition: 3-5 prioritized actions for the next 30 days, written in plain English.
Why it matters: turns the dashboard from a report into a conversation starter. Clients pay retainers for what to do next, not for what already happened. A panel that says “scale UGC creative #4 to a lookalike audience, kill bottom-quartile Google Search creatives, launch retargeting to the 90-day non-purchaser cohort” is worth more than 40 pages of charts.
This is where you embed strategic IP. Anyone can show CAC. Only your team can write the actions that move the next 30 days of ad spend.
The Agency Reporting Dashboard Template
Three rows, four panels each. Twelve tiles total. That’s the entire client view.
Top row (the executive summary the CEO looks at first):
Blended ROAS (current week + 4-week trendline)
MER (current month + 12-month trendline)
Reconciled CAC by channel (top 4 channels)
Churn risk percentage (current quarter)
Middle row (the diagnostic layer):
Attribution model breakdown (last-click vs first-touch vs multi-touch)
Cohort LTV by acquisition month (last 6 months)
Top 5 performing ads by reconciled ROAS
Channel mix waterfall (spend allocation vs revenue contribution)
Bottom row (the action layer):
Anomaly feed (last 7 days, flagged alerts only)
Forward recommendations (3-5 prioritized actions)
Week-over-week summary in plain English (3-4 sentences max)
Channel detail drill-down link (for the curious client who wants to dig)
Cadence:
- Live for the agency team (refreshed every 15 minutes during business hours)
- Weekly automated send to client (every Monday morning, summary email + dashboard link)
- Monthly strategic review meeting (the call where you actually walk the client through the recommendations panel)
What to leave OFF the client view:
- Technical pixel diagnostics, server-side debug logs, raw API responses
- Audience overlap data, raw retargeting list sizes, internal segmentation rules
- Internal margin notes, agency profitability per client, your own retainer math
- Anything that requires the client to know what a Conversions API is
The client doesn’t need to see the engine. They need to see the dashboard say “your money is working, here’s the proof, here’s what we’re doing next.” Everything else is noise that erodes confidence.
Template availability: Hyros offers a white-label dashboard template for agency clients, configurable per client workspace.
How Hyros’s Attribution Layer Changes Each Component
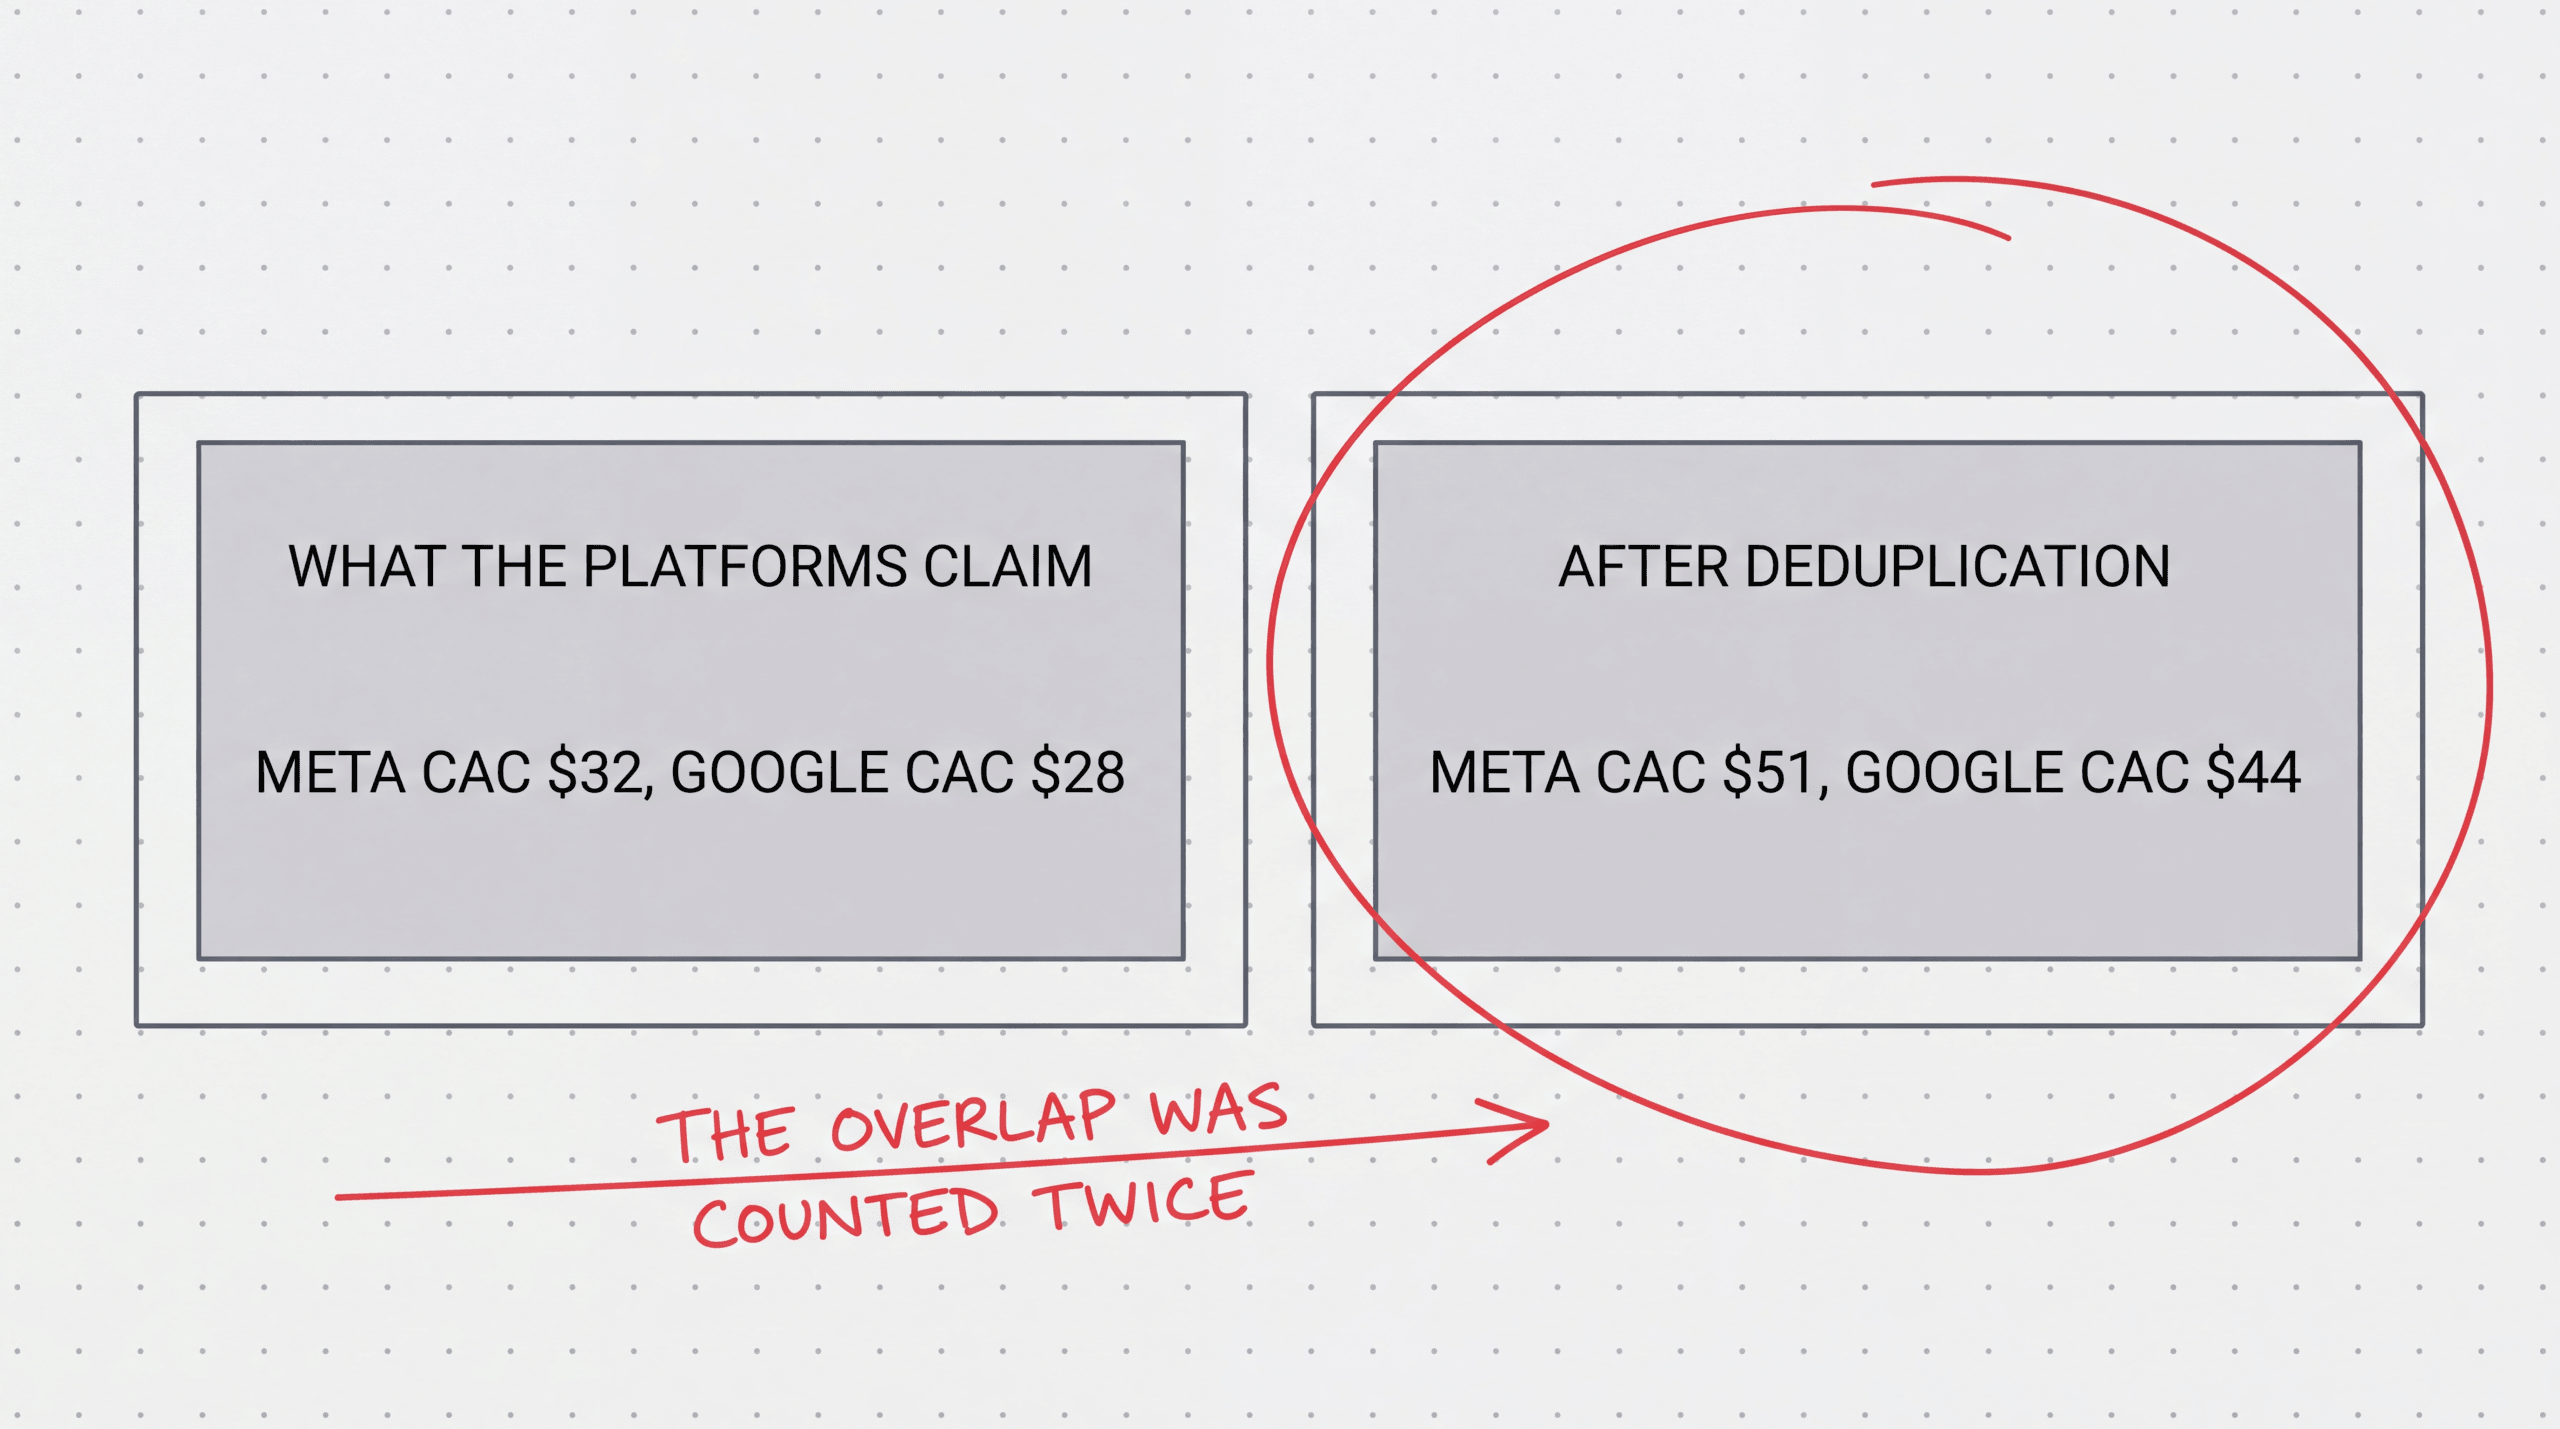
Same component name, different number underneath. That’s the entire pitch.
Let’s imagine an agency managing a Shopify ecommerce client with $80,000 a month in ad spend across Meta and Google, using AgencyAnalytics with API connections to both platforms.
Blended ROAS (platform sum vs reconciled): AgencyAnalytics pulls $240,000 from Meta and $180,000 from Google. Sums to $420,000. Divides by $80,000 spend. Reports 5.25x. The client is thrilled. Hyros’s UID layer matches conversions to actual unique customers and reports $310,000 in reconciled revenue. Real blended ROAS is 3.88x. The 1.37x gap is double-counted credit. Typical Hyros customer gaps run material on multi-channel accounts.
CAC by channel (platform-reported vs Hyros multi-touch): Meta reports 320 conversions for a CAC of $250. Google reports 240 conversions for a CAC of $333. Hyros identifies 410 unique customers (not 560 platform-claimed). Reconciled CAC is $390 on Meta and $480 on Google. Meta usually under-reports its own CAC because it claims conversions it didn’t drive.
Churn risk: AgencyAnalytics doesn’t include this component, because they don’t track post-purchase. Hyros does. The dashboard shows 24% of last quarter’s revenue came from cohorts showing decay signals. That’s a $74,000 at-risk number the agency can act on this week with a win-back campaign. Without Hyros, that number doesn’t exist.
Same component name. Different number underneath.
For deeper agency-specific attribution mechanics, see our multi-client attribution guide .
Common Dashboard Mistakes
Five mistakes I see in nearly every agency dashboard audit. Fix these and you skip a year of cancellation calls.
Showing 30+ metrics. Cognitive overload kills dashboards. The client opens the report, sees a wall of acronyms, closes the tab. Twelve tiles. That’s the budget. Everything else lives in drill-downs.
Using last-click as the only model. Last-click under-credits top-of-funnel and over-credits branded search. Clients see Google Search winning everything, cut Meta prospecting, then wonder why Search collapses three months later.
Refreshing daily but not flagging anomalies. Data without alerts is noise. Refresh frequency that nobody uses is wasted. Anomaly alerts convert raw data into action.
Branding without reconciliation. This is the page-1 trap. White-label wrapper, platform-reported data, branded PDF. It looks like an agency deliverable. It says nothing the client can’t already see. Reconciliation is the difference between a report and a screenshot service.
One-size-fits-all dashboards. Ecom, lead-gen, and info-product clients need different metric weightings (AOV vs cost-per-qualified-lead vs webinar conversion). One template per business model, not one for all. For the meeting-side translation of these components into a non-technical client narrative, see how to report attribution to non-technical clients.
FAQ
What should an agency reporting dashboard include?
A complete agency ad reporting dashboard should include 9 components: blended ROAS (using reconciled revenue, not summed platform reports), Marketing Efficiency Ratio with a trendline, reconciled CAC by channel after deduplicating cross-platform credit, a side-by-side attribution model breakdown (last-click, first-touch, multi-touch), cohort retention and LTV by acquisition month, churn risk and at-risk revenue, automated anomaly alerts, white-label branding, and a forward recommendations panel with 3-5 prioritized actions for the next 30 days.
How is blended ROAS different from platform ROAS?
Platform ROAS is what each ad network reports individually, based on conversions that network claims credit for. Blended ROAS is total tracked revenue divided by total ad spend across all channels. The gap matters because platforms double-count: if a customer touched both Meta and Google before purchasing, both platforms report the full sale in their own ROAS. Summed platform ROAS is fiction. Blended ROAS, calculated from reconciled revenue, is the only number that can’t be double-counted.
Should agencies white-label client dashboards?
Yes, white-labeling is table stakes for any agency reporting tool in 2026. Your client should never see a vendor logo on their dashboard. The agency’s brand, colors, and custom domain belong on every client-facing surface. The deeper question is whether the underlying data is reconciled. White-label branding on top of platform-reported data is the page-1 trap. White-label on top of reconciled attribution is the actual product.
What is the best reporting cadence for client dashboards?
Three cadences run in parallel. Live refresh for the agency team during business hours (every 15 minutes), so anomalies surface in real time. Weekly automated send to the client every Monday morning, with a plain-English summary email and a dashboard link. Monthly strategic review meeting, where the agency walks the client through the forward recommendations panel and aligns on the next 30 days. Quarterly business reviews layer on top for retention check-ins.
How often should the dashboard be updated?
Refresh every 15 minutes during business hours so anomaly alerts catch problems within hours. Send a weekly client summary (Monday morning). Internal agency review of every account should happen weekly. Daily glance + weekly client send + monthly strategic review is the rhythm.
Closing: A Dashboard Built on Lies vs. a Dashboard Built on Truth
Nine components. Twelve tiles. Three cadences. Five mistakes to avoid.
The position is simple. A dashboard built on platform self-reports is a marketing artifact. It looks like work. It functions like a screenshot service with a logo. A dashboard built on reconciled attribution is a business tool. One defends a retainer. The other fills a folder until cancellation day.
The page-1 dashboard tools have spent five years competing on the wrong feature. White-label branding, integration count, template variety. They didn’t fix the data. That’s the opening. An agency that ships a dashboard with the components above, sitting on top of reconciled attribution, offers something the AgencyAnalytics customers literally can’t buy from AgencyAnalytics.
Build it once. Ship it to every client. Stop losing retainers to unprovable results.
For deeper coverage, see our agency attribution guide , the Google Ads bidding and attribution interaction breakdown , and the best attribution tools comparison .
Hyros offers an agency plan with white-label dashboards built on top of reconciled attribution. See how 4,000+ businesses run every client ROAS through one login → Book a demo
Related in This Series
Cluster: Agency
More from the Agency series:
- Multi-Client Attribution Reporting for Agencies
- Google Ads Bidding and Attribution Interaction
- The 7 Best Ad Attribution Tools in 2026
- How to Report Attribution to Non-Technical Clients
Standalone Summary
A 2026 agency ad reporting dashboard needs 12 tiles, not the usual three. Most templates ship blended ROAS, spend, and conversions. That covers the surface but leaves the client uncertain on the questions that actually matter: is the channel mix working, is CAC settling, is attribution underreporting, is the account at retention risk. The full stack is blended ROAS, MER, platform-reported ROAS per channel, reconciled CAC, attribution model breakdown (last-click vs first-click vs data-driven side by side), incrementality test results, view-through inflation flag, cohort LTV trend, churn-risk indicator, white-label header, comment box, and an explicit “what changed this period” note. The platform layer underneath has to support multi-client switching, role-based access, white-label branding, scheduled exports, and a comments stream so back-and-forth lives in one place. Most agencies bolt this together from Sheets and screenshots; the cost is hours per client per week and a brittle review meeting. Hyros customers running this loop typically see 29-33% more conversions surfaced versus native platform reporting based on the aggregated Trustpilot dataset of 600+ reviews, so the dashboard layer becomes the place where the agency proves the gap is real to the client.