

How to Report Attribution to Non-Technical Clients (Without Losing the Room)
TL;DR
- Reporting attribution to non-technical clients is a translation job, not a data job
- Lead with blended ROAS and MER, show last-click and multi-touch side by side, script the eight objections
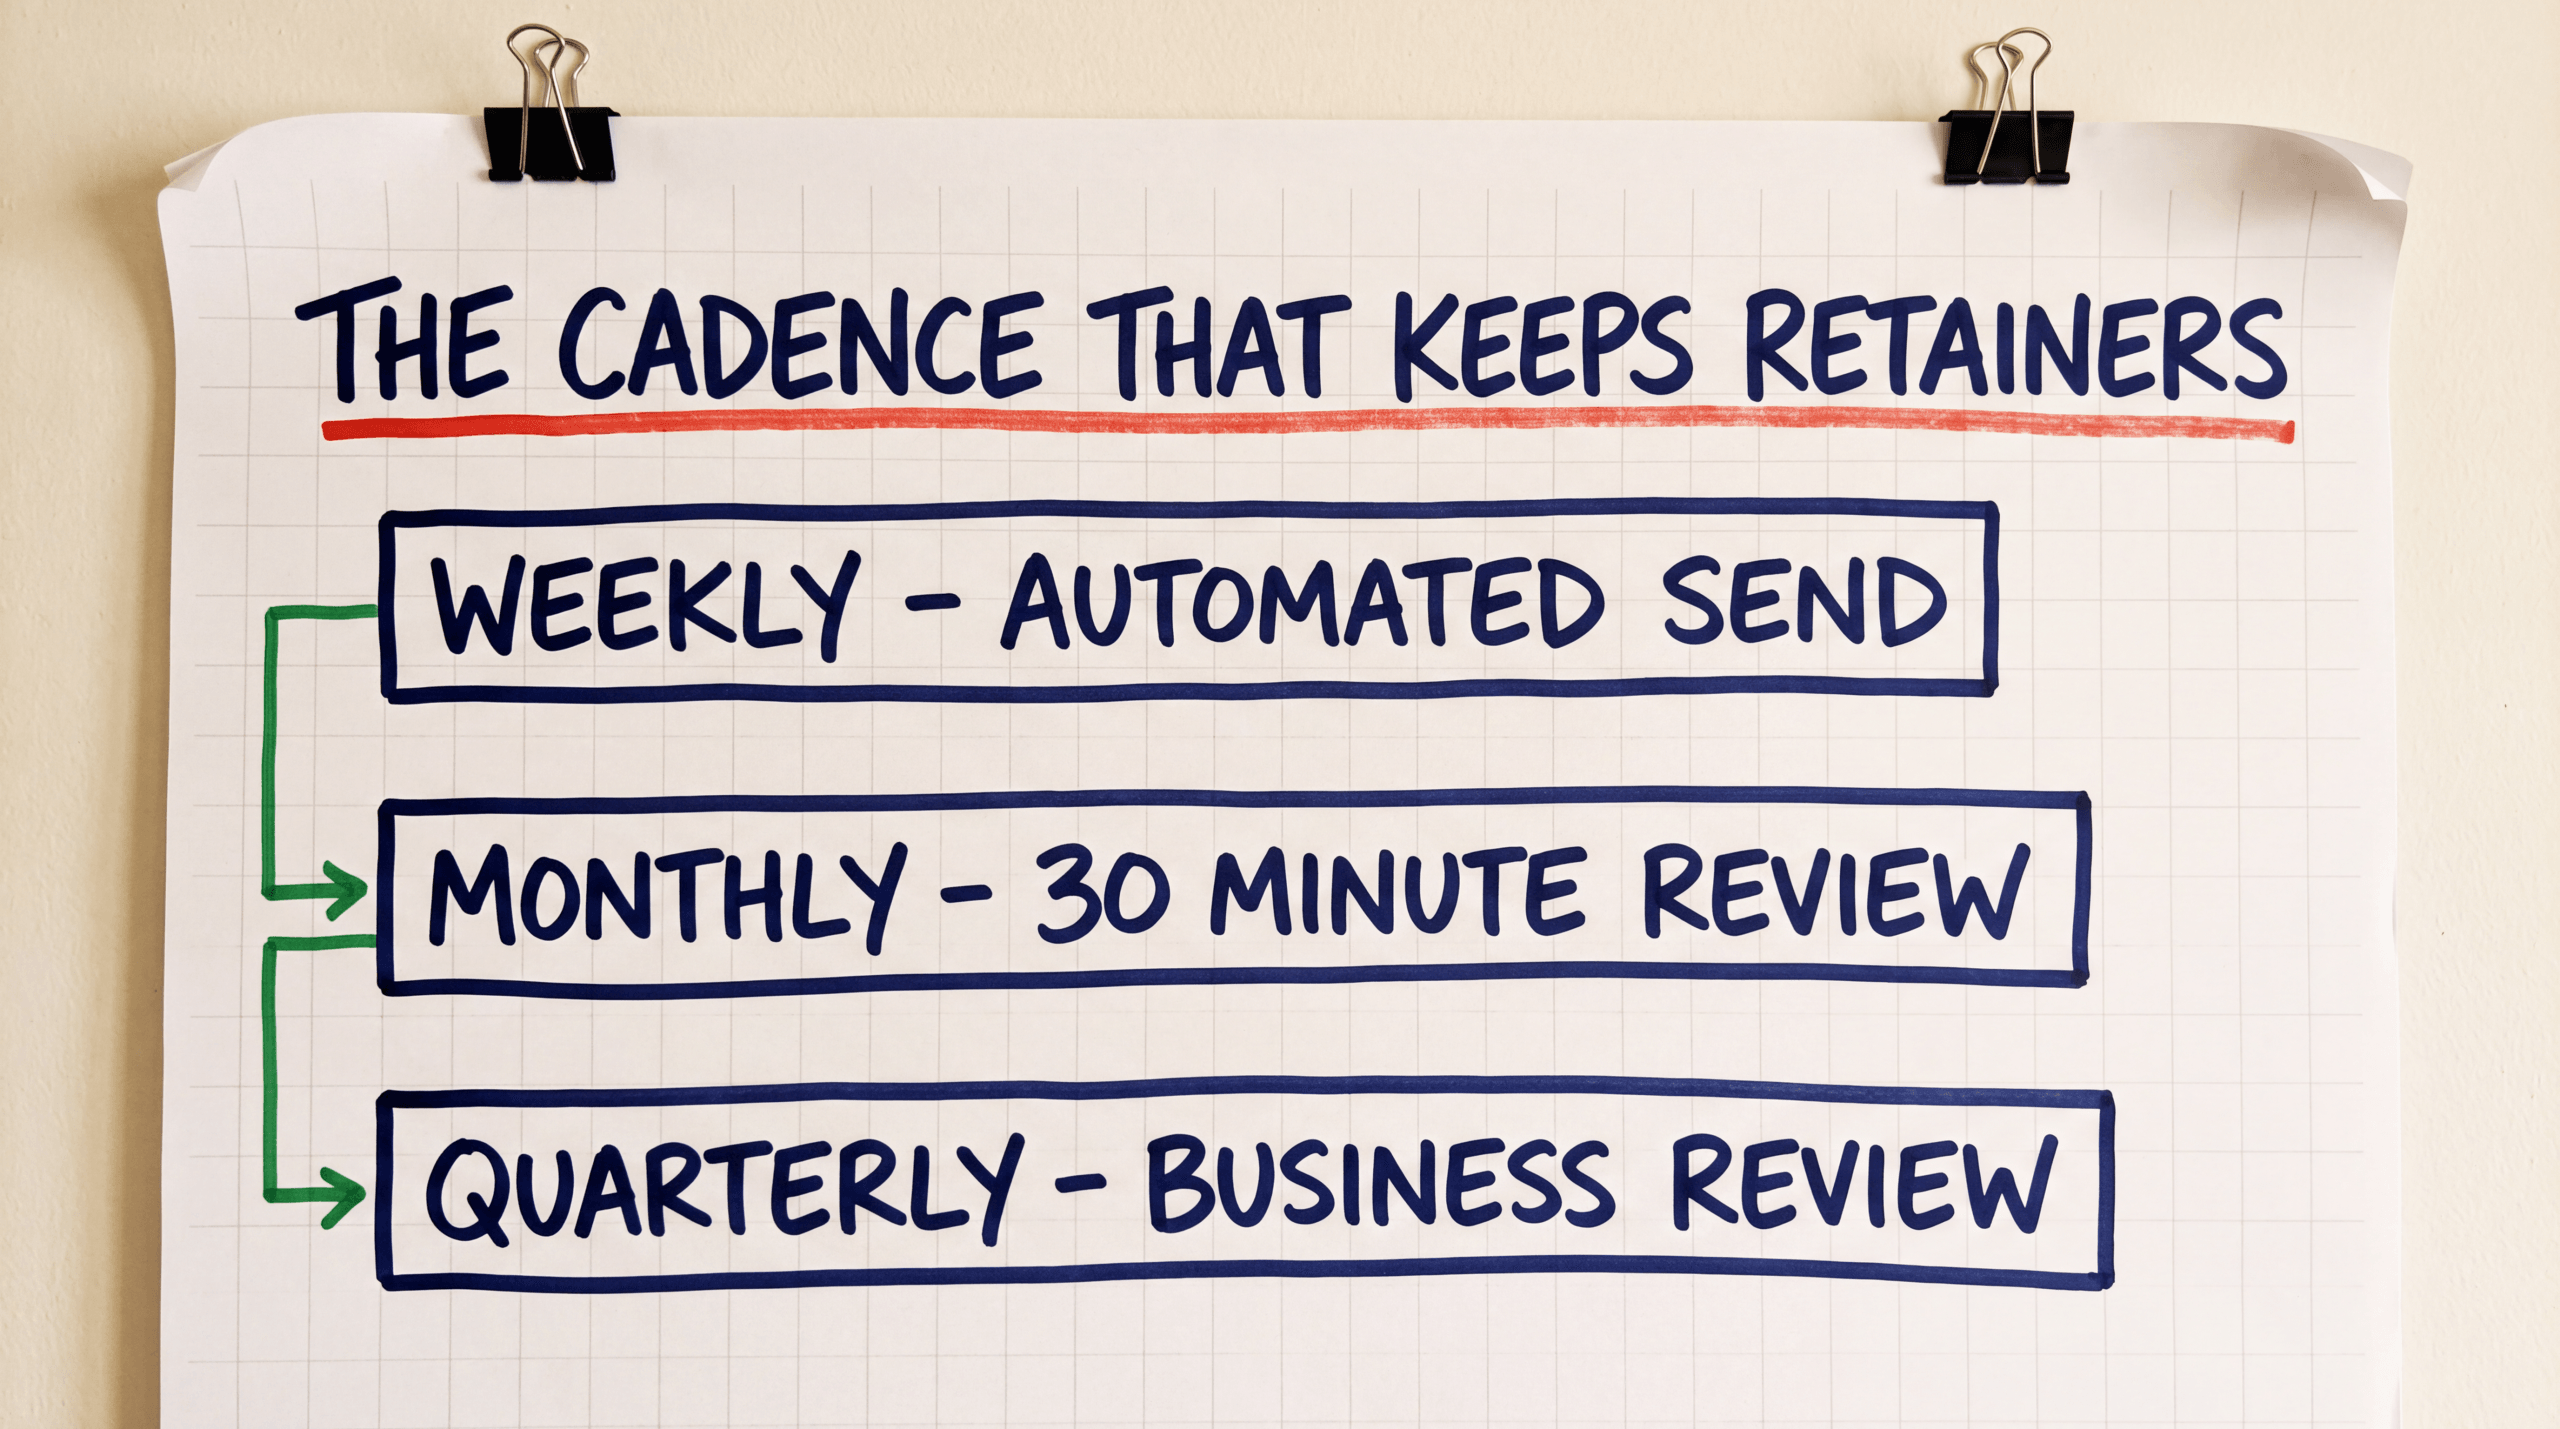
- Run weekly automated sends, monthly 30-minute reviews, and quarterly business reviews
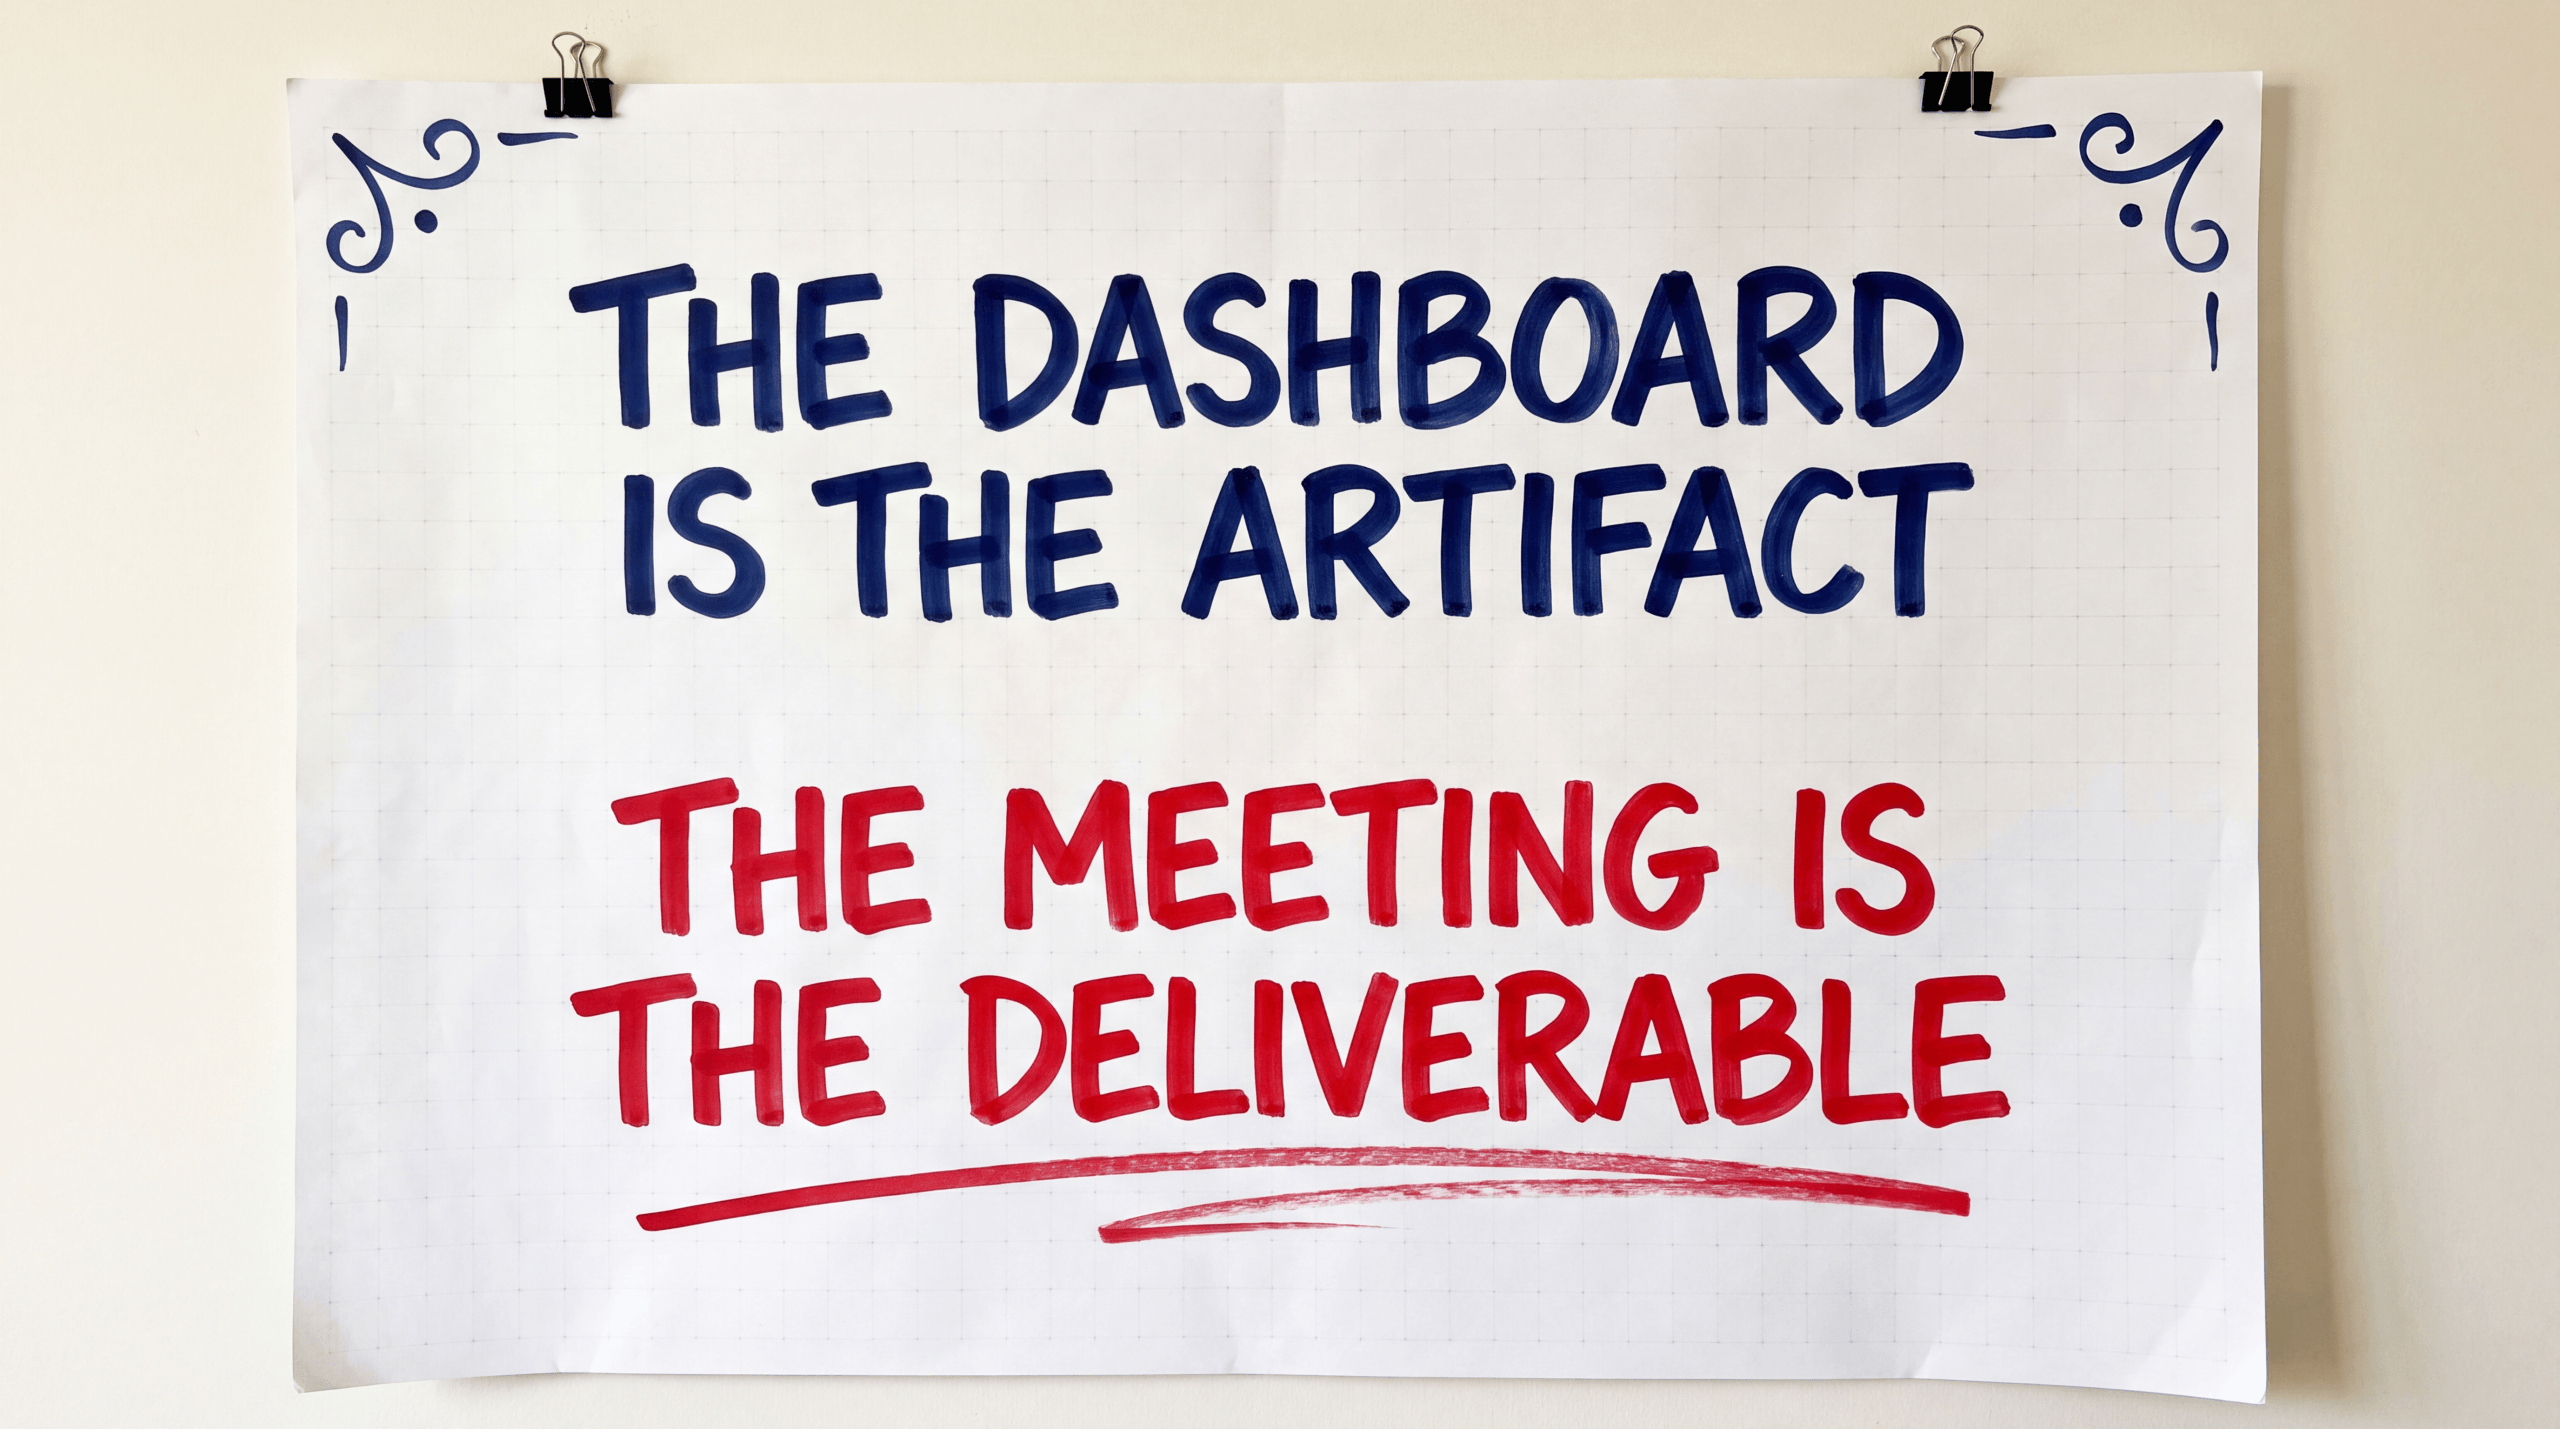
Reporting attribution to a non-technical client is a translation job, not a data job. Stop reading model names off the dashboard. Lead with blended ROAS and Marketing Efficiency Ratio (MER), show last-click and multi-touch side by side so the client picks the lens, hand them a one-page cheat sheet they can keep between meetings, and script your answers to the eight objections that come up every time. Run a weekly automated send, a monthly thirty-minute strategic review, and a quarterly business review. The dashboard is the artifact. The meeting is the deliverable.
Why Most Attribution Meetings Lose the Room in the First Five Minutes
Every agency I have audited delivers accurate data and still loses retainers. The numbers in the report are correct. The meeting around the report is broken.
Eleven Writing named the problem in a 2025 post on attribution reporting challenges: clients nod politely while not understanding the difference between last-touch and time-decay. Their article flags the comprehension gap and stops there. Every page-1 result on “attribution reporting” defines models. None of them scripts the conversation. That gap is the opening for this article.
The stakes are concrete. Annual agency churn runs 18 to 42 percent depending on the model, with retainer-based shops near the low end and project-based shops at the high end. The variable that pushes a retainer agency from 18 toward 42 is unrenewed contracts, and unrenewed contracts trace to meetings the client never understood. I have sat in those meetings on both sides of the table. The agency walks through six dashboards, the client smiles and says “great work,” and the next morning quietly opens a Google Doc to draft a cancellation email. The dashboard was fine. The meeting was the deliverable that failed.
For the upstream mechanics every agency should already be running on, see Multi-Client Attribution Reporting for Agencies.
The One Question the Client Is Actually Asking
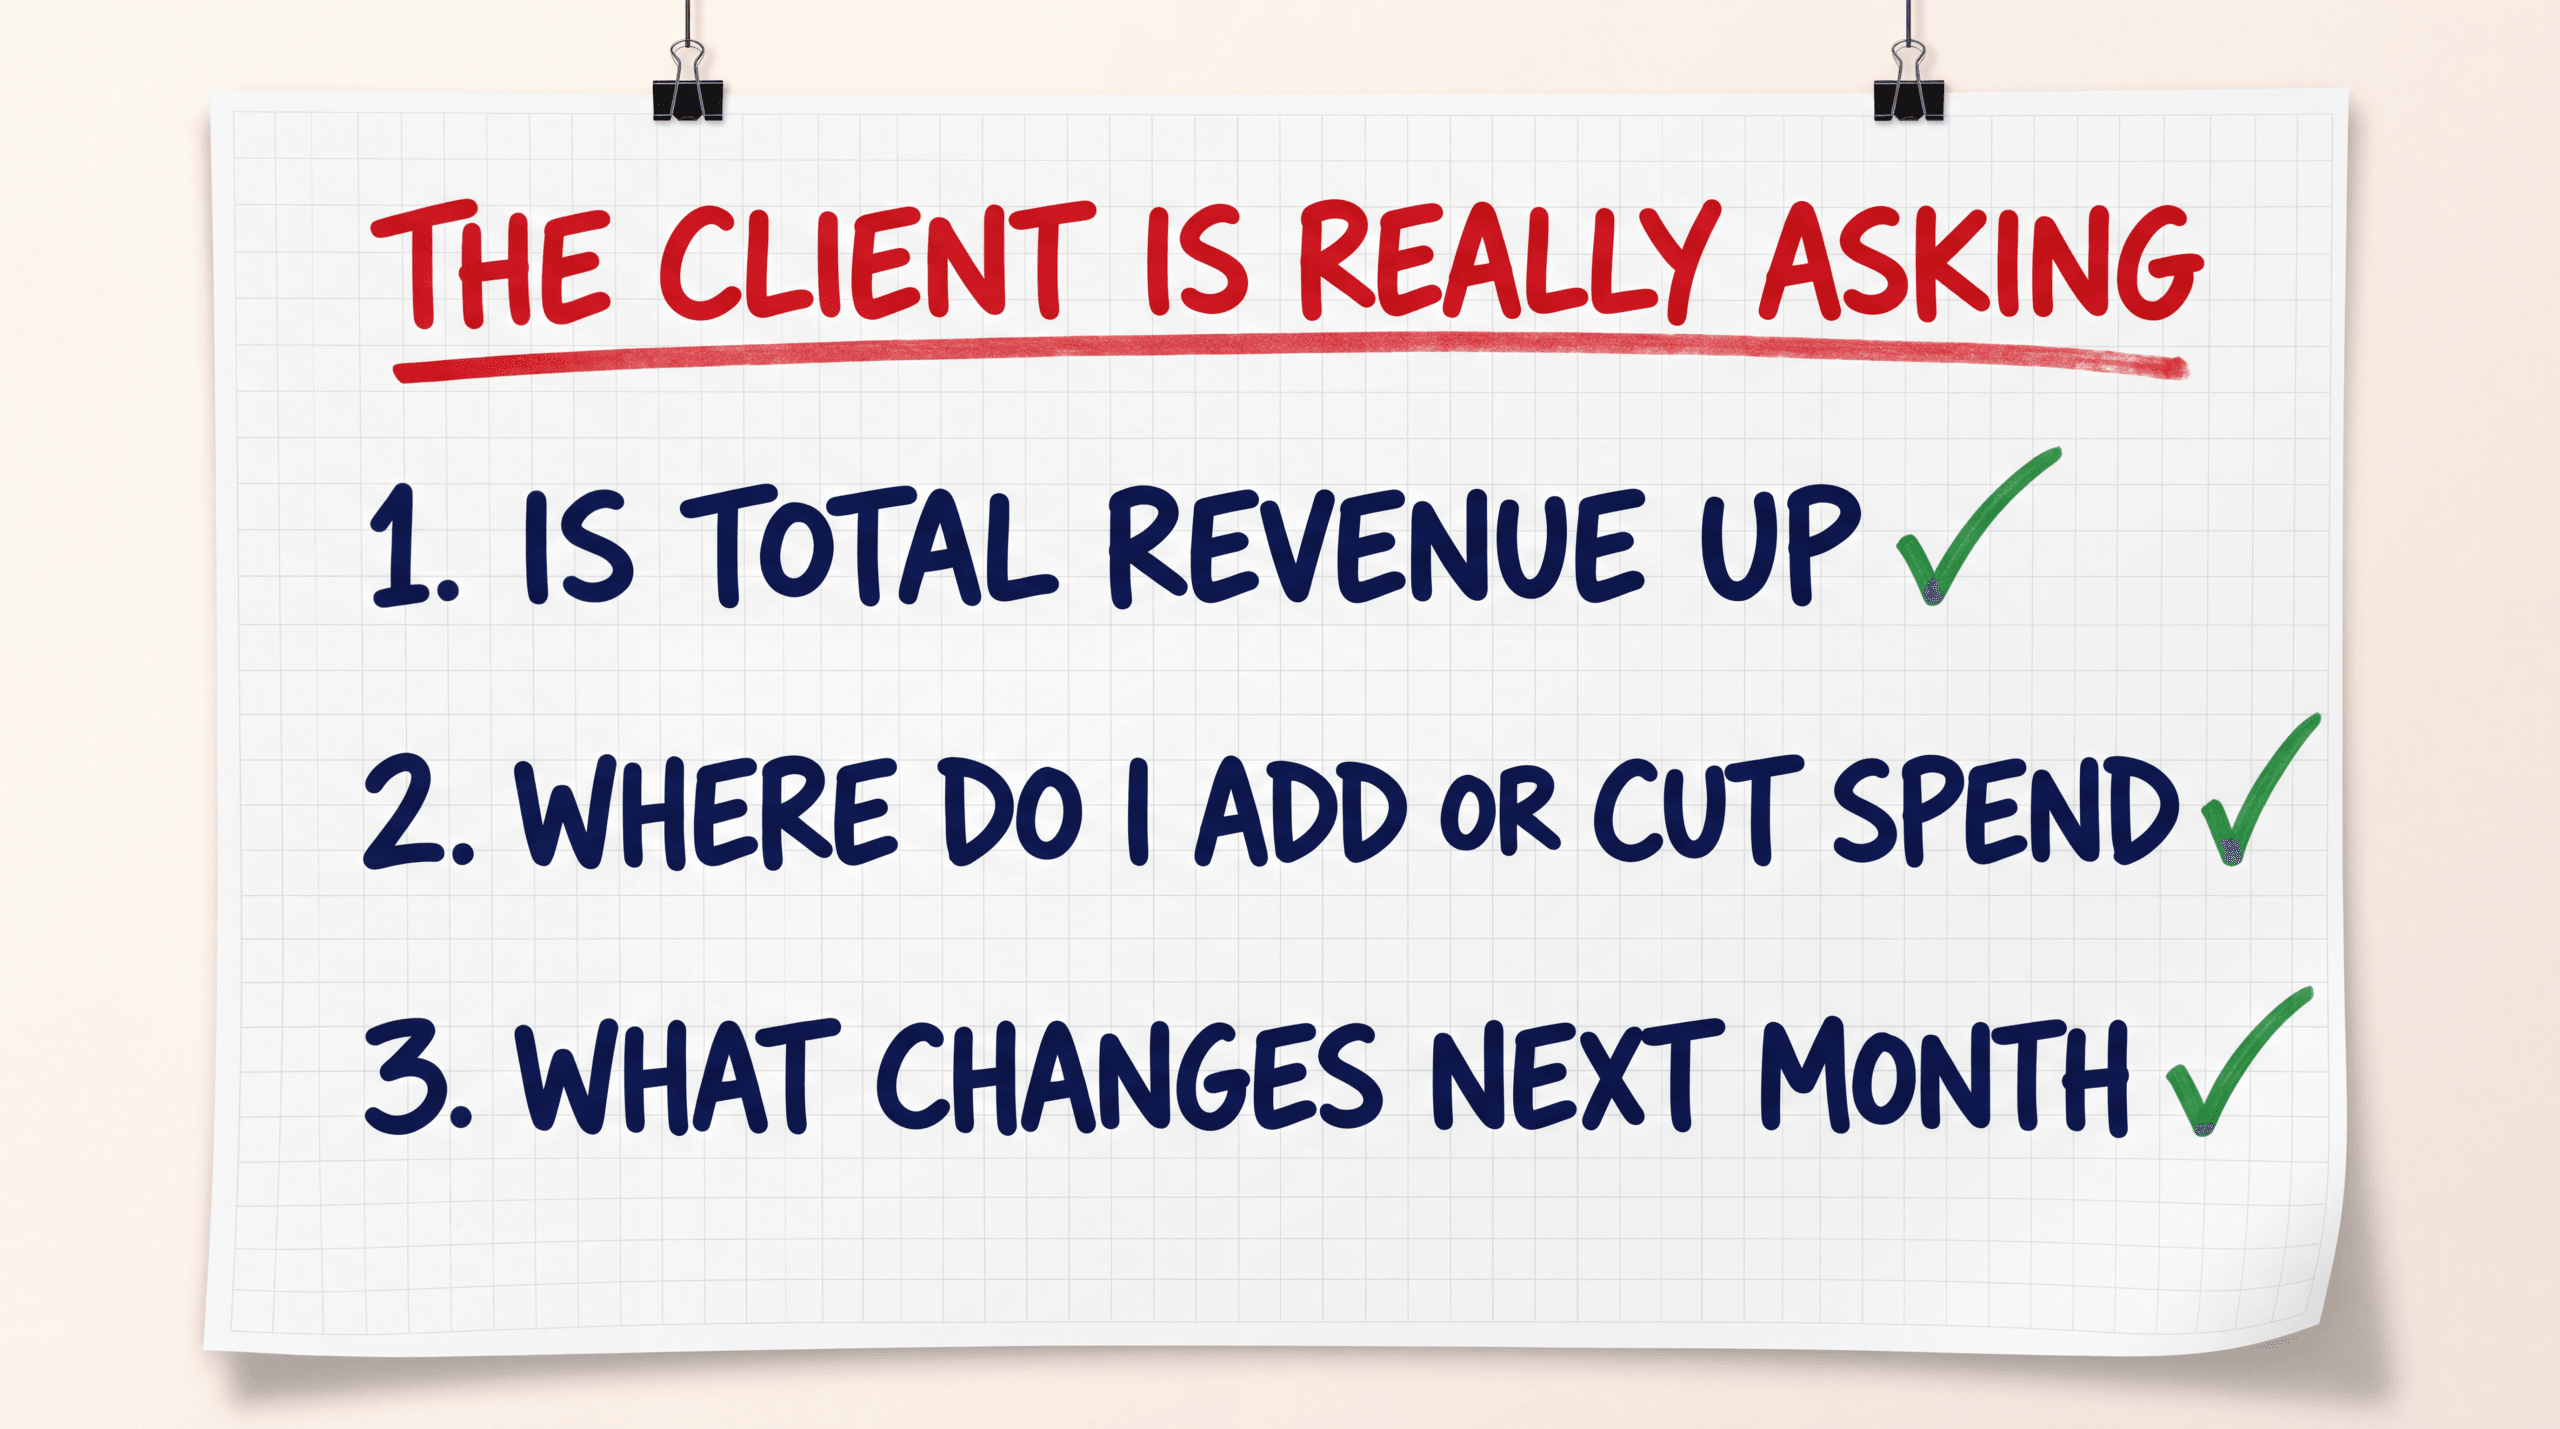
The client is not asking which attribution model you use. The client is asking three questions, in this order: is total revenue up, where should I add or cut spend, and what changes next month. Every tile on the dashboard either answers one of those three or it does not belong in the meeting.
Run this filter on your own template. Point at any component and ask which of the three questions it answers within ten seconds. If you cannot do it cleanly, the component is failing the meeting. It might still belong somewhere in your stack (engineering diagnostic, internal reporting, compliance record) but it does not belong in front of the buyer.
For the underlying component checklist that maps to these three questions, see the sibling piece What to Include in an Agency Ad Reporting Dashboard.
Lead with Blended ROAS and MER, Not with Model Names
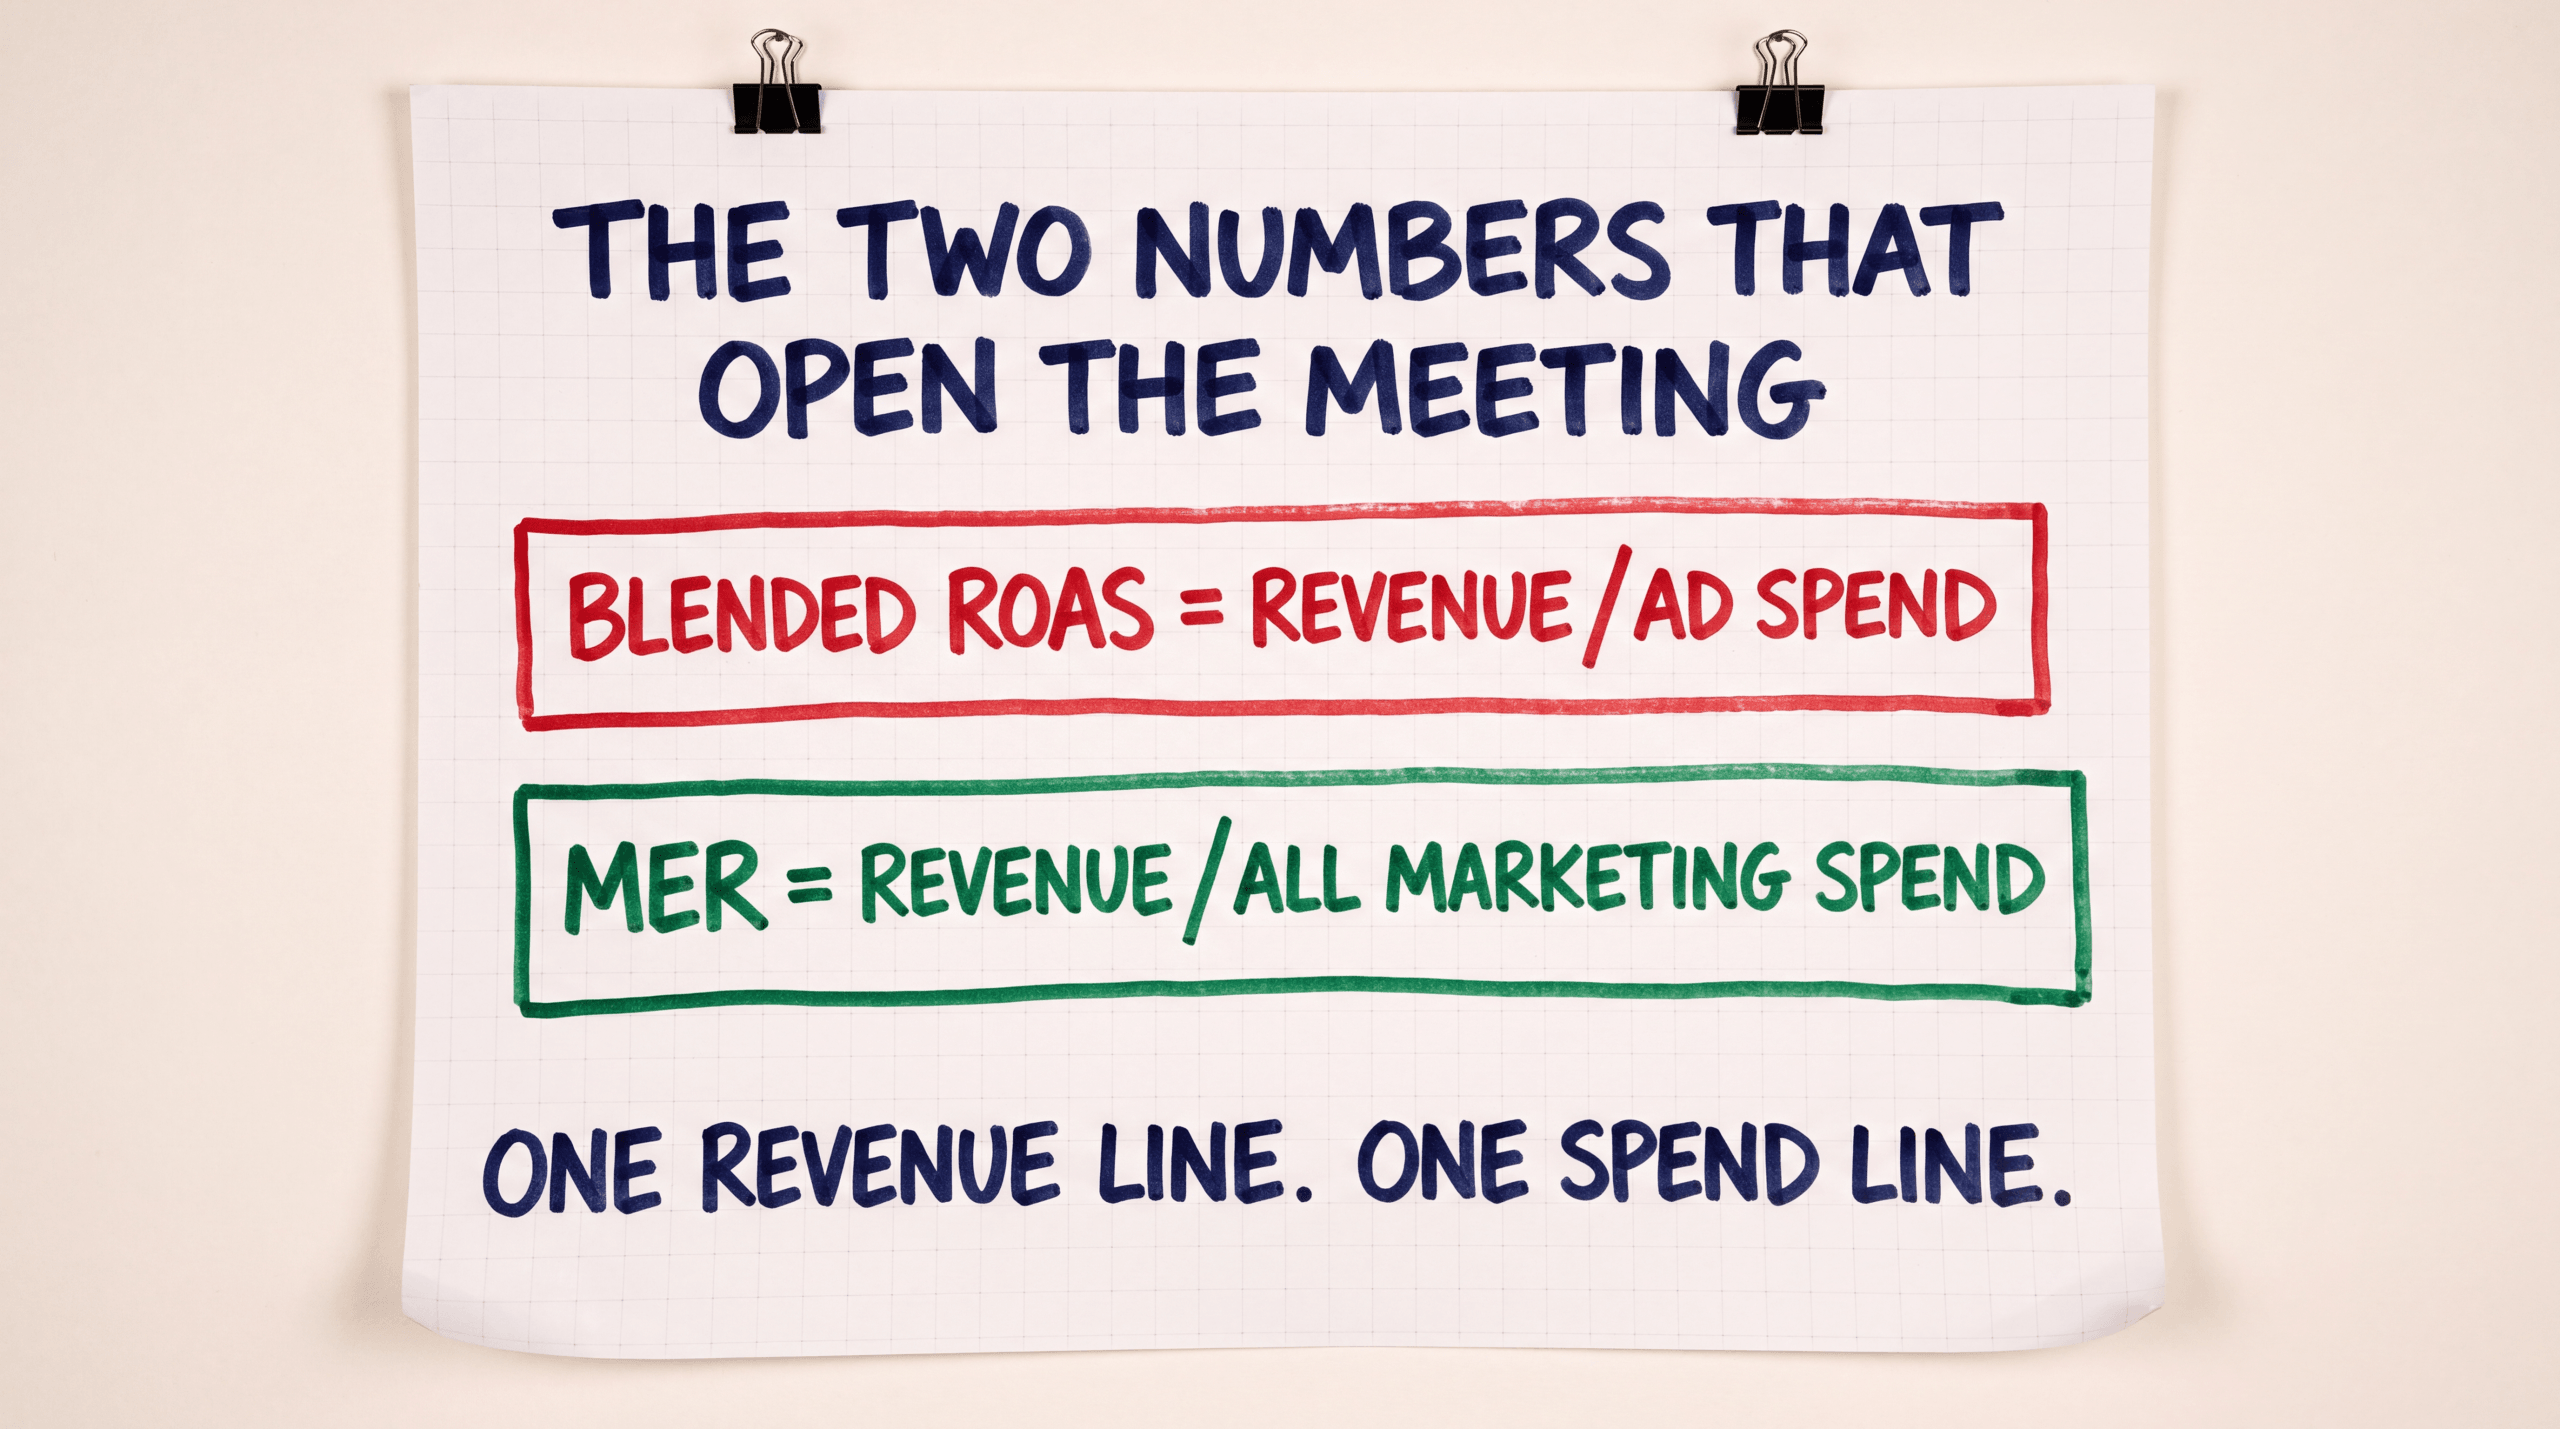
The first ninety seconds of the meeting set the tone for the next thirty minutes. Open with blended ROAS and MER. Save model breakdowns for later, if the client asks. Most clients never ask.
Blended ROAS is total tracked revenue divided by total ad spend across every channel. MER is total revenue divided by total marketing spend, including paid, organic, tools, and creative production. These two numbers share a property no platform metric has: they cannot be double-counted across channels. One revenue line, one spend line. The client cannot argue with arithmetic.
Stop opening meetings with Meta’s reported number. Open with the only number Meta cannot inflate. Hyros tracks $3.5 billion in revenue across more than 4,000 customers using a unique identifier (UID) layer that reconciles platform overlap into one revenue figure. By the time the client asks about Meta’s number, you have already established that platform self-reports are the secondary view. That sequence change saves more retainers than any chart update.
For the deeper math on blended ROAS, see Blended ROAS: Definition and Calculation. For why platforms over-claim in the first place, see Meta Ads Reporting and Attribution Accuracy.
When to Use Last-Click vs Multi-Touch in the Conversation
Model choice is a conversation tool, not an academic preference. Pick the model that answers the question on the table. A decision tree, three branches:
Use last-click when the sales cycle is short (under seven days from first ad to purchase), the channel mix is dominated by direct response, or the client asks “which ad worked.” Last-click maps cleanly to single-decision purchases. The model is wrong about long journeys, but it is right about high-velocity ones.
Use multi-touch when there are three or more touchpoints before purchase, the channel mix blends paid and organic, or the client asks “should I cut Meta.” Multi-touch is the honest answer for businesses where awareness, consideration, and conversion each happen on different channels. It is also the model that protects top-of-funnel spend from premature cuts based on last-click reporting.
Use first-touch when the client is making top-of-funnel scaling decisions, the question is “what is bringing new people in,” or the conversation is about brand-building budgets. First-touch over-credits awareness channels, but for the specific question of “where do new customers discover us,” that bias is the feature. When the client asks about channels with no click event at all (podcasts, word of mouth, organic social), the tracked view alone will not answer the question. See post-purchase surveys vs tracked attribution for the discovery-side layer that pairs with tracked numbers in the meeting.
The trap most agencies fall into is committing to one model in month one and never moving off it. Switching models mid-quarter is fine. Hiding the switch is the mistake. When you change which lens you are using, name the switch out loud and explain why. “Last month we anchored on last-click because we were testing creatives. This month we are anchored on multi-touch because we are deciding next quarter’s channel mix.”
For the mechanics of each model, see First-Click vs Last-Click Attribution and Multi-Touch Attribution.
The 8 Client Objections That Come Up Every Time (Scripts)
Every agency-client meeting on attribution surfaces some version of these eight objections. The right answer is the same answer every time. Memorize the scripts. Stop improvising.
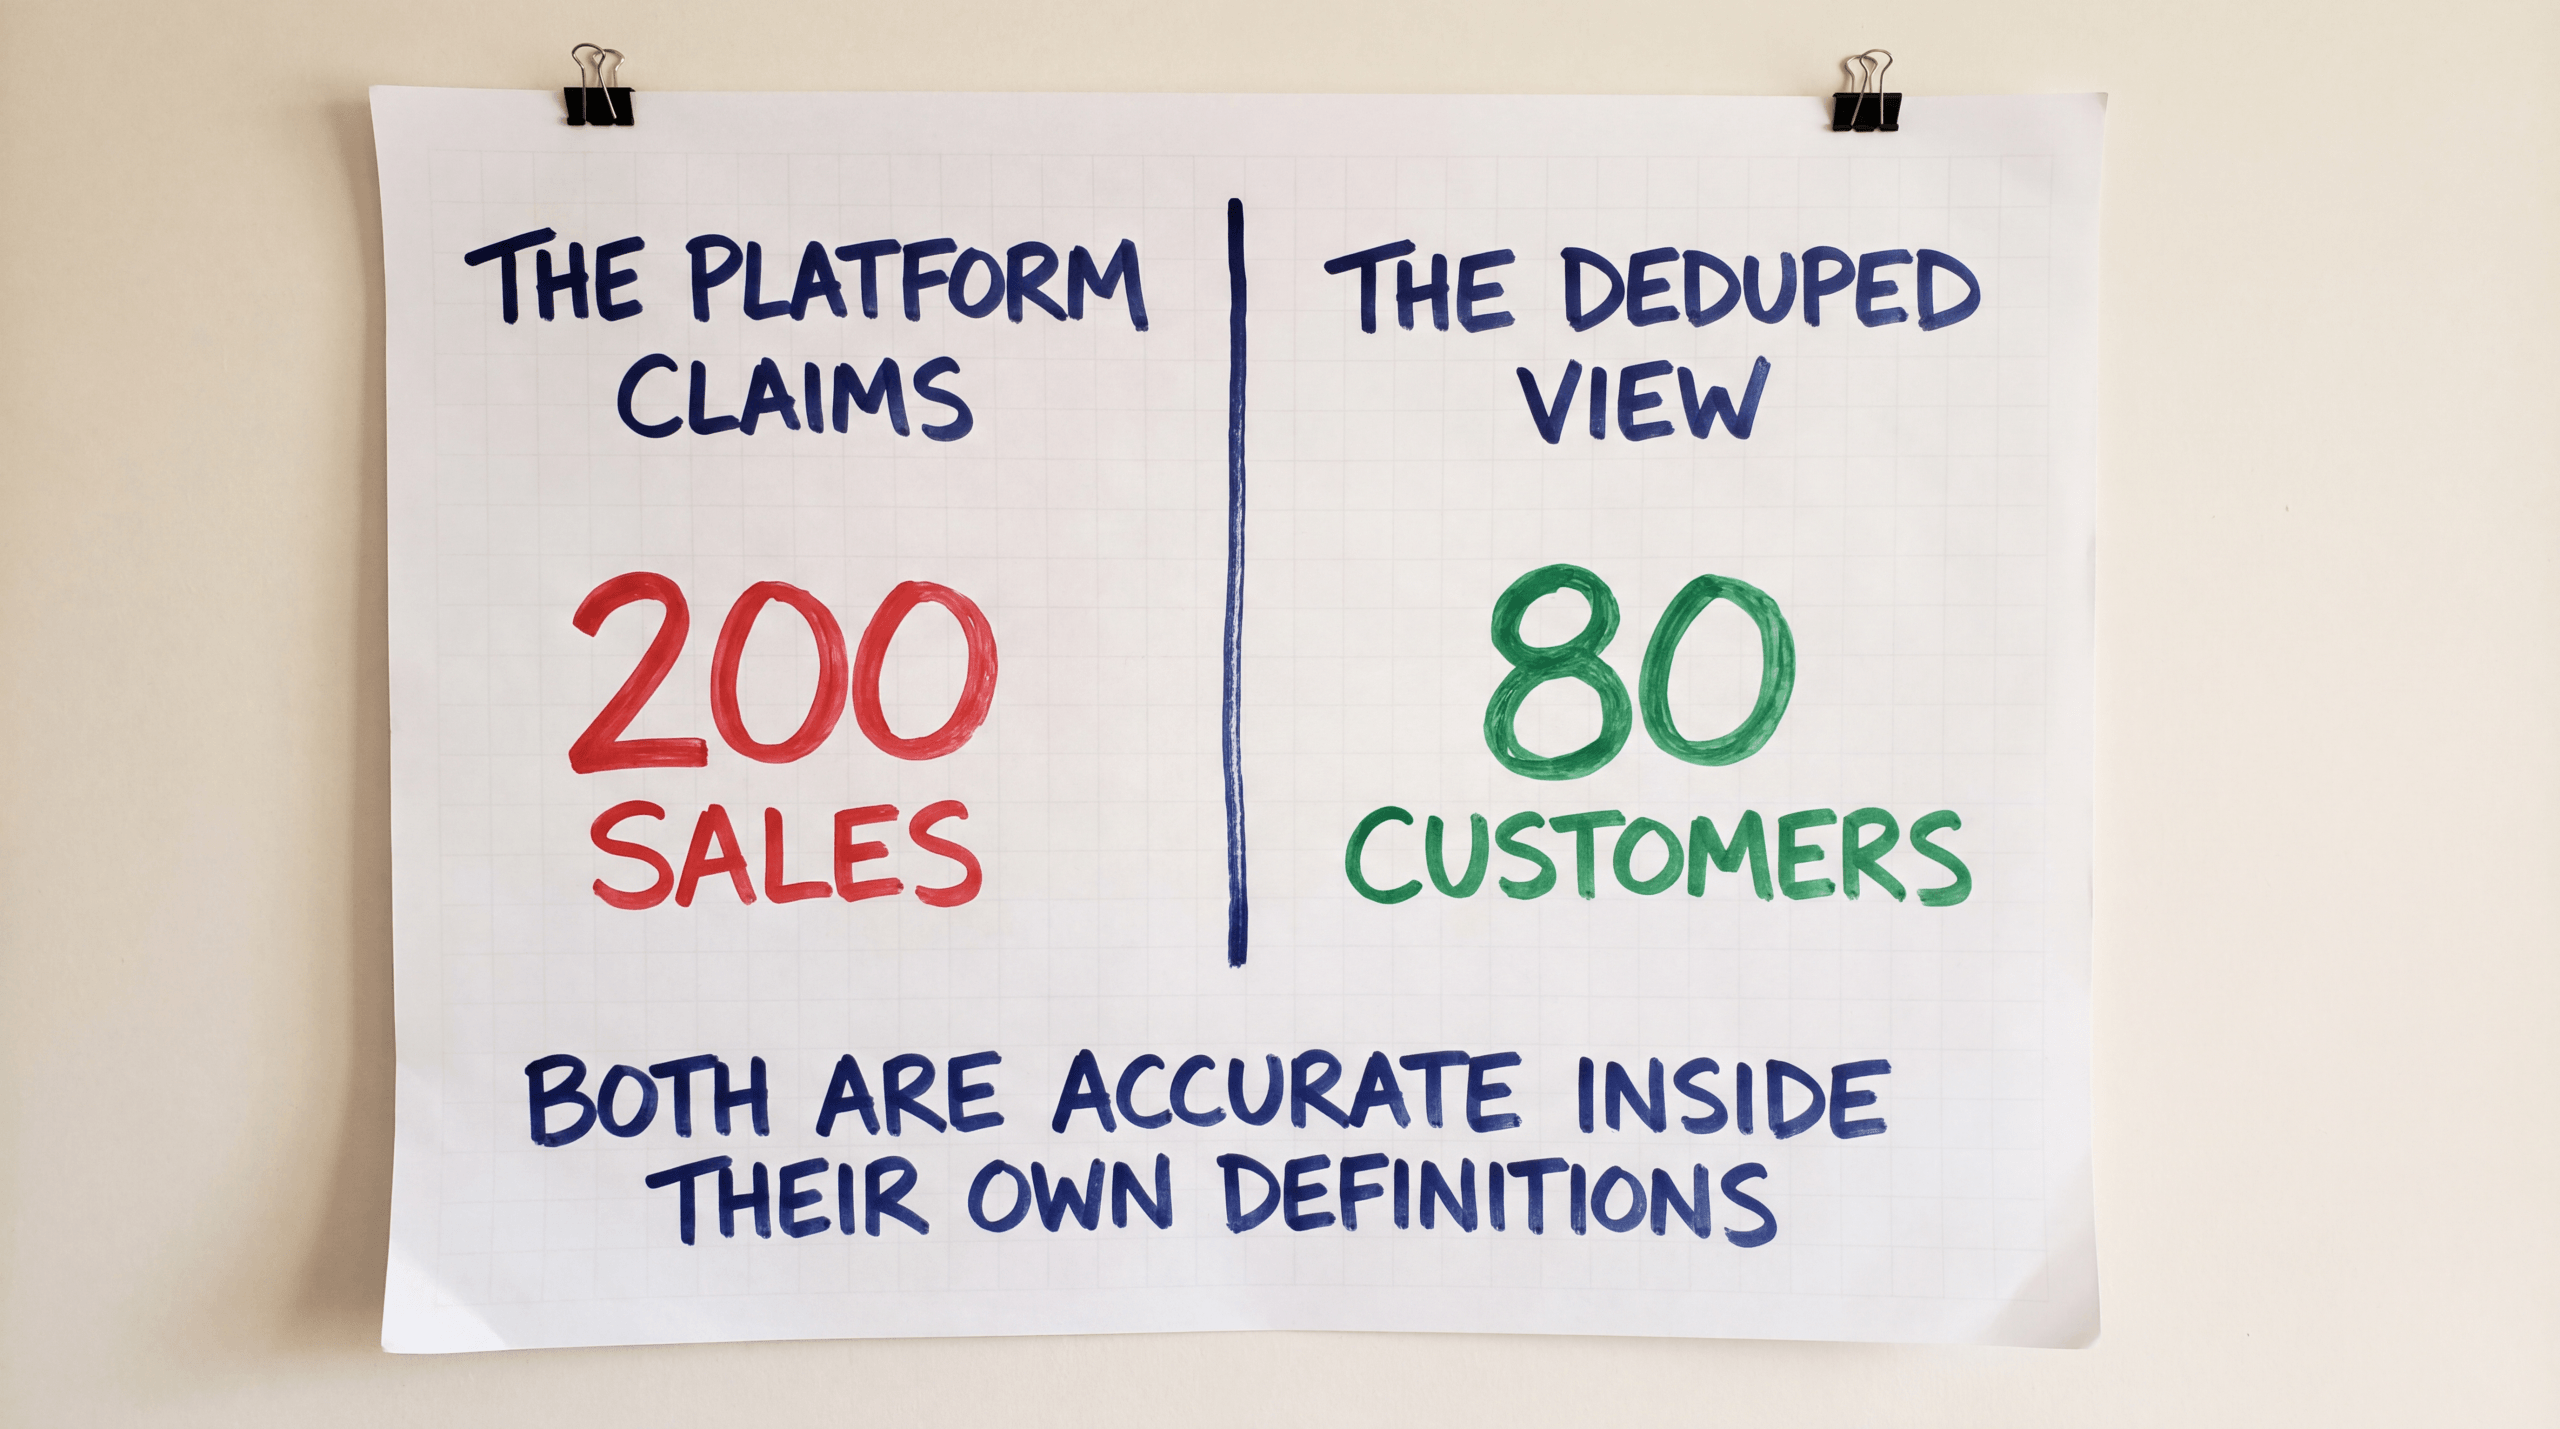
1. “Facebook says it drove 200 sales but Hyros only shows 80. Who is right?”
Wrong answer: “Well, attribution is complicated, all models have tradeoffs…” (You just told the client to distrust everything that follows.)
Right answer: “Both numbers are accurate inside their own definitions. Facebook counts every sale where a user saw or clicked a Facebook ad in the 7-day click and 1-day view window, regardless of which other channels touched that user. Our number counts the unique customers we can attribute to Facebook as the dominant driver after deduplicating overlap with Google, email, and organic. Facebook is reporting what Facebook saw. Our number is reporting what actually happened across every channel. The 29 to 33 percent gap is the size of the deduplication, and it is consistent with the gap CheckThat.ai measured across Hyros’s 601 reviewed implementations.” For the vertical-by-vertical version of this gap, point clients at the 2026 attribution benchmarks.
2. “Why don’t the platforms agree with each other?”
Wrong answer: “Because their algorithms are different.” (True but unhelpful. The client needed a reason they can repeat to their CFO.)
Right answer: “Each platform reports the sales where it saw the user. The platforms cannot see each other. If a customer clicks a Google ad and a Meta ad before purchasing, both platforms count the full sale in their own reporting. The platforms are not wrong. They are incomplete. Summed platform reports almost always exceed actual revenue, sometimes by 150 to 250 percent. The dashboard you are looking at is the reconciled view: one customer, one purchase, one attributed source.”
3. “Is multi-touch attribution just guessing?”
Wrong answer: “It uses an algorithm to assign credit…” (You sound defensive.)
Right answer: “It is a structured allocation, not a guess. Last-click is also an allocation, it just happens to allocate 100 percent of credit to the final touchpoint. That is not more accurate, it is more arbitrary. Multi-touch follows a rule (linear, time-decay, position-based, or data-driven) consistently across every customer journey. The rule is visible, the math is repeatable, and you can switch lenses to compare. Last-click hides the journey. Multi-touch shows it.”
4. “Last month you used last-click, this month you switched. What changed?”
Wrong answer: “We are always testing new approaches…” (Sounds like you do not know what you are doing.)
Right answer: “Last month we used last-click because we were running creative tests and last-click is the cleanest lens for short-horizon comparisons. This month we are using multi-touch because we are deciding next quarter’s channel mix and multi-touch is the honest lens for that decision. Different question, different lens. The numbers underneath are the same. The lens changes based on what you are deciding.”
5. “Why is my CAC higher in your dashboard than in Meta Ads Manager?”
Wrong answer: “Meta is over-counting their conversions.” (You just made it sound like Meta is the bad guy. The client uses Meta. Bad framing.)
Right answer: “Meta is counting conversions Meta saw. We are counting unique acquired customers after deduplicating against Google, email, and organic. When a customer touched three channels before purchasing, Meta gets full credit in Meta Ads Manager, Google gets full credit in Google Ads, and email gets full credit in your ESP. Our dashboard counts the customer once. That is why Meta’s reported CAC is lower than ours: Meta is dividing by a higher conversion count than the actual unique customer count.”
6. “If view-through is fake, why does Meta count it?”
Wrong answer: “It is not fake exactly…” (Yes it mostly is. Just say so.)
Right answer: “View-through is the count of users who saw a Meta ad in the past 24 hours and converted later, even if they never clicked. Meta counts it because Meta has the data to count it. Whether that view actually drove the conversion is a different question. The current Meta default window is 7-day click plus 1-day view. The 1-day view contributes to Meta’s reported number but rarely tracks back to a measurable lift when you run an incrementality test. We report view-through separately so you can see it, but we anchor the strategy on click-driven conversions because those are the ones we can verify.”
7. “Can we just trust GA4?”
Wrong answer: “GA4 is fine for analytics but…” (Too soft.)
Right answer: “GA4 reports what GA4’s tag sees in the browser. Three things break that visibility: iOS Safari clears most cookies in seven days, around 35 to 37 percent of iOS users opt in to tracking (the rest are invisible to client-side tags), and any user who switches devices mid-journey looks like two different visitors. GA4 is useful for behavior analysis on-site. It is not the source of truth for which ads drove revenue, because the tag does not see most of the journey. The dashboard you have here uses server-side tracking, which captures the events the browser layer misses.”
8. “Why am I paying you to tell me what Meta already tells me?”
Wrong answer: “Our reporting goes deeper…” (Weak, and also defensive.)
Right answer: “Meta tells you what Meta drove. We tell you what every channel drove, deduplicated, with the recommendations panel on what to do next month. If our dashboard agreed with Meta’s dashboard, you would be right to fire us. The reason you pay a retainer is the gap between the two views and the strategy that comes out of that gap. Look at the channel mix waterfall and the forward recommendations. That is the deliverable.”
The One-Page Client Attribution Cheat Sheet
After the first meeting with every new client, hand them a printable one-pager. They keep it. They reference it between meetings. It cuts the next month’s “wait, what does multi-touch mean again” emails to zero.
The cheat sheet has six tiles, three across and two down:
Tile 1: The four attribution models in plain English.
- First-touch: credit the ad that first introduced the customer.
- Last-touch: credit the ad that closed the sale.
- Multi-touch: split credit across every ad in the journey.
- Blended: ignore models, divide total revenue by total ad spend.
Tile 2: Blended ROAS in one sentence. Total tracked revenue divided by total ad spend across all channels. The only ROAS number that cannot be double-counted.
Tile 3: MER in one sentence. Total revenue divided by total marketing spend, including paid ads, organic, tools, and creative production. The CFO metric.
Tile 4: The three questions this dashboard answers.
- Is total revenue up.
- Where should I add or cut spend.
- What changes next month.
Tile 5: How to read the three primary dashboard tiles. A two-sentence explainer for blended ROAS trendline, MER trendline, and reconciled CAC by channel. No acronyms beyond those three.
Tile 6: When to email the agency vs wait for the next meeting. A short list. “Email us when: anomaly alert fires, weekly send is missing a metric, you have a budget decision before the next meeting. Wait for the meeting when: you want strategy recommendations, year-over-year comparisons, channel allocation decisions.”
A client who can find their own answer between meetings stops asking the agency to re-explain. That is retention.
The cheat sheet ships as a PDF or printable Google Doc alongside the dashboard. If you cannot produce the file in the first onboarding week, do not promise it in the kickoff deck. Dead asset links erode trust faster than missing assets.
For the dashboard’s underlying components that this cheat sheet maps to, see What to Include in an Agency Ad Reporting Dashboard.
How to Run the Live Meeting (Five-Minute Opener + Cadence)
Structure is the difference between a thirty-minute meeting that earns the retainer and a sixty-minute meeting that lost it ten minutes in. The opener script below works for monthly strategic reviews. Tighten or expand to fit the slot.
Minute 0 to 1: State the headline. “Last month was up 14 percent in blended ROAS quarter over quarter. MER held steady at 3.2. Top channel was Meta UGC, weakest channel was Google branded search after we cut the bottom-quartile creatives. Net, the trajectory is positive and we have three recommendations for next month.” That is the answer to “did the money work.”
Minute 1 to 2: Walk the top row. Point at blended ROAS, MER, reconciled CAC, churn risk. Four numbers, one sentence each. Do not drill down unless asked. The top row answers the executive’s “show me the score.”
Minute 2 to 3: Anchor the channel decision. “Here is where we are putting spend next month and why.” Show the channel mix waterfall and the reconciled CAC by channel. Name the channels you are scaling and the channels you are cutting. This is the “where should I add or cut spend” answer.
Minute 3 to 5: Present the forward recommendations. Three to five prioritized actions. Plain English. No acronyms. “Scale UGC creative #4 to a 1 percent lookalike audience, kill the bottom-quartile Google Search creatives, launch a win-back email to the 90-day non-purchaser cohort.” That is the “what changes next month” answer.
After the five-minute opener, the rest of the meeting is question and answer. The client steers. The dashboard sits open. The drill-downs come up only when asked.
Cadence stack:
| Cadence | What | Who | How long |
|---|---|---|---|
| Weekly | Automated dashboard send (Monday morning) | Client email + agency Slack | Read, not meeting |
| Monthly | Strategic review (forward recommendations) | Client + AM + media lead | 30 minutes |
| Quarterly | Business review (retention, scope) | Client exec + AM + agency lead | 60 minutes |
The weekly send protects against the “we have not heard from you” complaint. The monthly review is where retention is earned. The quarterly review is where scope expansion is sold. Skip any of the three and you are competing on price by default.
For deeper agency mechanics, see Multi-Client Attribution Reporting for Agencies.
What to Leave OFF the Client View
The client view is curated, not exhaustive. The job of the agency is to filter, not to dump data. Five categories of content that technical clients sometimes ask to see and rarely should:
Raw pixel diagnostics. Server-side debug logs, event payloads, browser-console traces. These belong in your engineering channel. If the client sees them, the meeting becomes a troubleshooting session.
Audience overlap matrices. Useful internally, confusing externally. The client will ask why two audiences with 60 percent overlap exist, and the next thirty minutes will be a defense of segmentation logic.
Internal margin math. Your retainer math, effective hourly rate per account, gross margin per client. Exposing these invites a price negotiation every quarter.
Attribution weights to six decimal places. The model assigns 0.3127 of credit to the second touch. The client does not care. The number that matters is the reconciled CAC, not the weight that produced it.
Platform-by-platform conversion-lag tables. Useful for the team setting up the bid algorithm. Useless to the buyer trying to decide whether to scale spend.
If the client asks to see one of these, the right answer is “I can pull that for you separately, and I want to make sure we cover the three forward recommendations first.” Curation is the product. Data dumping is the failure mode.
For the inverse view (what does belong in the dashboard), see What to Include in an Agency Ad Reporting Dashboard.
Common Mistakes Agencies Make in Attribution Meetings (And How to Recover)
Six recoverable mistakes. Every agency owner reading this has made at least three of them. The recovery move is the part that matters.
Mistake 1: Opening with Meta’s number. The client now anchors on Meta as the source of truth and every later correction sounds defensive. Recovery: next month, open with blended ROAS and MER, and frame Meta as a secondary view.
Mistake 2: Switching models mid-quarter without flagging the switch. The client notices that month-three’s number is calculated differently and quietly loses trust. Recovery: name the switch out loud in the meeting and add a footnote on the dashboard (“anchored on multi-touch since March 1 for channel-mix decisions”).
Mistake 3: Apologizing for “model imperfection.” Once you apologize for the numbers, the client distrusts everything that follows. Recovery: stop apologizing. Frame model choice as a deliberate decision based on the question on the table.
Mistake 4: Reading numbers off the screen instead of interpreting them. The client can read. The agency is paid to interpret. Recovery: every tile gets a one-sentence interpretation. “Blended ROAS up 14 percent quarter over quarter, driven by Meta UGC scaling and the bottom-quartile Google Search creatives we killed in mid-April.”
Mistake 5: Saying “it’s complicated” when challenged. That sentence transfers responsibility from agency to client. Recovery: replace “it’s complicated” with the specific mechanism. “Meta and Google both claim full credit when a customer touches both. Our number is the deduplicated count.”
Mistake 6: Letting the client define success at the end of the meeting. “Great work, but I really want to see Meta hit a 4x by next quarter.” If you accept that, you just agreed to a metric you did not choose. Recovery: define success at the start of the quarter, in writing, with the metric the meeting will anchor on.
The mistake is not the disqualifier. The recovery move is the variable that separates retention from churn.
FAQ
How do I explain multi-touch attribution to a client?
Multi-touch attribution splits credit for a sale across every ad in the customer journey, instead of giving 100 percent of credit to the final ad (last-click) or the first ad (first-touch). Explain it as a rule that applies consistently across every journey: “the customer saw a Meta ad, then a Google ad, then converted, so each touchpoint gets a structured share of credit.” Avoid math-heavy explanations in the meeting; show the side-by-side view of last-click vs multi-touch on the dashboard instead so the client picks the lens that fits the question on the table.
Which attribution model should I show clients?
Show all three of last-click, first-touch, and multi-touch side by side, and let the question on the table determine which one anchors the conversation. Last-click anchors short-cycle creative tests, multi-touch anchors channel-mix decisions, and first-touch anchors top-of-funnel scaling. Picking a single model and hiding the others forces the meeting into one lens and erodes trust when reality contradicts the chosen model.
What do you say when a client asks why Meta and your dashboard disagree?
Both numbers are accurate inside their own definitions. Meta counts every sale where Meta saw the user inside the attribution window (currently 7-day click and 1-day view). The reconciled dashboard counts unique customers after deduplicating overlap with every other channel. When a customer touched both Meta and Google before purchasing, Meta counts it and Google counts it, and the reconciled view counts it once. The 29 to 33 percent gap is the size of the deduplication.
How often should I review attribution with clients?
Three cadences in parallel. A weekly automated dashboard send (Monday morning, no meeting) keeps the client informed and surfaces anomalies. A monthly thirty-minute strategic review anchors the forward recommendations and earns the retainer. A quarterly business review covers retention, scope, and budget reallocation. Skipping any of the three forces the agency to compete on price by default.
Should I show the client every attribution model or just one?
Show every model on the dashboard, then anchor each meeting on whichever model fits the question on the table. Showing only one model forces the conversation into a single lens and makes every model switch feel like backtracking. Showing all models with a clear lens-of-the-month annotation lets the client see the journey from multiple angles without losing the thread.
Should I show platform-reported or blended ROAS as the client-facing number?
Lead the meeting with blended ROAS and MER, treat platform-reported numbers as secondary. Blended ROAS is the only ROAS number that cannot be double-counted because there is one revenue line and one spend line. Platform ROAS is what each network reports based on the conversions it claims credit for, which sums to more than 100 percent of revenue when a customer touches multiple channels. Anchoring on blended ROAS reframes the meeting before the platform-disagreement objection lands.
Standalone Summary
Reporting attribution to a non-technical client is a translation job. The client is asking three questions: is total revenue up, where should I add or cut spend, and what changes next month. Lead with blended ROAS and MER (the two numbers that cannot be double-counted across channels), show last-click and multi-touch side by side so the client picks the lens that fits the question, and hand them a one-page cheat sheet they can keep. Script your answers to the eight objections that come up every time (the Meta-vs-dashboard gap, view-through, GA4 trust, model switching), run a five-minute opener that answers the three core questions in order, and follow a weekly automated send plus monthly thirty-minute strategic review plus quarterly business review cadence. Hyros tracks $3.5 billion in revenue across more than 4,000 customers using UID-based reconciled attribution, with CheckThat.ai’s 2026 review finding 29 to 33 percent more conversions surfaced versus native platform reporting across 601 reviewed implementations. The dashboard is the artifact. The meeting is the deliverable. The agency that scripts the meeting keeps the retainer.
Want a dashboard your client meetings can actually run on? → Book a demo
Related in This Series
Cluster: Agency
- What to Include in an Agency Ad Reporting Dashboard
- Multi-Client Attribution Reporting for Agencies
- First-Click vs Last-Click Attribution
- Multi-Touch Attribution
- Blended ROAS: Definition and Calculation
- Meta Ads Reporting and Attribution Accuracy
- Post-Purchase Surveys vs Tracked Attribution
- The 7 Best Ad Attribution Tools in 2026