


LTV Calculation Models: Historical, Predictive, and Cohort
Most people running paid ads are optimizing on the wrong number. They are looking at first-purchase ROAS and making budget decisions based on what a customer spent in week one. I built Hyros specifically because I needed to see the full picture — what a customer is actually worth over their entire relationship — and nothing in the market could show me that. LTV calculation models are the frameworks that answer that question. There are three main models: historical LTV sums actual past revenue per customer, predictive LTV uses statistical or machine-learning models to forecast future spend, and cohort LTV groups customers by acquisition month or channel and tracks revenue over time. Each model answers a different question. Historical tells you what happened. Predictive tells you what will happen. Cohort tells you which acquisition source produces the most valuable buyers.
TL;DR
- Historical LTV is the simplest model. Multiply average order value by purchase frequency by customer lifespan. It uses only data you already have. Best for stable businesses with 12+ months of transaction history, but it assumes the future will look like the past.
- Predictive LTV uses probabilistic models (BG/NBD, Pareto/NBD) or machine learning to forecast future revenue from each customer based on recency, frequency, and monetary signals. It outperforms historical calculations by 25-40% in accuracy but requires more data and analytical effort.
- Cohort LTV groups customers by acquisition date or channel, then tracks cumulative revenue month by month. It is the gold standard for ad attribution decisions because it directly answers: “Do customers from Meta Ads spend more over 12 months than customers from Google Ads?” Cohort analysis only works when attribution is accurate enough to assign customers to the right group in the first place.
- All three models break down when the underlying customer data is incomplete. If your tracking misses conversions or loses customers across devices, the numbers you feed into any LTV formula are already wrong before you run the math. That is an attribution problem, not a modeling problem.
Why does LTV matter for ad attribution?
Most businesses make ad spend decisions based on front-end metrics: cost per click, cost per lead, first-purchase ROAS. Those numbers tell you what happened today. They say nothing about what a customer will be worth over the next two years.
Let’s imagine a Facebook ad producing a $40 first purchase at a $35 CAC. On a first-purchase basis, that is barely profitable. You’d kill it. But if customers from that campaign return four more times and spend $320 total, the actual return is 9:1. I’ve seen this exact pattern in accounts I look at inside Hyros — campaigns being shut off that were printing money, just slowly. Without LTV data, you kill winners.
The problem is that LTV requires accurate, long-term customer tracking. Platform-side attribution (Meta Ads, Google Ads) was built to measure campaign performance, not customer lifetime behavior. Once a customer converts, platform tracking stops following them. Repeat purchases, upsells, and subscription renewals happen off-platform — in your Shopify store, your CRM, your payment processor. If nothing connects those transactions back to the original ad, your LTV data has a gap shaped exactly like your best customers.
According to a study frequently cited by Genesys Growth, 82% of SaaS companies calculate LTV, but fewer than 50% measure LTV:CAC ratio. That means most businesses know the number exists and still do not connect it to acquisition cost in a way that drives actual decisions.
For context on how CAC and LTV pair together, see our guide on the LTV:CAC ratio. For the acquisition cost side of the equation, see how to calculate customer acquisition cost.
Model 1 — Historical LTV
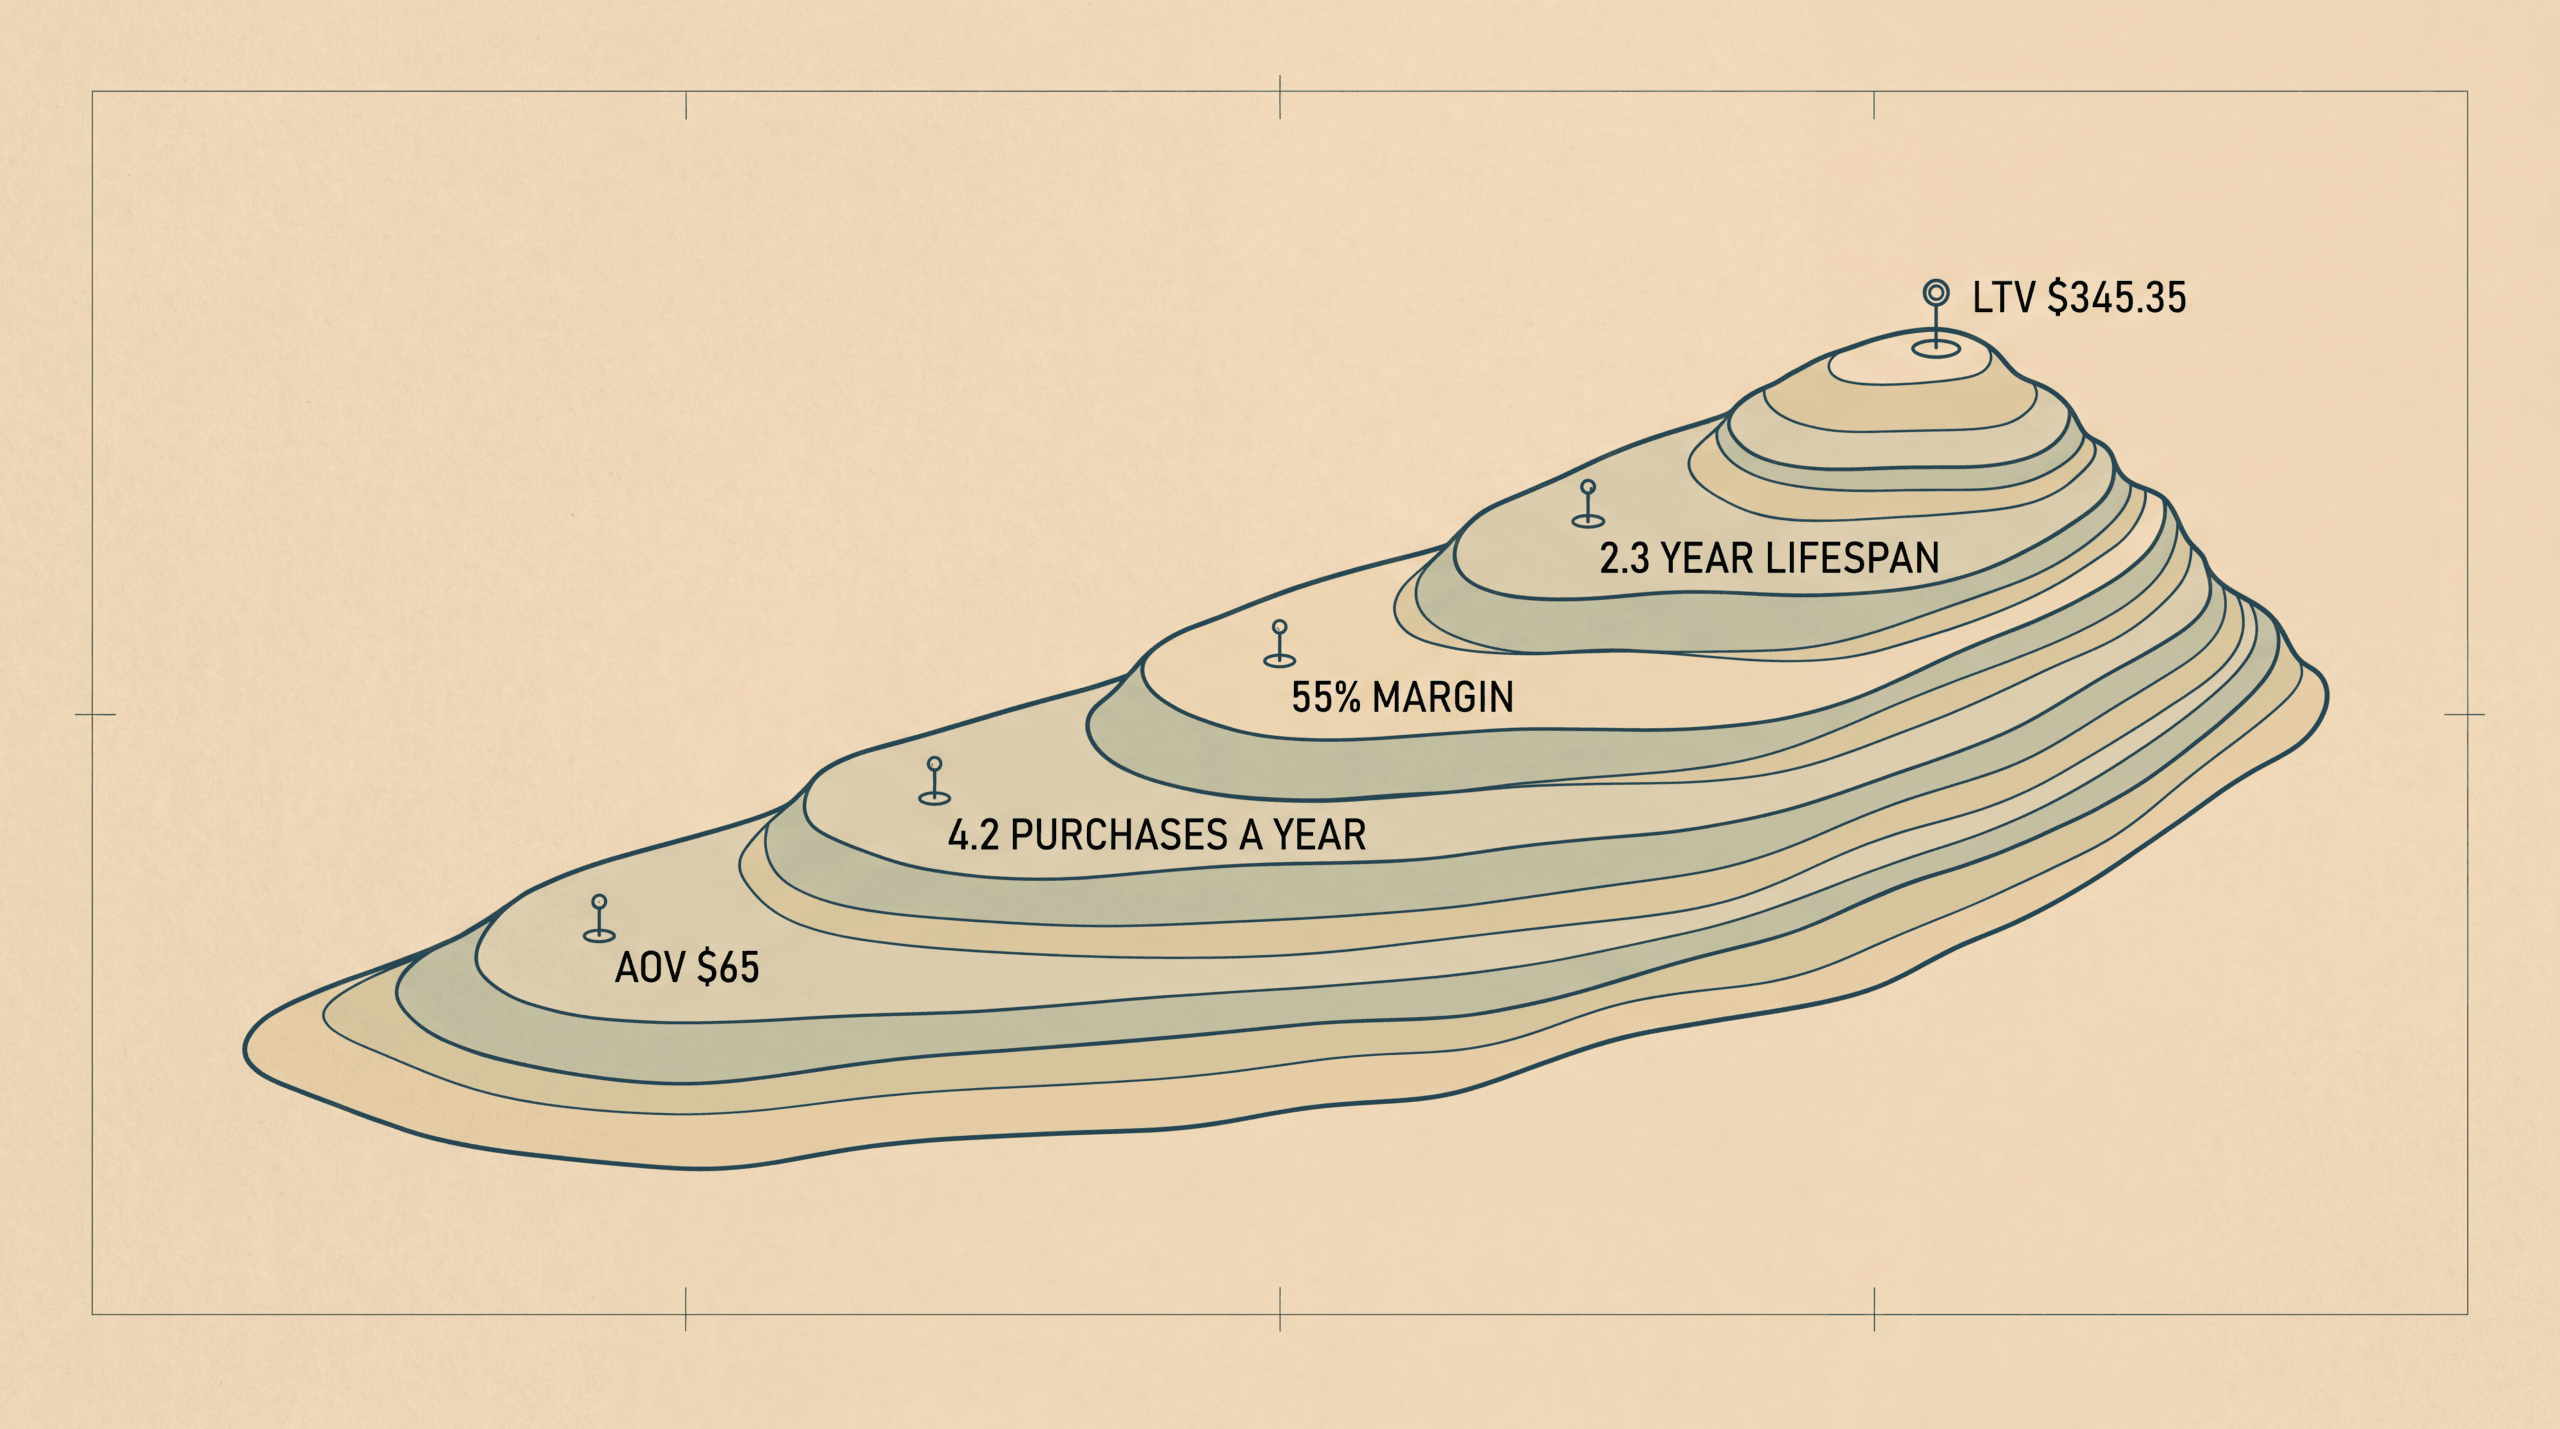
Historical LTV is the backward-looking model. It sums up what customers have actually spent, applies a margin adjustment, and uses that as the baseline estimate for future customers.
What is the historical LTV formula?
Historical LTV = Average Order Value x Purchase Frequency x Average Customer Lifespan x Gross Margin %
Some versions omit the gross margin step and calculate gross LTV instead of contribution-margin LTV. That is fine for internal benchmarking, but for CAC payback calculations, you need the margin-adjusted version. A $500 gross LTV at 40% margin is $200 in actual contribution — and if your CAC is $180, you are not as profitable as the gross number suggests.
Worked example: DTC supplement brand
Here is a real-numbers walkthrough for a direct-to-consumer supplement company:
| Input | Value |
|---|---|
| Average Order Value (AOV) | $65 |
| Purchase Frequency | 4.2 times per year |
| Annual Revenue Per Customer | $273 |
| Gross Margin | 55% |
| Annual Gross Profit Per Customer | $150.15 |
| Average Customer Lifespan | 2.3 years |
| Historical LTV | $345.35 |
If this brand’s blended CAC is $90, the LTV:CAC ratio is 3.8:1 — above the 3:1 sustainability threshold but not so high that it signals underinvestment in growth.
The same brand could break this down further. Customers acquired through organic search might have a 2.8-year lifespan, while paid social customers average 1.6 years. Same AOV, same frequency, dramatically different LTV. That segmentation only works if attribution correctly assigns customers to channels — a point I will return to.
When should you use historical LTV?
Historical LTV works best when:
- You have at least 12 months of clean transaction data
- Your business model is relatively stable (not undergoing major pricing or product changes)
- You need a quick baseline for CAC target-setting or investor reporting
- You want to compare channel performance over past cohorts
It does not work well for new businesses, businesses launching into new markets, or situations where customer behavior is changing rapidly. The fundamental assumption behind historical LTV is that future customers will behave like past customers. When that assumption breaks — and it breaks often during scaling — you need a different model. I’ve seen businesses hit that wall at the exact moment they started scaling spend, which is the worst possible time to realize your LTV number is fiction.
Model 2 — Predictive LTV
Predictive LTV flips the question from “what did customers spend?” to “what will this customer spend?” It uses statistical patterns from existing data to forecast the future value of each individual customer or customer segment.
How do predictive LTV models work?
There are three main approaches, each with increasing complexity:
Regression-based models are the simplest predictive approach. You build a regression (linear or logistic) that predicts future spend based on variables like first purchase value, channel, product category, and engagement metrics. These models are easy to build in a spreadsheet or SQL query, but they assume linear relationships between inputs and outputs, which customer behavior rarely follows.
Probabilistic models (BG/NBD and Pareto/NBD) are purpose-built for customer lifetime value estimation. The BG/NBD model — developed by Peter Fader, Bruce Hardie, and Ka Lok Lee in a 2005 Marketing Science paper — models two things simultaneously: how often a customer buys (while they are active) and the probability that they have stopped buying entirely. It needs only three inputs per customer: recency (when they last bought), frequency (how many times they have bought), and the time since their first purchase. The Pareto/NBD model does the same thing but is harder to estimate computationally. BG/NBD was explicitly designed as the easier alternative, and it has become the standard in practice.
Machine-learning models (gradient-boosted trees, neural networks) can incorporate dozens of features — demographics, browsing behavior, support ticket history, email engagement — and capture nonlinear patterns that regression and probabilistic models miss. The tradeoff is interpretability: a BG/NBD model tells you why a customer is predicted to churn (low recency, declining frequency); a neural network gives you a number without an explanation.
When should you use predictive LTV?
Predictive models earn their complexity when:
- You are a SaaS business with variable churn and expansion revenue
- You are scaling ad spend and need to forecast returns before cohorts mature
- You have enough data to train the model (minimum 12 months; 24+ is better)
- You want customer-level LTV scores for segmentation, not just averages
For subscription SaaS, predictive LTV is nearly mandatory. A SaaS company with 3% monthly churn has a simple LTV of ARPU / churn = 33 months of revenue. But if 20% of customers expand their spend by upgrading plans, the simple formula understates reality. Predictive models capture that expansion.
Common pitfalls with predictive LTV
Overfitting. A model trained on 6 months of data from a single channel will predict that channel’s customers perfectly and fail on everything else. Always hold out a validation set and test the model on customers it has never seen.
Survivorship bias. If you only model customers who made at least two purchases, you are ignoring one-time buyers — who might be 40-60% of your total base. Their LTV is low, but excluding them inflates your average and distorts your CAC targets.
Stale models. Customer behavior shifts with pricing changes, product launches, and market conditions. A predictive model trained on 2024 data may not accurately forecast 2026 behavior. Retrain quarterly at minimum.
Garbage in, garbage out. This is the attribution connection point. If your tracking misses 30% of repeat purchases because customers switch devices, clear cookies, or buy through a different email address, your model is training on incomplete purchase histories. It will systematically underestimate LTV for customers who actually buy more than your data shows. Fix the data first. Then build the model. In that order.
Model 3 — Cohort LTV

Cohort LTV is less a formula and more a framework. It groups customers by a shared characteristic — usually acquisition month or acquisition channel — and tracks their cumulative revenue over time.
How does the cohort table work?
A cohort table puts time on the horizontal axis and customer groups on the vertical axis. Each cell shows cumulative revenue (or gross profit) per customer in that cohort at that point in their lifecycle.
| Cohort | Month 1 | Month 3 | Month 6 | Month 12 | Month 18 |
|---|---|---|---|---|---|
| Jan Meta Ads | $62 | $104 | $158 | $247 | $312 |
| Jan Google Ads | $71 | $128 | $201 | $340 | $421 |
| Jan Organic | $55 | $98 | $172 | $295 | $398 |
| Feb Meta Ads | $58 | $97 | $149 | $231 | — |
| Feb Google Ads | $68 | $121 | $189 | $322 | — |
Reading this table: customers acquired through Google Ads in January generated $340 per customer by month 12. Meta Ads customers generated $247. If the CAC for Google is $85 and for Meta is $55, Meta looks cheaper on a front-end basis, but Google customers are worth $93 more per person at the 12-month mark. By month 18, the gap widens further.
That is the kind of decision cohort LTV makes possible. Not “which channel is cheapest?” but “which channel is most valuable over time?” Those are completely different questions. Most people are answering the wrong one.
Why is cohort LTV the gold standard for ad attribution?
Three reasons.
First, it accounts for time. A channel that produces customers who take 6 months to reach profitability looks terrible on a 30-day ROAS report but may outperform everything on a 12-month LTV basis. Cohort analysis gives you the patience to see that.
Second, it isolates variables. If you changed your Meta ad creative in March, the March cohort will show whether the new creative attracts customers with different spending behavior than the February cohort. No other LTV model gives you that temporal isolation.
Third, it connects directly to ad spend decisions. “Should I increase Meta spend?” is answered by: “Are recent Meta cohorts trending above or below the LTV I need at this CAC?” That is a concrete, data-driven yes or no.
Worked example: Jan Meta cohort vs Jan Google cohort
Suppose your January Meta Ads cohort (200 customers, $55 average CAC, $11,000 total spend) reaches $247 per customer at month 12. Total revenue: $49,400. Gross margin at 50%: $24,700. Subtract the $11,000 acquisition cost: $13,700 in contribution profit from that cohort.
Your January Google Ads cohort (120 customers, $85 average CAC, $10,200 total spend) reaches $340 per customer at month 12. Total revenue: $40,800. Gross margin at 50%: $20,400. Subtract the $10,200: $10,200 in contribution profit.
Meta produced more total profit ($13,700 vs $10,200) because the lower CAC allowed you to acquire more customers. But Google produced higher per-customer value. The correct move depends on whether you can scale Meta volume without increasing CAC. This is the kind of nuance that only cohort-level analysis reveals. And it is why I built LTV tracking into Hyros from day one — not as a reporting feature, but as the actual decision engine for where my ad dollars go.
Historical vs predictive vs cohort — side-by-side comparison

| Dimension | Historical LTV | Predictive LTV | Cohort LTV |
|---|---|---|---|
| What it answers | What did the average customer spend? | What will this customer spend? | Which acquisition source produces the best customers? |
| Data required | 12+ months of transactions | 12-24+ months, plus behavioral signals | 6+ months of tagged cohort data |
| Complexity | Low (spreadsheet math) | High (statistical modeling or ML) | Medium (structured table, SQL or BI tool) |
| Granularity | Segment-level averages | Individual customer scores | Cohort-level curves |
| Best for | Baseline benchmarks, investor decks, CAC targets | Customer segmentation, churn prediction, expansion forecasting | Ad spend allocation, channel comparison, creative testing |
| Biggest weakness | Assumes future = past | Requires data science capability; stale models mislead | Depends entirely on attribution accuracy |
| Attribution dependency | Low (uses internal transaction data) | Medium (needs correct channel tags for segmented models) | Very high (wrong channel = wrong cohort = wrong decision) |
The models are not mutually exclusive. Most mature businesses run all three: historical as a baseline, predictive for customer scoring and churn alerts, and cohort for marketing budget decisions.
How does Hyros track LTV by ad and channel?

Cohort LTV analysis demands one thing above all else: accurate customer-to-source mapping. If a customer gets assigned to the wrong cohort — or worse, never gets assigned at all because tracking lost them — the entire analysis is compromised. Bad cohort data is worse than no cohort data. You make confident decisions based on wrong numbers.
This is where platform-side attribution hits a wall. Meta and Google track conversions within their own ecosystems using cookies and modeled data. But cookies expire. Users switch devices. And after iOS App Tracking Transparency launched in April 2021, roughly 96% of US iPhone users initially opted out of cross-app tracking according to Flurry Analytics. Current opt-in rates have recovered to approximately 35-37% per Adjust Q2 2025 data, but the gap between what platforms report and what actually happens remains significant.
Hyros solves this with deterministic, server-side tracking. When a customer clicks an ad, Hyros captures that interaction. When they purchase — whether that day, three weeks later, or on a different device — Hyros matches the transaction back to the original click using persistent identifiers (email, phone) instead of cookies. Every subsequent purchase ties back to the same customer profile and the same acquisition source.
That gives you three things no platform pixel can:
LTV by campaign and creative. Not just “Meta Ads customers are worth $247 at month 12,” but “Customers from Meta Campaign X, Ad Set Y, Creative Z are worth $310 at month 12.” You can see which specific ads produce high-LTV buyers and allocate spend accordingly.
Accurate cohort data. Because Hyros does not lose customers when cookies expire or devices switch, your cohort tables are built on complete records. No survivorship bias from tracking gaps.
Revenue attribution beyond the first sale. According to a published Hyros case study, Dan Henry became 300% more profitable within 72 hours of implementing Hyros and scaled from $20,000 to $300,000 per month in ad spend. That trajectory requires knowing not just which ads acquire customers cheaply, but which ads acquire customers who keep spending. First-sale attribution cannot reveal that; only full-journey LTV tracking can.
Across more than 4,000 customers and $3.5 billion in tracked revenue, Hyros has consistently identified 29-33% more conversions than native platform reporting, according to an independent CheckThat.ai analysis. Those recovered conversions include repeat purchases that feed directly into LTV calculations. Without them, your cohort curves are drawn from incomplete data.
Hyros starts at $230/month on an annual plan ($379/month on monthly billing) and includes a 90-day money-back guarantee. Trustpilot users rate it 4.8/5 across 600+ reviews.
For more detail on how attribution accuracy affects every metric downstream, see our guides on what is ad attribution and how to calculate ROAS.
FAQ
What is the simplest way to calculate LTV?
The simplest formula is Average Order Value multiplied by Purchase Frequency multiplied by Average Customer Lifespan. For a quick estimate, pull your total revenue over the past 12 months, divide by total unique customers, and multiply by the average number of years a customer stays active. This gives you a historical LTV that works as a starting benchmark. Apply gross margin if you want contribution-margin LTV for CAC comparison. You do not need a data scientist or a specialized tool for this version — a spreadsheet and access to your payment processor data is enough.
Which LTV model is best for ecommerce?
For most ecommerce businesses, start with historical LTV segmented by channel. Once you have 12+ months of cohort data, add cohort LTV analysis to compare customer quality across acquisition sources. Predictive models add value when you are scaling rapidly and need to forecast returns before cohorts fully mature — for instance, projecting 12-month LTV from 3 months of observed behavior using a BG/NBD model. The right answer depends on your data maturity: if you have clean, channel-tagged transaction data going back 18+ months, cohort analysis will give you more actionable insight than a predictive model built on messy data.
How far back should historical LTV look?
Use a minimum of 12 months to capture seasonal variation and repeat purchase cycles. For businesses with long purchase intervals (furniture, electronics, B2B services), 24-36 months provides a more accurate picture. Looking back further than 36 months risks including data from a different business model — pricing, product mix, and customer profiles may have shifted enough to make older data actively misleading. Weight recent cohorts more heavily if your business has changed sharply.
Can I calculate predictive LTV without a data scientist?
Yes, with limitations. Tools like Lifetimes (a Python library) implement BG/NBD and Gamma-Gamma models with minimal code. Shopify and several CRM platforms offer built-in predictive LTV scores. These pre-built implementations are accurate enough for segmentation and rough forecasting. You need a data scientist (or at least someone comfortable with statistical modeling) when you want to incorporate custom features, handle edge cases like seasonal businesses, or build models that feed directly into automated bidding systems.
How does attribution affect LTV accuracy?
Attribution determines which customers end up in which cohort and whether repeat purchases get counted at all. If your tracking uses browser cookies, it misses customers who switch devices, clear cookies, or convert after the tracking window expires. Those missed events create two problems: your customer count is wrong (inflating CAC) and your per-customer revenue is wrong (deflating LTV). Research suggests that nearly half of marketing spend is wasted due to poor attribution, according to analysis by LayerFive citing Commerce Signals data. Server-side tracking platforms like Hyros use deterministic identifiers to close these gaps.
What is the difference between gross LTV and net LTV?
Gross LTV is total revenue per customer over their lifetime. Net LTV (also called contribution-margin LTV) subtracts cost of goods sold, leaving only the portion that contributes to covering acquisition costs and generating profit. Net LTV is the number you should use for LTV:CAC ratio calculations. A customer with $500 gross LTV and 45% margin has $225 net LTV. If your CAC is $150, the gross ratio looks like 3.3:1 (healthy), but the net ratio is 1.5:1 (unsustainable). Always specify which version you are using when reporting LTV internally.
Does a 5% improvement in retention really increase profits by 25-95%?
That statistic comes from Frederick Reichheld and W. Earl Sasser’s 1990 Harvard Business Review article “Zero Defections: Quality Comes to Services”. The wide range (25-95%) reflects variation across industries — the profit impact of retention was much higher in some sectors (like banking and insurance) than others. The core finding has held up: retained customers cost less to serve, buy more over time, refer others, and are less price-sensitive. Thirty-six years later, the principle remains one of the most-cited statistics in marketing because the math still works. Extending customer lifespan by even a small amount compounds through every month of additional revenue at near-zero marginal acquisition cost.
Standalone Summary
LTV calculation models are the mathematical frameworks for estimating total customer revenue over a full relationship. Historical LTV multiplies average order value by purchase frequency by customer lifespan by gross margin — it is the simplest model but assumes the future mirrors the past. Predictive LTV uses probabilistic models (BG/NBD, Pareto/NBD) or machine learning to forecast individual customer value from recency, frequency, and monetary inputs, outperforming historical models by 25-40% in accuracy. Cohort LTV groups customers by acquisition date or channel and tracks cumulative revenue month by month, making it the gold standard for ad spend allocation because it directly compares customer quality across sources. All three models depend on complete, accurately attributed customer data. Server-side tracking recovers 18-40% more conversions than browser-only pixels, which means LTV calculated from pixel data systematically understates true customer value. Most mature businesses run all three models in combination.
See per-ad LTV broken out by cohort inside Hyros. Book a demo