

How to Calculate ROAS: Formula, Examples, and Benchmarks
TL;DR
ROAS (return on ad spend) tells you how much revenue you earn for every dollar you spend on advertising. The formula is simple: ROAS = Revenue from Ads / Ad Spend. If you spend $1,000 on a Meta campaign and generate $4,000 in tracked revenue, your ROAS is 4x (or 400%). Most ecommerce brands consider anything between 2x and 4x a healthy range, but the “right” number depends on your margins, business model, and how accurately your attribution tracks revenue back to each ad. Bad attribution data makes every ROAS calculation unreliable. This guide walks through the formula step by step, includes worked examples, provides industry benchmarks, and explains why the number on your dashboard might be wrong.
What Is ROAS and Why Does It Matter?
Look, I’m going to tell you something most people running ads refuse to hear. The ROAS formula isn’t the hard part. It’s fifth-grade math: Revenue divided by Ad Spend, full stop. What breaks people is that they feed the wrong numbers into a correct formula and then wonder why the business isn’t growing.
Here’s what I’ve found in the accounts I’ve reviewed: the big reason why businesses think their ads aren’t scaling isn’t something in the ad manager. It’s not the creative. It’s not the targeting. It’s not some magic campaign structure they’re missing. It’s that they’re running their ads against a business model that can’t support profitable ad spend at scale, and their ROAS number, inflated by bad attribution, is hiding that fact from them. Most ROAS problems aren’t ROAS-formula problems. They’re margin problems dressed up in dashboard numbers that look better than reality.
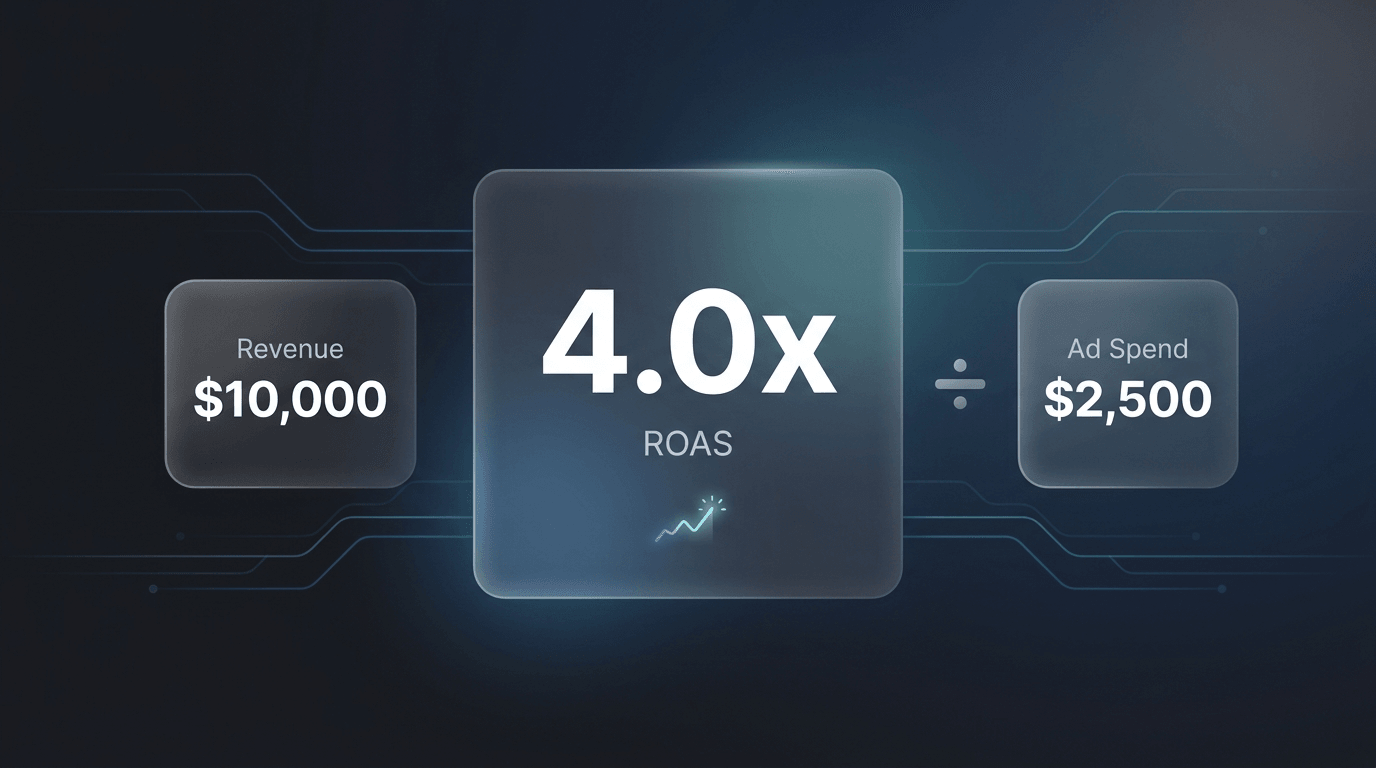
ROAS (return on ad spend) is calculated by dividing the revenue generated by an ad campaign by the money spent on that campaign. The formula is ROAS = Revenue from Ads / Ad Spend. A campaign that generates $4,000 in revenue from $1,000 in ad spend has a ROAS of 4, often written as 4x or 400%. ROAS measures advertising efficiency, not profitability. It ignores product cost, shipping, and overhead.
The metric exists for one reason: to answer whether your ad dollars are producing more money than they consume. Every major ad platform reports some version of ROAS. Google Ads calls it “Conv. value / cost.” Meta calls it “Purchase ROAS.” Shopify attributes revenue to the last click by default. Each platform calculates the number differently because each platform claims credit differently.
That distinction matters. The raw formula is universal, but the inputs change depending on who is doing the counting. Platform-reported ROAS tends to run higher than reality because each platform takes credit for sales it influenced but did not solely cause. When three platforms all claim credit for the same $100 purchase, your combined ROAS looks three times better than it actually is. According to a Databox analysis, summing all platform-reported conversions typically produces 150-250% of actual closed customers. That isn’t a rounding error. That is a structural flaw baked into every self-reported ROAS number.
The problem extends beyond overcounting. A LayerFive study found that “nearly half” of marketing spend is wasted due to poor attribution. Nearly half. When that waste hides inside an inflated ROAS number, brands keep funding campaigns that look profitable on a dashboard but bleed money in reality.
This is why serious advertisers pair the ROAS formula with proper ad attribution. The formula itself is fifth-grade math. Getting accurate numbers into that formula is the hard part.
How Do You Calculate ROAS Step by Step?
ROAS = Revenue from Ads / Ad Spend
Here is the calculation broken into four steps.
Step 1: Total Your Ad Spend for the Period
Add up every dollar spent on the campaign or channel during your measurement window. Include the media spend reported by the ad platform. If you’re calculating account-level ROAS, sum all campaigns. If you’re calculating campaign-level ROAS, use only that campaign’s spend.
What to include:
– Media cost (the amount billed by Google, Meta, TikTok, etc.)
– Agency fees (if calculating total cost ROAS)
– Creative production costs (optional, depends on your internal definition)
Most companies calculate ROAS using media cost only and track the fully loaded cost separately under ROI. Either approach works as long as you’re consistent.
Step 2: Total the Revenue Attributed to Those Ads
Pull the revenue that your tracking system attributes to the ads from Step 1. This is where the number gets tricky. Revenue attribution depends on your attribution model:
- Last-click attribution gives 100% of the sale credit to the final ad clicked before purchase.
- First-click attribution gives 100% credit to the ad that started the customer journey.
- Linear attribution splits credit evenly across every touchpoint.
- Data-driven attribution uses machine learning to assign fractional credit based on the actual influence of each touchpoint.
The attribution model you use directly changes the revenue number in the formula. Same ad spend, same actual sales, but different ROAS depending on how you count.
Step 3: Divide Revenue by Spend
Take the revenue number from Step 2 and divide it by the spend number from Step 1.
$10,000 revenue / $2,500 spend = 4.0
That is your ROAS expressed as a multiple.
Step 4: Express as a Multiple or Percentage
ROAS can be stated two ways:
- As a multiple: 4x (meaning $4 back for every $1 spent)
- As a percentage: 400% (same meaning, different format)
Most media buyers and agencies use the multiple format (4x). Google Ads reports it as a raw ratio (4.0). Either format works. Pick one and stay consistent across your reporting.
What Does a Real ROAS Calculation Look Like?
Here is a full walkthrough using a real-world scenario.
The setup: A DTC skincare brand runs a Meta Ads campaign for 30 days in March 2026. The campaign promotes a $65 moisturizer bundle.
The numbers:
| Line Item | Amount |
|---|---|
| Total Meta ad spend | $5,000 |
| Total purchases tracked by Meta | 142 |
| Average order value | $68.50 |
| Total revenue (Meta-reported) | $9,727 |
The calculation:
ROAS = $9,727 / $5,000 = 1.95x
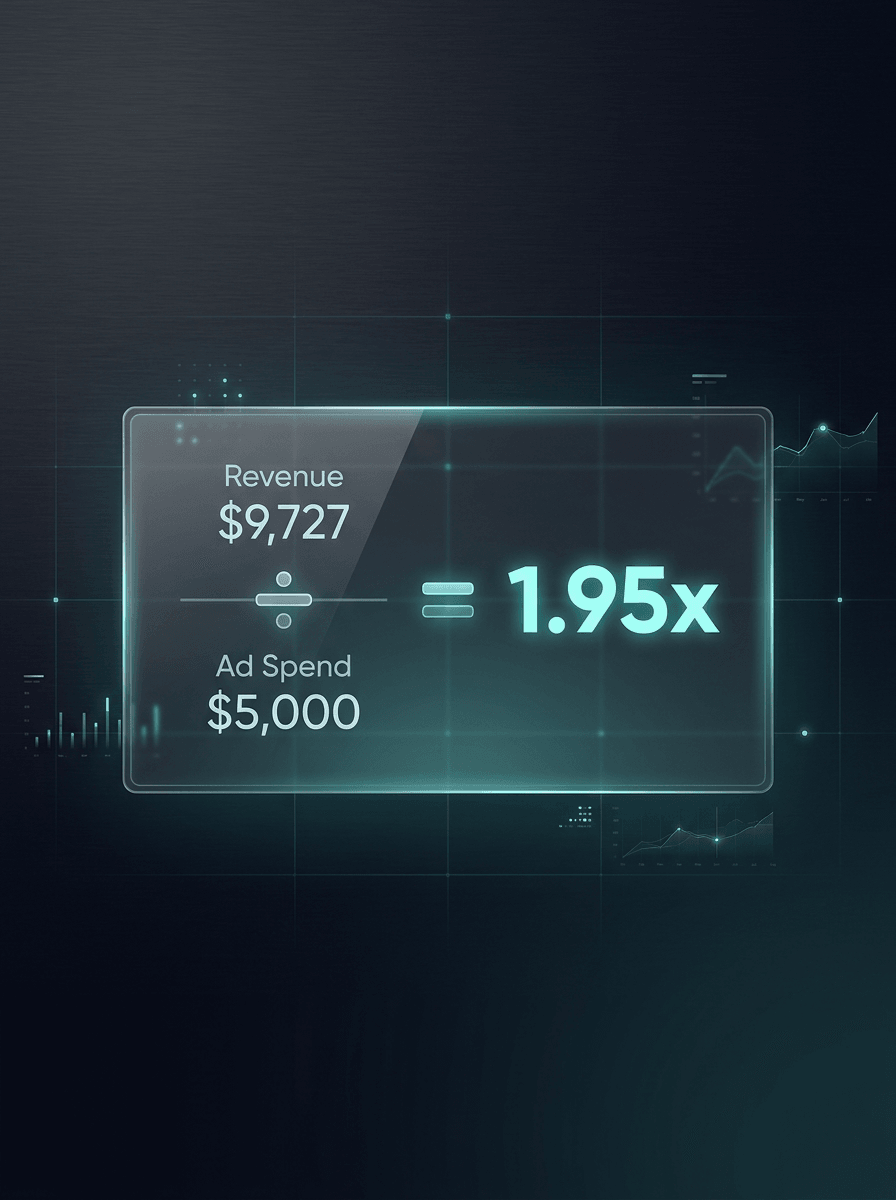
At 1.95x, this campaign returns $1.95 for every $1 spent. For a product with a 70% gross margin ($47.95 per unit), that leaves roughly $4,527 in gross profit on $5,000 in spend. After subtracting the ad cost, the campaign loses about $473 before factoring in customer lifetime value.
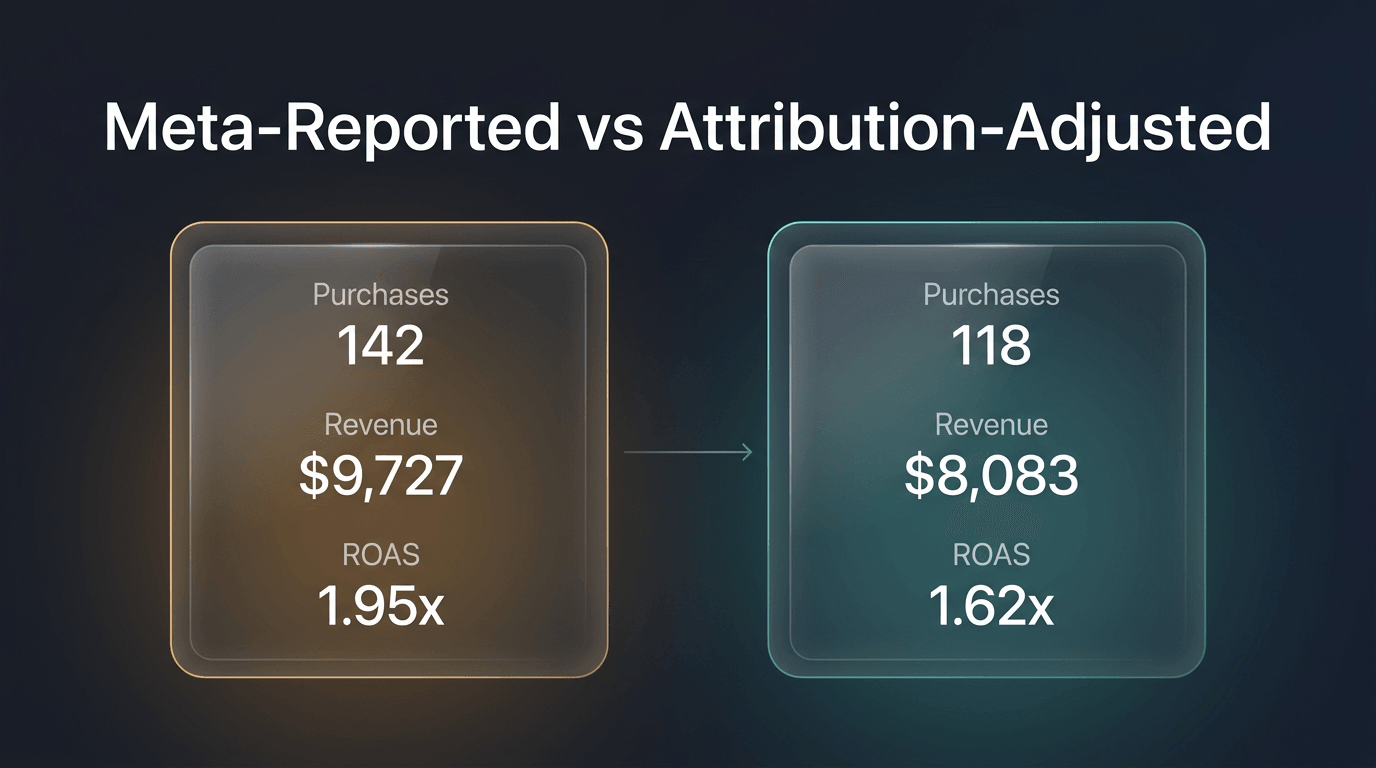
But here is the problem. Meta reported 142 purchases. When the brand checks Shopify orders and matches them against actual customer data using Hyros AI attribution, the real number is 118 purchases directly attributable to that campaign, with 24 of those 142 purchases actually originating from email, organic search, or repeat customer behavior that Meta claimed credit for. This gap isn’t unique to this example. On the Hyros Shopify integration page, internal data shows Facebook underreports conversions by approximately 30%, Google by 29%, and TikTok by 33%. Those aren’t outlier numbers. An independent analysis by CheckThat.ai that aggregated 601 Trustpilot reviews found users consistently reported 29-33% more conversions tracked through Hyros than native platforms showed.
Adjusted ROAS:
| Metric | Meta-Reported | Attribution-Adjusted |
|---|---|---|
| Purchases | 142 | 118 |
| Revenue | $9,727 | $8,083 |
| ROAS | 1.95x | 1.62x |
The adjusted ROAS drops from 1.95x to 1.62x. That is a 17% gap between what the platform reports and what actually happened. This gap is common. A 2025 analysis of ecommerce ad performance found the median ROAS across all ecommerce was 2.04x, while platform-reported figures averaged 2.87x. The difference is attribution inflation.
What Is a Good ROAS?
“Good” depends on margins, business model, and growth stage. A 2x ROAS is profitable for a SaaS company with 85% margins. That same 2x is a loss for a physical product brand with 30% margins.
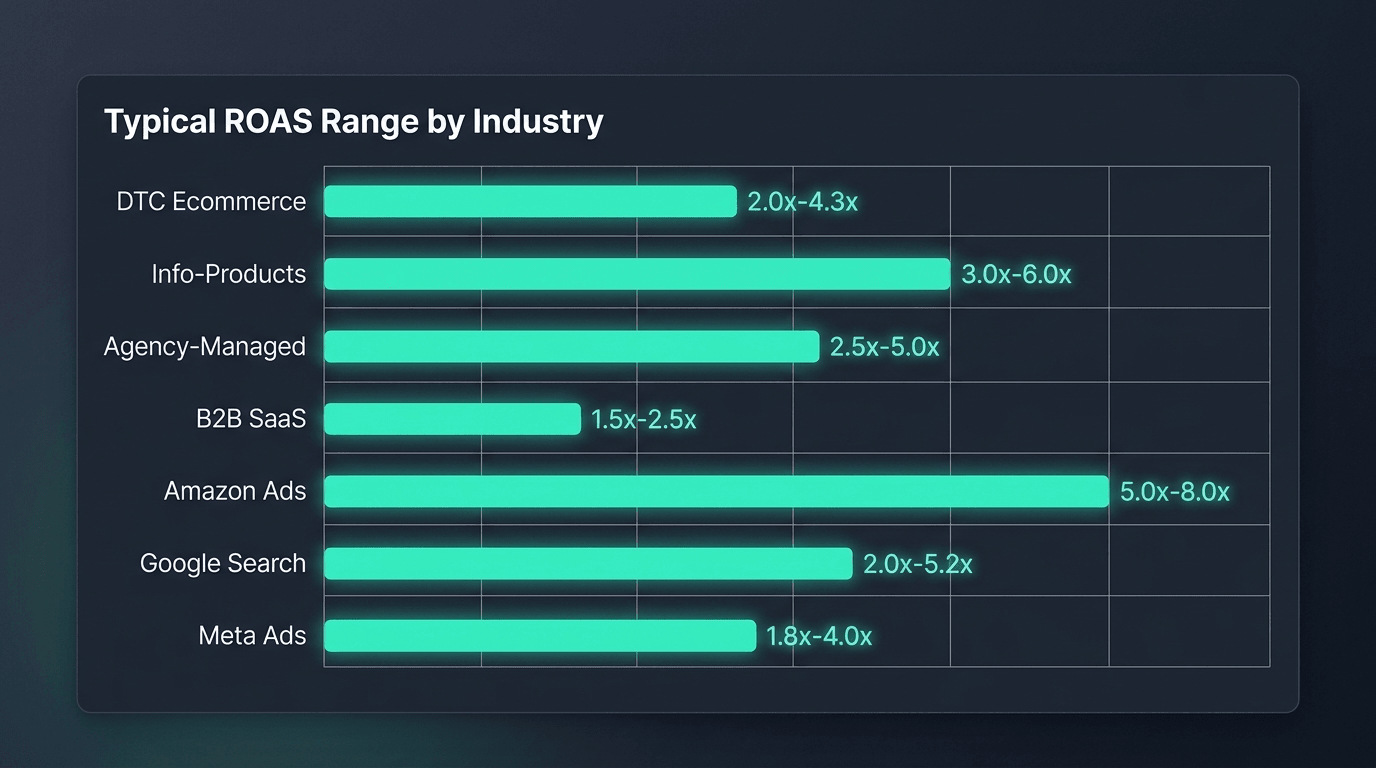
Here are benchmark ranges based on published 2024-2025 data:
| Industry / Model | Typical ROAS Range | Notes |
|---|---|---|
| DTC Ecommerce | 2.0x – 4.3x | Fashion skews higher (~4.3x), health/supplements lower (~2.3x) |
| Info-products / Digital | 3.0x – 6.0x | Near-zero COGS means lower ROAS is still profitable |
| Agency-managed accounts | 2.5x – 5.0x | Agencies typically target 3x+ to cover their fees |
| B2B SaaS (PPC) | 1.5x – 2.5x | Long sales cycles; LTV-based measurement more useful |
| Amazon Ads | 5.0x – 8.0x | Amazon’s closed-loop tracking inflates reported ROAS |
| Google Search Ads | 2.0x – 5.2x | Branded search campaigns often show 10x+, which skews averages |
| Meta (Facebook/Instagram) | 1.8x – 4.0x | Median is around 2.19x across all industries |
Sources: First Page Sage (2019-2025 campaign data across 52 clients), Triple Whale (2024 median ROAS report), Focus Digital (2025 Google Ads report), UpCounting (2025 ecommerce aggregation).
Three things to remember about benchmarks:
Branded search inflates averages. A brand running Google Ads on its own brand name will show 10x-20x ROAS on those campaigns. When blended with prospecting campaigns, the average looks better than the new-customer acquisition reality. See blended ROAS for a deeper breakdown.
Platform-reported ROAS is almost always higher than reality. Every ad platform has an incentive to show you good numbers. Google, Meta, and TikTok all use their own attribution windows and models, and they all overclaim.
High ROAS isn’t always the goal. A brand spending $5,000/month at 6x ROAS might be leaving money on the table. Scaling spend to $50,000/month at 3x ROAS could generate far more total profit, even though the ratio dropped.
What Is the Difference Between ROAS and ROI?
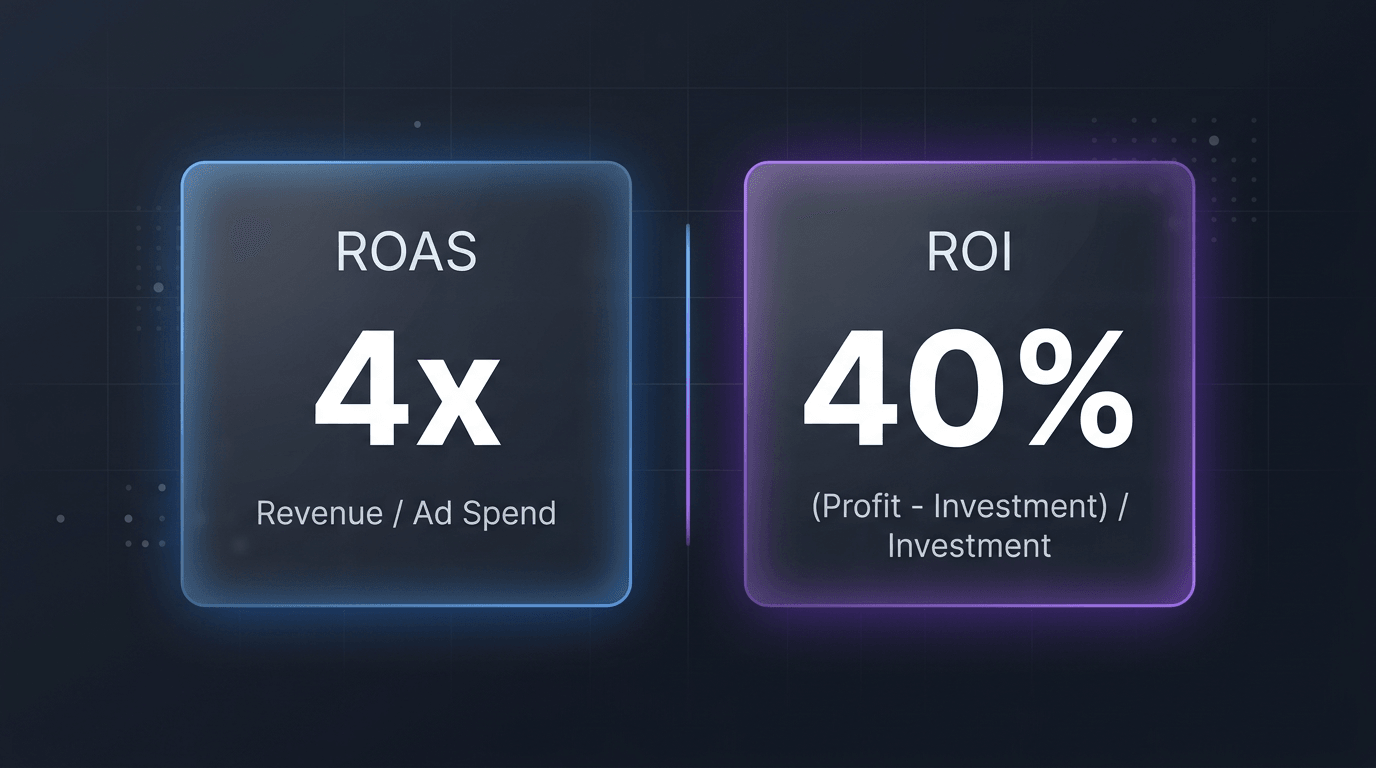
ROAS and ROI (return on investment) are related but measure different things.
ROAS measures advertising efficiency. It only looks at ad spend and the revenue tied to that spend.
ROAS = Revenue from Ads / Ad Spend
ROI measures total profitability. It factors in all costs: product cost, shipping, overhead, salaries, software, and the ad spend itself.
ROI = (Profit – Total Investment) / Total Investment x 100
Here is the difference in practice:
| Metric | Formula | Inputs | Result |
|---|---|---|---|
| ROAS | Revenue / Ad Spend | $10,000 revenue, $2,500 spend | 4x |
| ROI | (Profit – Investment) / Investment | $3,500 profit after COGS, $2,500 spend | 40% |
A 4x ROAS looks strong. But if the product cost, fulfillment, and overhead eat $6,500 of that $10,000 in revenue, the actual ROI is 40%. Still positive, but a much different story than “4x.”
ROAS is useful for day-to-day campaign management. ROI is what the business actually cares about. The two should be tracked together. For a full comparison, see ROAS vs ROI: What’s the Difference?.
Why Does ROAS Lie Without Good Attribution?
Here’s a thing I want you to sit with. Let’s imagine you’re running $200,000 a month in ad spend (not a stretch if you’re doing serious volume) and your dashboard shows a 5x ROAS. Looks great. You’re printing money. Except when I look at where those numbers actually come from, the picture changes fast.
Platform-reported attribution over-reports by 15-20% in most accounts I’ve seen. That’s not a rounding issue. That means on $200K of spend, you’re looking at $30,000 to $40,000 in reported revenue that doesn’t exist in your bank account. Your “5x ROAS” is actually closer to 4x. Or worse. And because you’re optimizing toward the inflated number, you’re funneling budget into campaigns that look like winners but are secretly bleeding. The waste isn’t just the misattributed revenue. It’s the compounding effect of every budget decision you make downstream from a bad number.
I ran into this exact situation with my own ad accounts. Out of $300K in annual spend, roughly $100K was going to campaigns that showed strong platform-reported ROAS but were actually producing zero incremental revenue. The platforms were double- and triple-counting the same buyers. It took server-side tracking across every channel to find the waste. Cutting those campaigns saved $600K per year with no drop in sales. At the same time, about 25% of the campaigns I would have killed based on platform data turned out to be delivering 200-500% ROI. They were just invisible to Google and Meta’s self-reported numbers.
The ROAS formula is only as accurate as the revenue number you feed into it. If your attribution is wrong, your ROAS is wrong. Here are the most common ways attribution distorts ROAS.
Double-counting across platforms
A customer sees a Meta ad, clicks a Google ad the next day, and buys through an email link on day three. Meta claims the sale. Google claims the sale. Your email platform claims the sale. Your combined “ROAS” now accounts for 3x the actual revenue. Total reported revenue across platforms: $300. Actual revenue: $100.
Over-reliance on last-click
Google Analytics defaults to last-click attribution. If a customer discovered your brand through a YouTube ad, researched on Instagram, and then typed your URL directly into their browser, last-click gives 100% credit to “direct” traffic. Your paid campaigns show zero revenue for a sale they actually started.
Short attribution windows
Meta’s default attribution window is 7-day click, 1-day view. Any purchase outside that window gets no credit. For products with a 14-30 day consideration cycle, this means your Meta ROAS is systematically undercounted for cold traffic campaigns and overcounted for retargeting. That window used to be 28 days. After iOS 14.5, when 84% of iOS users initially opted out of app tracking (Flurry, 2021; opt-in has since risen to ~37%), Meta collapsed it by 75%. The result is a structural hole in every ROAS calculation that relies on Meta data alone.
View-through inflation
Some platforms count “view-through conversions,” where someone saw an ad (but did not click it) and later purchased. This inflates ROAS with sales that may have happened regardless of the ad.
As one agency running live Hyros demos put it: “Facebook reported cost per call at $129 when the actual cost was $518.” That is a 4x gap between what the platform tells you and what you actually paid for each lead. You can’t calculate a meaningful ROAS when the denominator’s companion metric (cost per conversion) is off by that margin.
The fix is third-party attribution that tracks the full customer journey across every touchpoint without letting any single platform grade its own homework. This is exactly what ad attribution tools are built to solve.
How Can You Improve ROAS Without Increasing Budget?
Five concrete actions that move the number without requiring a bigger budget.
1. Fix your attribution first
Before optimizing creative, audiences, or bids, make sure the revenue number in your ROAS formula is accurate. If Meta is overclaiming 20% of your conversions, you’re optimizing toward the wrong campaigns. Use a third-party attribution system like Hyros to get a single source of truth across all channels. An independent review by Softailed found that server-side tracking recovers 18-40% more conversions compared to browser-only pixel tracking. Joshua Palmer of Direct Hearing reported a 14.44% revenue boost in five days after switching to server-side attribution. Not from running better ads. Just from feeding accurate data into the same campaigns.
2. Kill low-performing campaigns faster
Most ad accounts carry dead weight. Campaigns with a ROAS below 1.0x after sufficient spend (at least 3x your target CPA) are unlikely to turn around with minor tweaks. Pause them. Redirect the budget to campaigns already performing above your target ROAS.
3. Segment ROAS by campaign type
Don’t blend prospecting and retargeting ROAS into a single number. Prospecting campaigns acquire new customers and typically run at a lower ROAS (1.5x-3x). Retargeting campaigns convert warm audiences and run at a higher ROAS (4x-10x). Blending them hides whether your new customer acquisition is actually working. Track them separately.
4. Increase average order value
ROAS is revenue divided by spend. If you increase revenue without increasing spend, ROAS goes up. Tactics that work: bundle offers, upsells on the checkout page, post-purchase cross-sells, free shipping thresholds set above your current AOV. A 15% increase in AOV translates to a 15% increase in ROAS, all else equal.
5. Match landing pages to ad intent
Ad-to-landing-page mismatch kills conversion rates. If your ad promotes a specific product, the landing page should show that product above the fold with a clear path to purchase. Every extra click between ad and checkout drops your conversion rate by roughly 10-20%. Higher conversion rate means more revenue from the same spend, which means higher ROAS.
FAQ
What is a good ROAS?
A good ROAS depends on your profit margins. For ecommerce brands with 50-70% gross margins, 2x-4x is a common target. For digital products with 80%+ margins, even 1.5x can be profitable. For physical products with tight margins (under 30%), you may need 5x+ to break even. There is no universal “good” number. Calculate your break-even ROAS first: divide 1 by your profit margin percentage (as a decimal). A 50% margin means your break-even ROAS is 1 / 0.50 = 2.0x. Anything above that’s profit.
How is ROAS calculated in Google Ads?
Google Ads calculates ROAS as “Conv. value / cost.” It divides the total conversion value (revenue) attributed to your ads by the total cost of those ads. Google uses its own attribution model (data-driven by default in most accounts since 2023) and a 30-day click / 1-day view attribution window unless you change it. You can find your ROAS in Google Ads by adding the “Conv. value / cost” column to your campaign view. The number shown is a ratio. A value of 4.0 means $4 revenue per $1 spent.
What is the difference between ROAS and ROI?
ROAS measures revenue relative to ad spend only. ROI measures profit relative to total investment, including product costs, overhead, and operational expenses. ROAS = Revenue / Ad Spend. ROI = (Profit – Total Investment) / Total Investment. A campaign can have a strong ROAS (4x) but a weak or negative ROI if margins are thin. ROAS is a media buying metric. ROI is a business metric. Both are useful, but they answer different questions. See the full ROAS vs ROI comparison.
Is 3x ROAS good?
3x ROAS means you generate $3 for every $1 spent on ads. Whether that’s “good” depends on your cost structure. If your gross margin is 66% or higher, 3x ROAS means roughly breaking even on ad spend after covering product costs. Below that margin, 3x may not cover your costs. For most DTC ecommerce brands, 3x is considered a solid baseline for scaled campaigns. Prospecting campaigns often run below 3x, while retargeting campaigns run well above it. The blended average across both should ideally hit your target.
How does Hyros calculate ROAS differently?
Hyros tracks the full customer journey across every ad platform, email, organic, and direct traffic using AI-powered attribution. Instead of relying on Google or Meta to self-report their own conversions, Hyros matches actual customer purchases to the specific ads, clicks, and touchpoints that influenced them. This eliminates double-counting, corrects for short attribution windows, and removes view-through inflation. The result is a ROAS number based on real customer data, not platform-reported estimates. Most Hyros users find that their true ROAS differs from platform-reported numbers by 15-40%. That gap changes which campaigns look profitable and which don’t, directly affecting where you should allocate budget.
Standalone Summary
ROAS (return on ad spend) is calculated with a single formula: Revenue from Ads divided by Ad Spend. A $10,000 revenue result on $2,500 in spend equals a 4x ROAS. Industry benchmarks vary: DTC ecommerce typically ranges from 2x-4.3x, info-products from 3x-6x, B2B SaaS from 1.5x-2.5x, and agency-managed accounts from 2.5x-5x. The metric measures advertising efficiency, not profitability. It excludes product costs, shipping, overhead, and all other business expenses. ROAS becomes misleading when attribution is inaccurate. Platform-reported ROAS is almost always higher than reality due to double-counting, short attribution windows, and view-through inflation. To get a reliable ROAS, use third-party attribution that tracks the full customer journey and prevents individual platforms from grading their own homework. Your break-even ROAS equals 1 divided by your profit margin. Know that number before deciding if your ROAS is “good.”
Calculate true ROAS across every channel with Hyros. Book a demo
Related in This Series
Silo: Ad Attribution Fundamentals
More from the Ad Attribution Fundamentals series:
- ROAS vs ROI: What’s the Difference?
- Blended ROAS Explained: Why It Matters in 2026
- What Is Ad Attribution? A Complete 2026 Guide
- What Is Hyros? How the Ad Tracking Platform Actually Works
Also explore: