

MMM vs Multi-Touch Attribution: When to Use Which (and When to Use Both)
TL;DR
- MMM is top-down portfolio regression; MTA is bottom-up per-conversion touchpoint credit
- Pick MMM for brand, offline, and long lift windows; pick MTA for per-ad weekly optimization
- Above ~$1M annual spend, mature teams run both — MMM quarterly, MTA daily
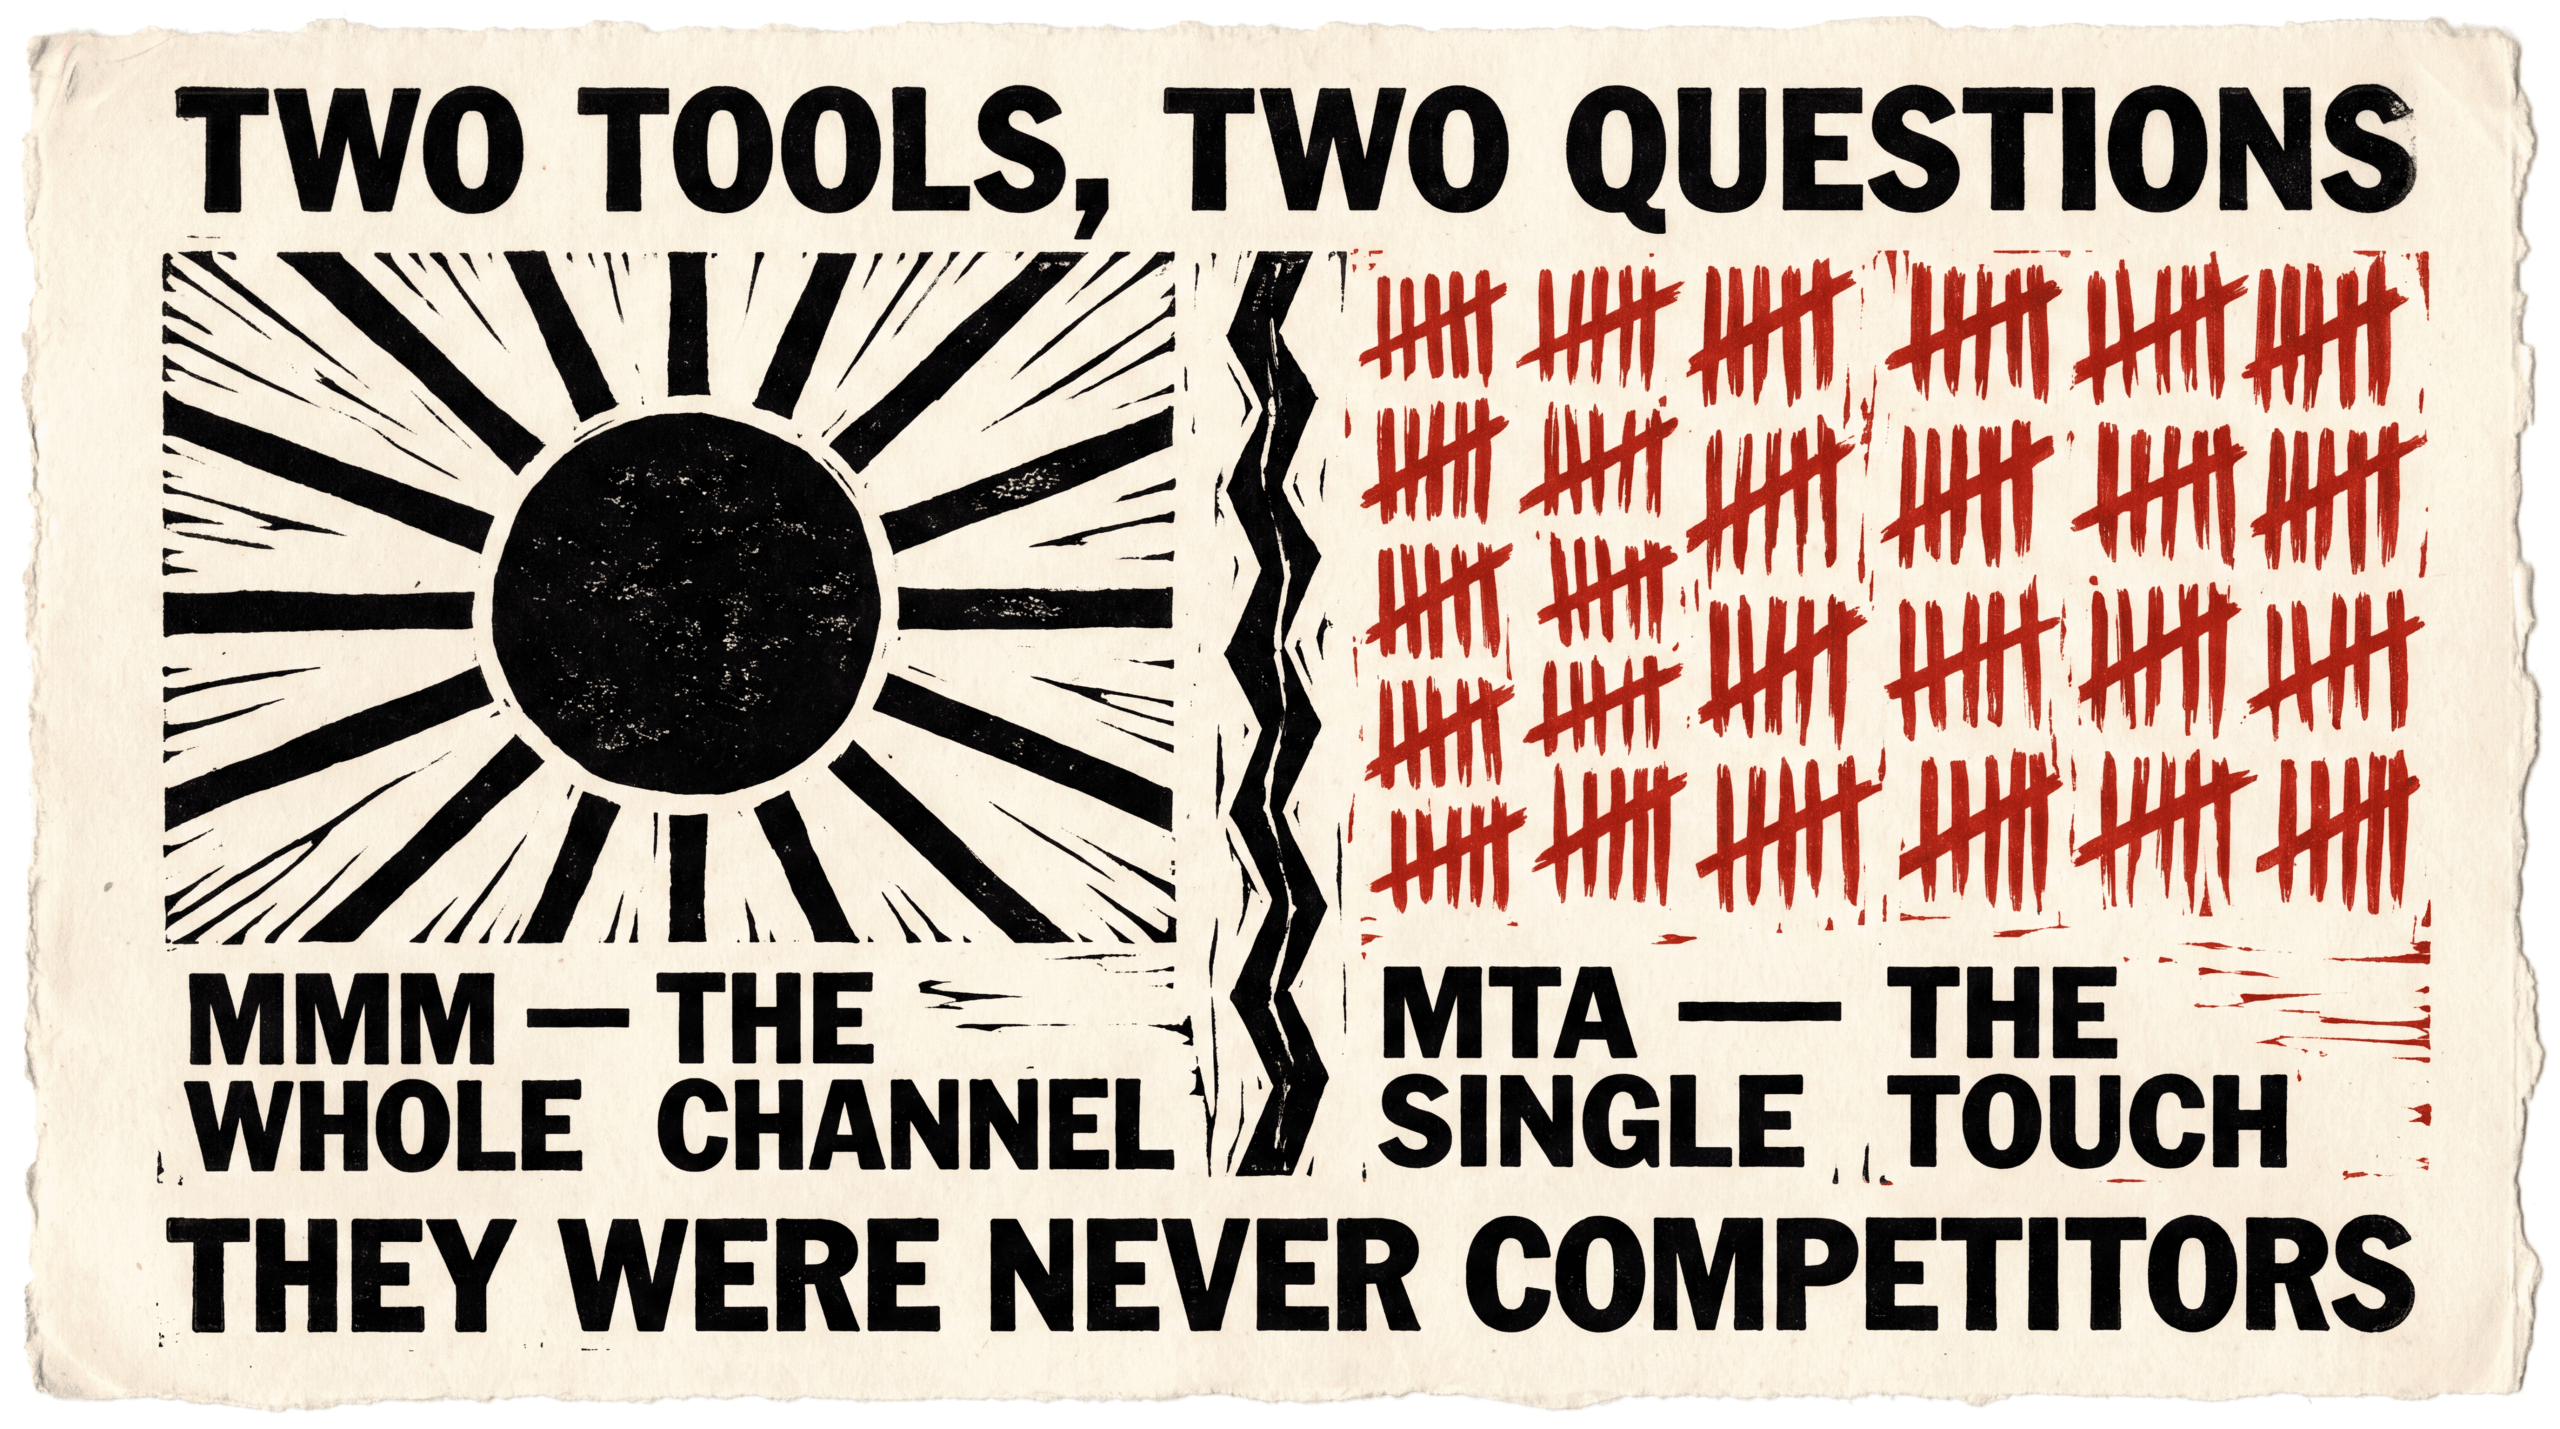
MMM and MTA are not competing tools; they answer different questions. Marketing Mix Modeling (MMM) is top-down statistical regression on aggregated spend and outcome data, with no individual user view, answering “what is the marginal lift of each channel at the portfolio level?” Multi-Touch Attribution (MTA) is bottom-up, tying each conversion to its specific touchpoints across the customer journey to answer “which ads, audiences, and creatives drove this sale?” Pick MMM when brand spend, offline channels, or long lift windows dominate your budget; pick MTA when per-ad ROAS and weekly campaign optimization drive your decisions. Above roughly $1M in annual media spend, most mature growth teams run both: MMM sets the channel-mix envelope each quarter, MTA optimizes inside each channel daily. For a deep look at how MTA actually works under the hood (the four models, the worked $240 sale walkthrough, where it breaks down), see our multi-touch attribution guide.
The Question Behind the Question

Most people frame this as “MMM vs MTA, which one is better?” That’s the wrong question. The right question is “which one fits the decision I’m trying to make every Monday morning?”
I’ve sat in war rooms with growth teams who built six-month MMM projects to answer “should I scale TikTok?” when they could have answered that with a two-week MTA test for a tenth of the cost. I’ve also watched DTC operators try to use MTA to justify their connected-TV spend and then wonder why the numbers look like nothing. The wrong tool produces the wrong answer. The tool didn’t fail. The team picked the tool that wasn’t built for the question being asked.
Here’s the test. Look at the last three budget meetings you ran. Were the decisions on the table:
“Should we shift 10% from paid social to CTV next quarter?” That’s an MMM question.
“Is the new TikTok creative angle paying back at the audience level?” That’s an MTA question.
“Did the brand campaign we ran in March lift baseline conversions in May?” MMM.
“Which Meta ad set is leaking budget on cold traffic?” MTA.
The pattern: portfolio-level allocation across channels with different mechanics is an MMM job. Tactical optimization inside a channel with click-level telemetry is an MTA job. Different jobs. Different tools.
This article assumes you already know what MTA is and how it works. If you don’t, read the multi-touch attribution guide first. Below, MTA is treated as the bottom-up baseline most performance teams already run, and we’re going to walk through seven decision factors that tell you when MMM belongs in the stack alongside it.
Decision Factor 1: Total Media Spend

MMM is a statistics game. You’re trying to fit a regression line through weekly spend and weekly outcomes for every channel in your mix. Below a certain spend volume, the model cannot separate signal from noise. You’ll get a number, but the confidence interval on that number is so wide it might as well be a wild guess.
The industry rule of thumb (cited consistently across Nielsen, Analytic Partners, and the Meta Robyn documentation) is that MMM typically needs at least 2 to 3 years of weekly data and meaningful spend across each channel being modeled. “Meaningful” is the operative word. If you spent $400 on YouTube in 14 of the last 104 weeks, MMM cannot tell you what YouTube is worth. There isn’t enough variance to model.
In practice, this means:
- Below roughly $1M annual media spend → MTA only. MMM is statistically premature. You don’t have the spend variance or the data history to make the model work. Pick MTA, run it weekly, and revisit MMM when you cross the threshold.
- $1M to $5M annual media spend → MTA is mandatory, MMM is optional. You may have enough data for MMM, but the cost of building it (more on that in Factor 6) probably isn’t worth it yet. Most teams in this band run MTA only and reach for MMM when one of the other six factors flips.
- $5M+ annual media spend → both belong in the stack. At this level, the channel mix is complex enough that MMM is the only tool that can answer portfolio questions, and MTA is the only tool that can answer creative-level ones.
I’ve watched a coaching business at $300K per month try to commission an MMM build because a consultant told them to. They spent $60K and four months on the project. The output: a model with confidence intervals so wide that paid social ROAS was “between 0.8 and 4.2.” Useless for any decision. The same team running clean MTA through Hyros got actionable answers in week two.
For the tooling side of how attribution platforms compare at different spend tiers, see our best attribution tools comparison.
Decision Factor 2: Channel Mix
MTA is structurally blind to channels that don’t produce click or impression telemetry. If a customer hears a podcast host-read on Tuesday, sees a billboard on Wednesday, and types your URL into their browser on Friday, no MTA platform on earth saw the first two touchpoints. The conversion lands as direct, or worse, gets attributed to the last paid click and credits the wrong channel entirely.
MMM doesn’t care about telemetry. It only needs two columns: spend by week per channel, and outcome by week. It can model TV, radio, out-of-home, podcast host-reads, direct mail, sponsorships, sponsorships of physical events, and PR. None of these have a click. None can be tracked with a pixel. MMM is the only method that can put a number on them.
Here’s the carve-up:
- 90%+ of spend in trackable digital paid channels (Meta, Google, TikTok, LinkedIn, Pinterest, programmatic display with click telemetry): MTA covers the territory. MMM adds little.
- 20%+ of spend in non-trackable channels (TV, podcast, OOH, sponsorships, PR, brand events): MMM is the only way to measure them. Run it alongside MTA.
- 50%+ of spend in non-trackable channels: MMM is the primary measurement system. MTA covers the digital slice.
Picture this. A DTC supplement brand doing $2M per month splits 60% paid social, 25% Google, 10% podcast host-reads, and 5% YouTube influencer drops. Hyros sees the 85% digital perfectly. The 15% in podcast and influencer drops produce zero attributable conversions in any MTA system because there’s no click. Sales spike for two weeks after a big podcast drops, but the MTA platform credits Meta because Meta caught the last click on the customer who already heard about the brand on the podcast. MMM modeled across 18 months of data catches the podcast lift. MTA never will.
For more on how analytics tools handle the channels they can and cannot see, see our ad tracking vs analytics comparison.
Decision Factor 3: Brand vs Performance Mix
Performance spend closes in days. Brand spend lifts revenue over weeks or months and rarely produces a click. The two payback curves look nothing alike, and the measurement methods built for one are not the methods built for the other.
MTA is a short-window tool. It works best when the touchpoint-to-conversion gap fits inside the platform’s attribution window (typically 7 to 90 days). A brand awareness campaign that lifts baseline conversion rates 6 months out is structurally invisible to MTA. MTA isn’t broken. MTA is just asking the wrong question.
MMM is a long-window tool. It fits regression curves across months and years, and it picks up lift effects that compound over time. Brand campaigns, sponsorships, halo effects from a viral PR moment, all of these show up in MMM. None of them show up in MTA.
The decision rule:
- <10% brand spend, >90% performance: MTA is plenty.
- 10% to 30% brand spend: MMM becomes valuable. Run it quarterly to value the brand investment.
- >30% brand spend: MMM is mandatory. Without it, you cannot defend the brand budget against the CFO who can see every performance dollar’s MTA-tracked return and cannot see what the brand spend is doing.
I’ve watched two consumer brands cut brand budgets because their MTA dashboard showed brand campaigns at “0% return” (which is what MTA shows for any campaign without a click attribution path). Six months later, both saw blended ROAS collapse across the rest of the funnel. The brand spend had been priming the performance spend the whole time. They cut the prime. They lost the funnel. By the time they figured it out, they’d shed millions of dollars in revenue and a year rebuilding awareness.
For the time-window mechanics behind why this happens, see our linear vs time-decay attribution guide.
Decision Factor 4: Privacy Posture and Data Availability
iOS App Tracking Transparency. Third-party cookie deprecation. State privacy laws stacking on top of CCPA and GDPR. The data foundation MTA depends on has been eroding for five straight years, and it’s not going back.
Current iOS opt-in rates sit at approximately 35-37% (Adjust Q2 2025). That means roughly two-thirds of iPhone users are deterministically untracked across third-party apps. For MTA platforms built on the IDFA, this is a structural problem. They model the missing data, but modeled data is not measured data.
MMM doesn’t depend on individual user identity. It runs on aggregate spend and outcome data, which platforms still report at the campaign level even when individual conversions can’t be tracked. iOS ATT barely moves MMM. Cookie deprecation barely moves MMM. Privacy regulation barely moves MMM.
This is why I built Hyros around server-side identity and deterministic email matching instead of pixel-based tracking. The browser surface is degrading. The pixel was already a leaky bucket in 2020. By 2026, any MTA system that hasn’t moved to server-side UID architecture is leaking 30 to 50% of conversions silently, and the team running it has no way to know.
The decision rule:
- iOS conversion share <30%: MTA holds up well enough if you’re running server-side UID infrastructure.
- iOS conversion share 30-60%: MMM becomes more useful as a check on MTA. If your MTA numbers are diverging from blended business outcomes (revenue, MER), MMM tells you whether the divergence is real or a tracking artifact.
- iOS conversion share >60%: MMM is the more defensible primary measurement. MTA still optimizes inside channels you can see, but the cross-channel picture needs MMM’s aggregate-data resilience.
For the deeper mechanics of how server-side tracking changes this calculation, see our server-side tracking guide.
Decision Factor 5: Team Maturity and Operating Cadence
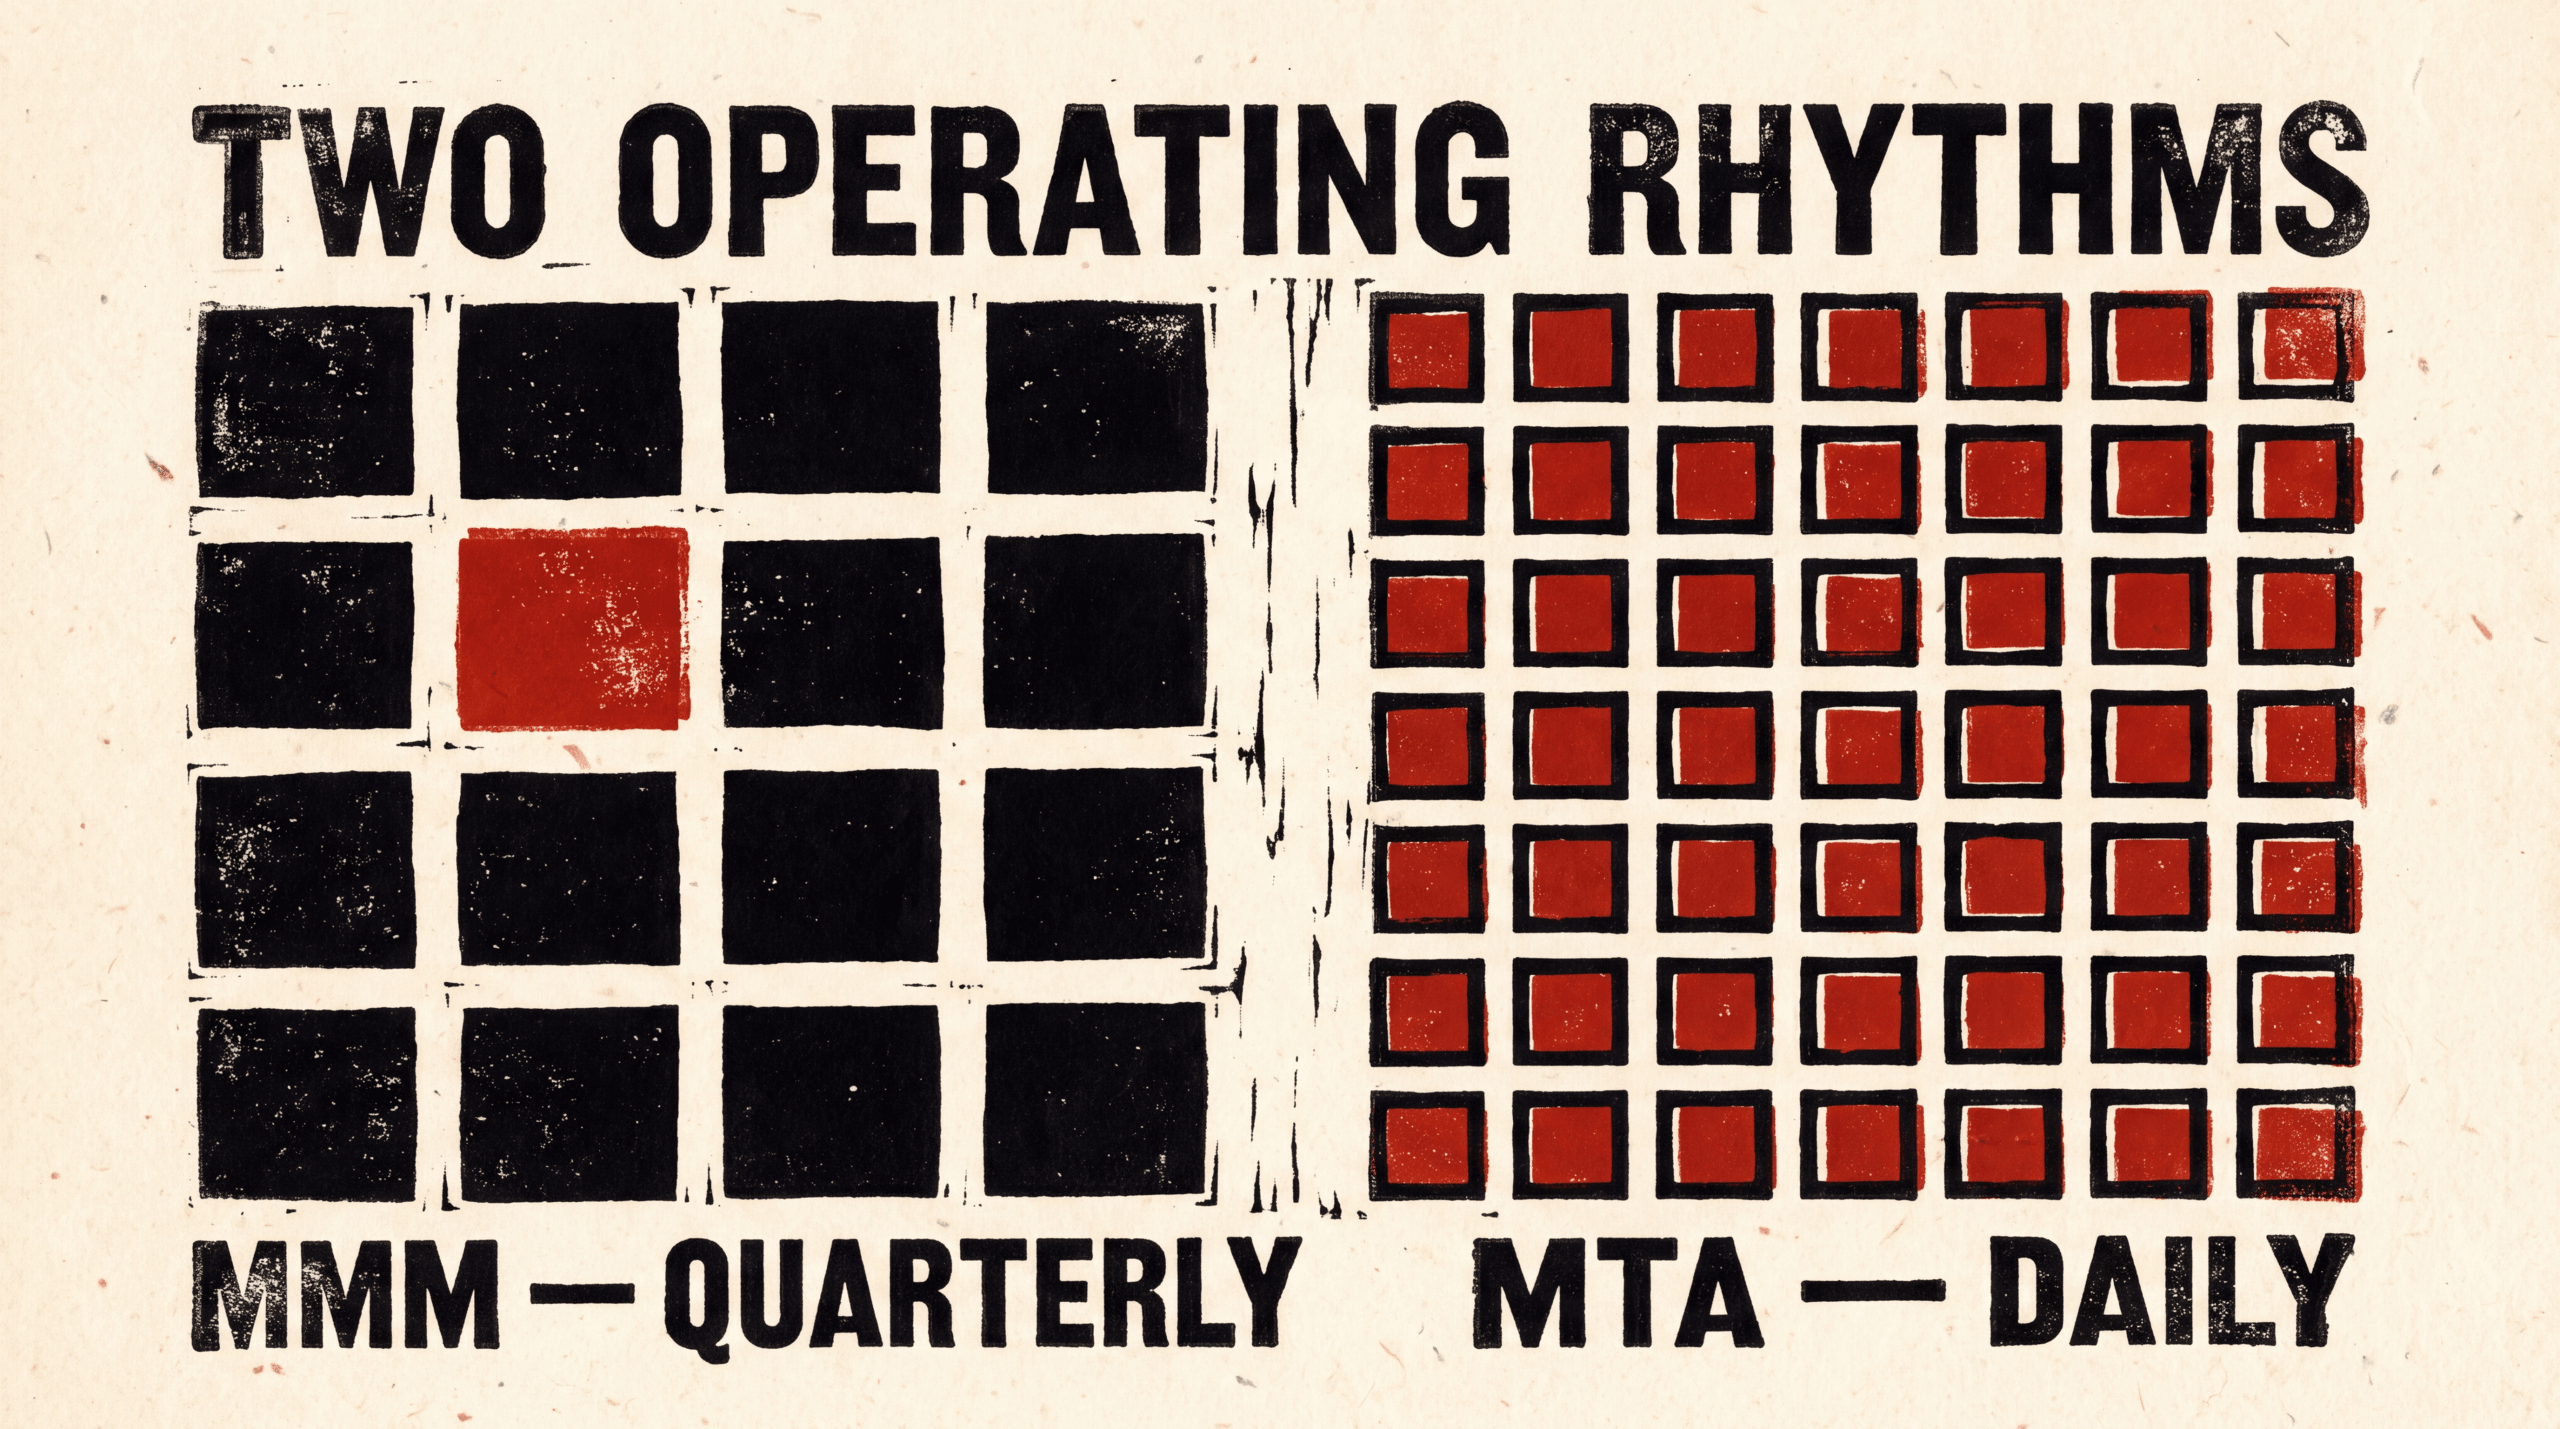
MMM is a quarterly or semi-annual exercise. The model takes weeks to build, weeks to validate, and the output is a portfolio-level recommendation that’s stable for 90 days. MTA is a daily or weekly tool. The output is creative-level and audience-level decisions you can act on inside 48 hours.
The cadence mismatch is what kills MMM-only teams.
Most growth teams optimize bids and creative weekly. Some optimize daily. If your team is making 10 decisions a week, MMM cannot feed that cadence. The model output is too slow, too aggregated, and too coarse. You’ll end up making weekly decisions on stale quarterly data, and the data is averaged across so many campaigns that it can’t tell you which ad set inside Meta is underperforming.
CFO-level budget allocation conversations happen quarterly. That’s the MMM cadence. “Should we move $400K from paid search to CTV next quarter” is a question that lives on a 90-day horizon, and MMM is built for that horizon.
The decision rule:
- Daily or weekly decision cadence: MTA must be your primary tool. MMM cannot run that fast.
- Quarterly budget allocation discussions: MMM is the right input. MTA averages don’t translate cleanly to channel-level recommendations.
- Both cadences exist (and they do in most growth orgs above $5M in spend): run both. MMM at the portfolio level on a 90-day cadence. MTA at the campaign level on a weekly cadence.
I’ve watched too many teams try to force one tool to serve both cadences. The MMM-only team ends up with stale creative running for months because the model can’t catch creative fatigue. The MTA-only team ends up perfectly optimizing inside a channel that MMM would tell them to cut by 30%. Match the tool to the cadence, not the other way around.
Decision Factor 6: Cost and Internal Skill Requirements
Honest pricing time. Both categories cost real money. The cost stacks are not interchangeable.
MTA platforms range broadly. Per current public pricing:
- Triple Whale Starter at $149/month annual, $179/month monthly.
- Cometly Professional at approximately $199/month (third-party reported).
- Hyros Business at $230/month annual, with quote-based monthly pricing.
- Wicked Reports Measure at $499/month.
- Northbeam Starter at $1,500/month.
- Rockerbox at $1,000 to $2,000/month for mid-market, $5,000+/month enterprise.
That’s roughly $200 to $5,000/month depending on volume and feature depth. Most teams above $500K monthly spend land in the $500 to $2,000/month range. The high-end MTA spend buys server-side infrastructure, multi-device identity stitching, and call tracking that the cheaper tools don’t ship. For Hyros’s specific case, we run 600+ Trustpilot reviews at a 4.8 average and track $3.5 billion+ in advertiser revenue across 4,000+ customers, with entry pricing at $230/month on the annual plan.
MMM platforms are quote-based. There’s no public pricing page for any of the major vendors. Directional ranges I’ve seen across client conversations and agency disclosures: $5K to $25K per month for SaaS MMM platforms, or $25K to $150K per engagement for agency-built custom MMM. Open-source MMM (Meta Robyn at facebookexperimental.github.io/Robyn, Google Meridian at github.com/google/meridian) is free in license cost but requires a data-science full-time employee or contracted equivalent to run.
The hidden cost in MMM is the FTE requirement. Robyn and Meridian are powerful tools. They are not tools a marketing operator picks up in a weekend. Building the data pipeline, validating model fit, holding the model accountable across quarters, and translating output into media plan decisions is a job for a quantitative person who works at it full time or close to it. If you don’t have that person, you’re paying an agency for the model and the interpretation both.
The decision rule:
- No data-science capacity, sub-$50K measurement budget: MTA only. You can’t responsibly run MMM without the talent to operate it.
- Data-science capacity on staff, $50K to $200K measurement budget: open-source MMM (Robyn/Meridian) plus MTA. Best dollar-for-dollar combination.
- No data-science capacity, $100K+ measurement budget: SaaS MMM or agency-built MMM, plus MTA.
- Data-science capacity, $200K+ measurement budget: custom MMM (built or vendor-built) plus enterprise MTA.
Decision Factor 7: What Question You Need to Answer This Quarter
The fastest filter. Look at the actual decision sitting on your desk this quarter. Each method has a narrow set of questions it can actually answer.
MMM can answer:
- Should I shift 10% of budget from paid social to CTV?
- What is the saturation curve for Google Search? When does the next dollar stop paying back?
- Did the brand campaign we ran last summer lift baseline conversions this winter?
- What is the true incremental return of our podcast spend?
- How should I allocate next year’s $20M budget across channels?
MTA can answer:
- Which Meta creative variant drove this $4,200 sale?
- Is the new TikTok angle paying back at the ad-set level?
- Which audiences are leaking budget on cold traffic?
- What’s the actual ROAS on this specific landing page versus the control?
- Which sales team’s leads are coming from which ad?
These questions don’t overlap. Notice that none of the MMM questions can be answered with MTA data, and none of the MTA questions can be answered with MMM data. That’s not a flaw. It’s the design. They were built for different jobs.
If the question on the desk is “should I scale this campaign,” it’s MTA. If the question is “should I scale this channel,” it’s MMM. The verb tense is the same. The level of aggregation is what changes everything.
For the underlying mechanics of how single-touch and multi-touch models compare, see our first-click vs last-click attribution guide.
When to Use Both (And How They Fit Together)
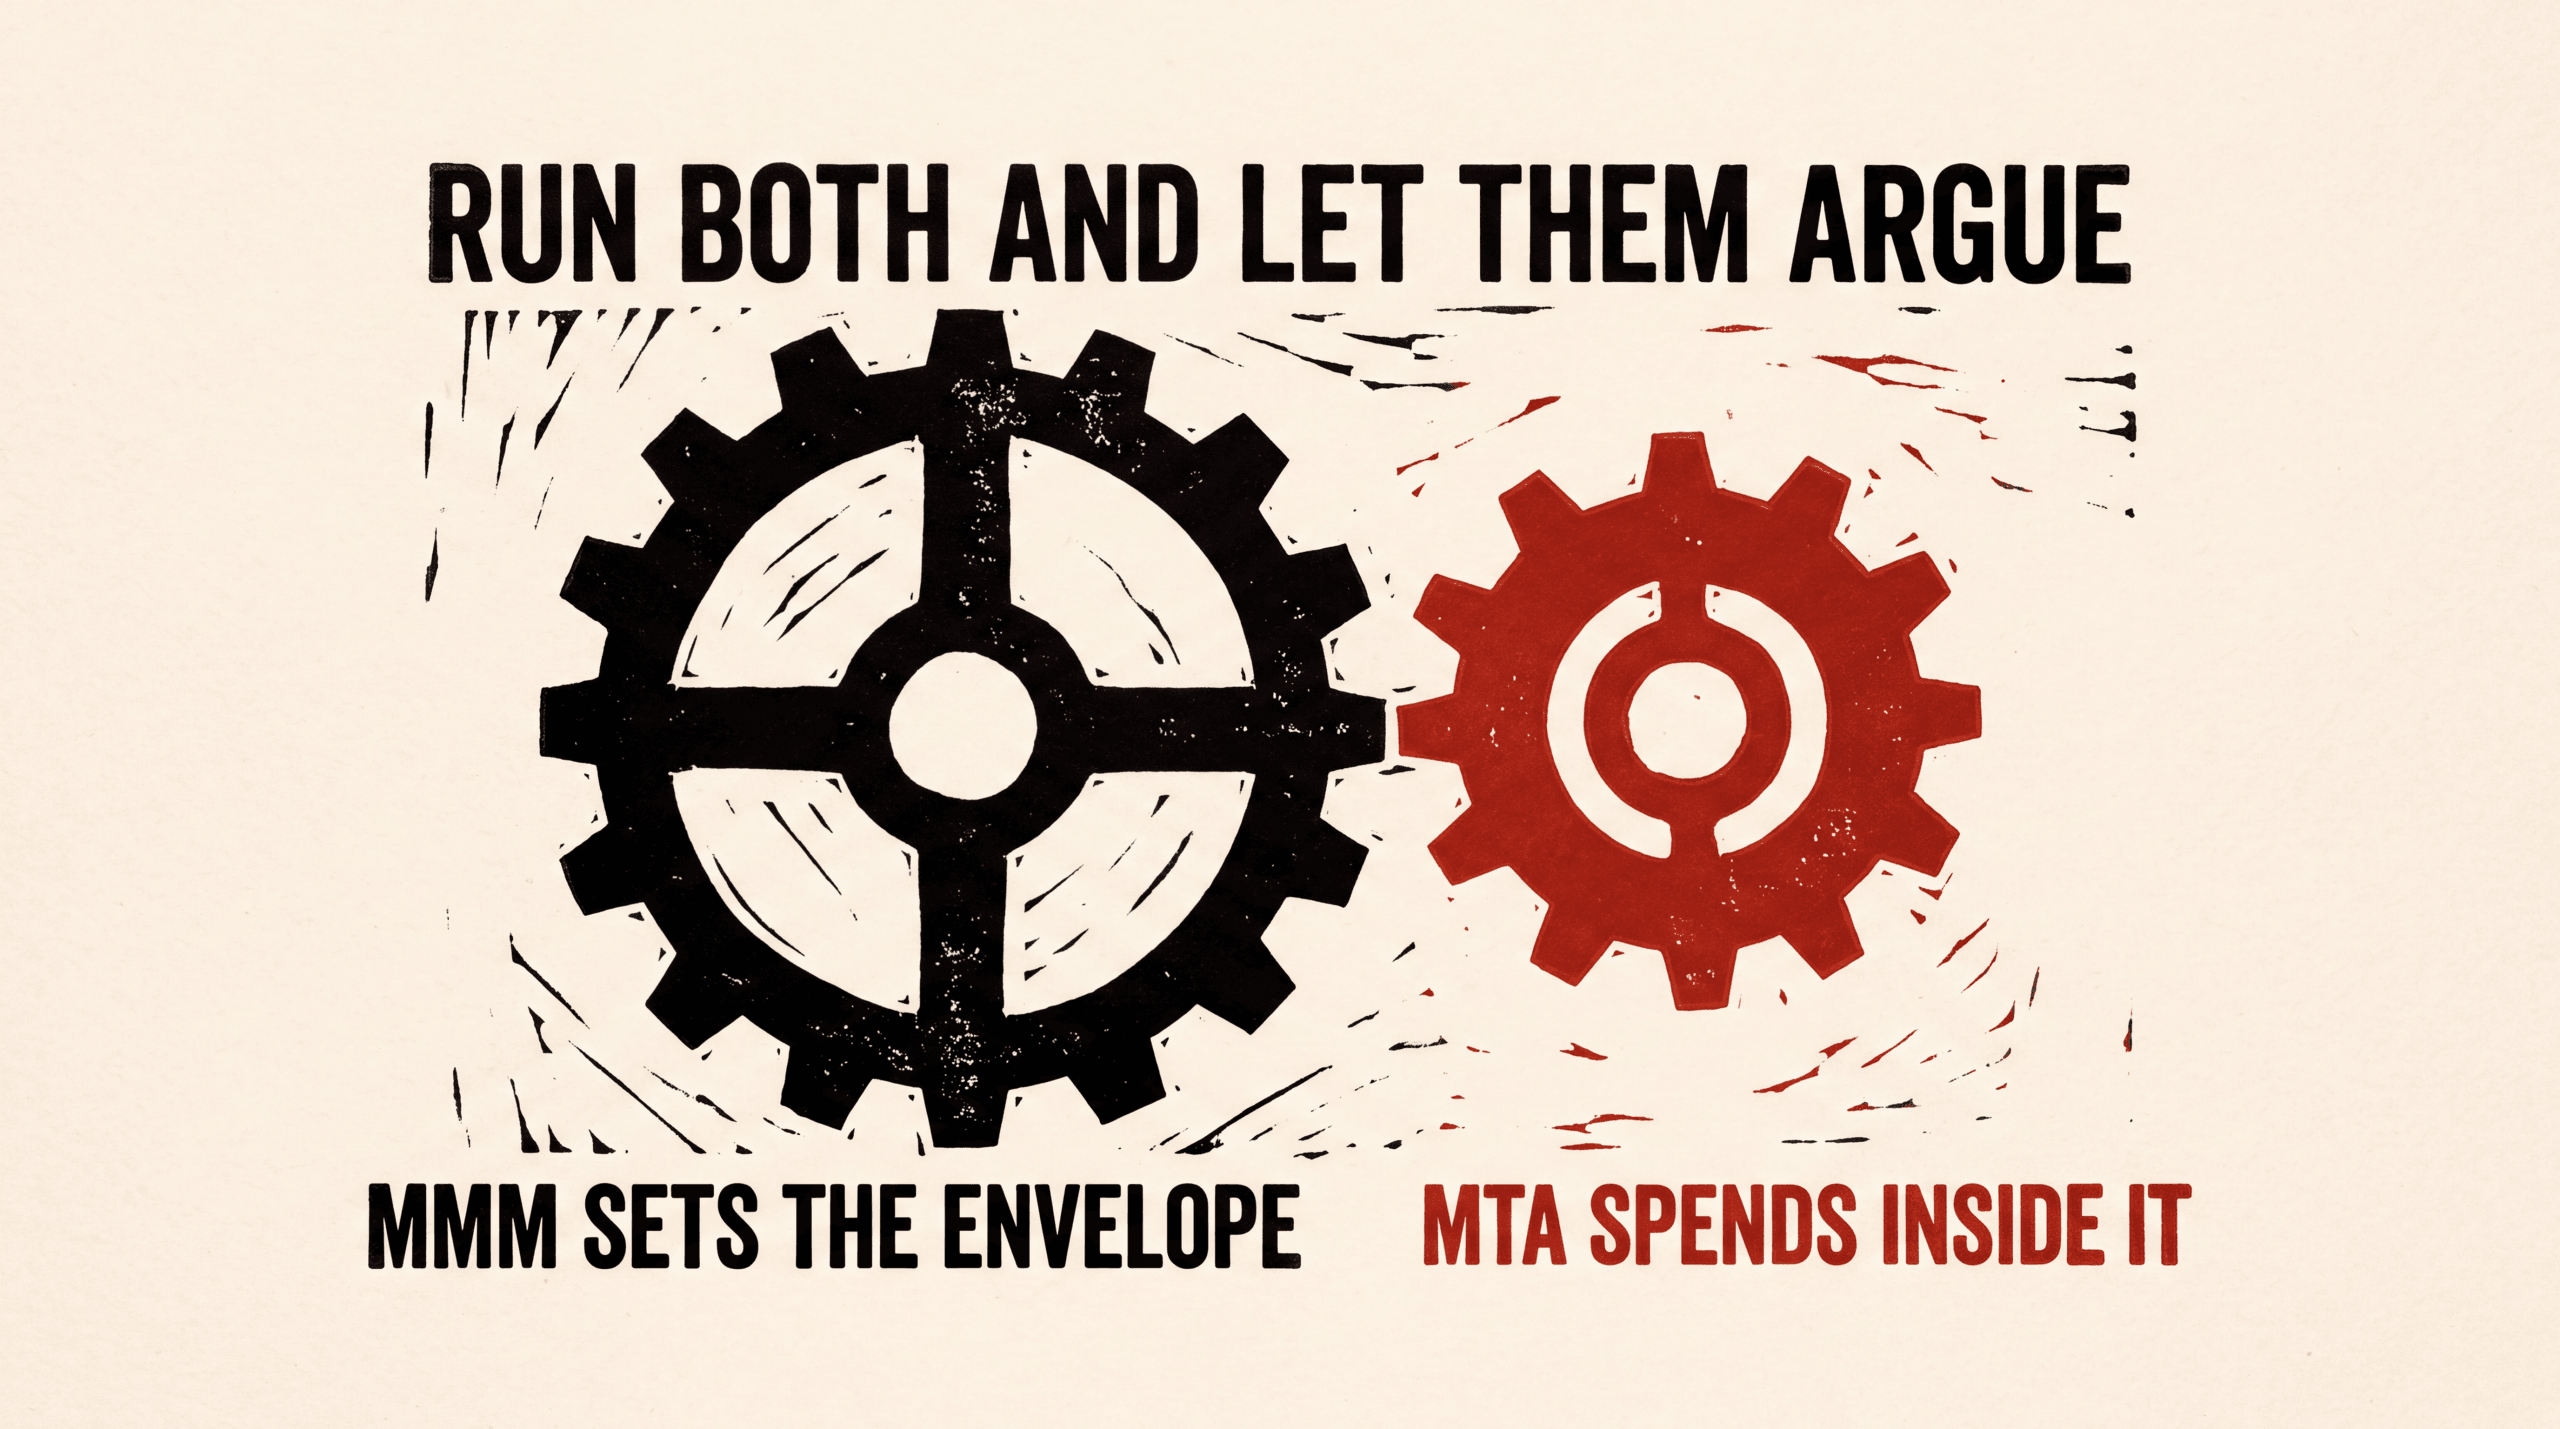
At scale, you don’t pick. You stack.
The standard architecture for mature growth orgs above $5M in annual media spend looks like this:
MMM at the portfolio level, refreshed quarterly. Output: a recommended channel mix and budget allocation for the next 90 days. Sets the envelope. Settles brand budget defense and offline channel valuation.
MTA at the campaign level, refreshed weekly. Output: ad-level, audience-level, and creative-level performance. Drives in-channel optimization. Catches what’s working and what’s leaking inside the mix MMM recommends.
Blended business outcomes (revenue, MER, CAC, contribution margin) as the monthly reconciliation layer. Compare MTA-attributed return to MMM-projected return to blended P&L. Where they diverge, investigate.
The reconciliation step is the part most teams skip. MMM says paid social should be 35% of next quarter’s mix. MTA says paid social inside that 35% should be 80% prospecting and 20% retargeting. Blended P&L says total ROAS this quarter ran 3.1x against the 3.5x MMM projected. Pull on that thread. Either the model is drifting or the channel mix is doing something the model didn’t expect. Either way, you learn.
Hyros sits in this stack as MTA infrastructure: UID-level, server-side, per-ad ROAS, cross-device and cross-channel identity stitching. It is not an MMM tool. It is not trying to be an MMM tool. MMM cannot answer per-ad ROAS questions. Hyros cannot answer brand lift questions. Both are needed at scale, and the operators who run both well make better decisions than operators who try to force one tool to do both jobs.
Picture this. A $3M-per-month coaching business runs MMM quarterly and gets back: paid social 40%, YouTube 25%, Google 20%, podcast host-reads 10%, email and SMS 5%. That’s the envelope. Inside paid social, Hyros tells them on day three of the new quarter that their TikTok ad set is leaking 22% on cold audiences, the Meta retargeting sequence converts at 4.2x but is capped at $40K/month before frequency caps trigger, and the YouTube preroll is paying back at 3.8x against their 3x threshold. That’s actionable. The MMM gave them the budget map. The MTA tells them how to spend the budget. Neither one alone would have produced both decisions.
For the broader tooling picture across MTA platforms and how Hyros stacks against alternatives, see our best attribution tools comparison.
FAQ
Is MMM more accurate than MTA?
Neither one is “more accurate.” They measure different things at different levels of aggregation. MMM produces channel-level lift estimates with statistical confidence intervals. MTA produces campaign-level and creative-level attribution at the user-touchpoint level. Asking which is more accurate is like asking whether a thermometer is more accurate than a scale. They measure different units. The right question is which one fits the decision you’re making.
Can I run MMM without 2-3 years of data?
You can run it. You shouldn’t trust it. MMM is a statistical regression. Below roughly 100 weeks of clean data with meaningful spend variance, the confidence intervals on channel coefficients are so wide that the output is unreliable for budget decisions. Some vendors will sell you a 6-month MMM build. The math doesn’t support it. Either run MTA until you have enough history, or invest the project budget elsewhere.
When should I add MMM to my MTA stack?
When your annual media spend crosses roughly $1M, your channel mix includes 20%+ in non-trackable channels (TV, podcast, OOH, sponsorships), your brand spend exceeds 10% of total, or your CFO is asking portfolio-level allocation questions MTA cannot answer. Any one of these is a trigger. Multiple triggers means MMM is overdue.
Can MTA replace MMM if I have great tracking?
No. Even with perfect user-level tracking (server-side, UID-based, cross-device), MTA still cannot measure channels without telemetry (TV, radio, podcast host-reads, OOH) and cannot measure long-window brand lift. The architecture difference is structural, not a tracking limitation. Better tracking makes MTA more accurate. It does not extend MTA to channels MTA was never built to see.
Do I need a data scientist to run MMM?
If you’re using open-source MMM (Meta Robyn, Google Meridian), yes. These tools require model specification, validation, decay-curve calibration, and ongoing maintenance that is a data-science job. SaaS MMM vendors handle the modeling for you and present the output through a dashboard. Agency-built MMM lands in between (vendor builds, you interpret). Plan the talent investment alongside the tool choice. Skipping it is the most common reason MMM projects fail.
What does Hyros do that MMM can’t?
Hyros tracks individual customer journeys across devices, sessions, and channels through deterministic email-based identity matching. It feeds per-ad, per-audience, per-creative ROAS. According to a CheckThat.ai independent analysis, Hyros captures 29-33% more conversions than native platform reporting. None of that is the job MMM does. MMM gives you portfolio-level channel lift on a quarterly cadence. Hyros gives you campaign-level optimization data daily and weekly. The two complement each other at scale and don’t replace each other at any scale.
How much does MMM cost compared to MTA?
MTA platforms run roughly $200 to $5,000 per month depending on volume and feature depth, with most teams above $500K monthly spend landing in the $500 to $2,000/month band. MMM costs vary widely: SaaS MMM in the $5K to $25K/month range, agency-built MMM at $25K to $150K per engagement, and open-source MMM (Robyn, Meridian) free in license but requiring a data-science FTE. The TCO gap is wide. Budget for both honestly before committing to either.
Bottom Line
If you only remember one thing from this article, remember the question test. Look at the decision sitting on your desk. If it’s about per-ad, per-audience, or per-creative performance, you need MTA. If it’s about cross-channel portfolio allocation, brand spend valuation, or offline channel lift, you need MMM. Above $1M in annual spend with mixed channels, you probably need both. The teams that win are the ones who match the tool to the question, not the ones who pick a side.
For the deep-dive on how MTA works mechanically (the four models, the worked example, where the architecture breaks down), start with our multi-touch attribution guide. That’s the companion piece to this one and the natural next read if MTA is the side of the framework you need to operationalize first.
So this has been Becker. Go look at the questions on your desk this week. Pick the tool that answers them. Stop fighting about which side is right.
Standalone Summary
MMM and MTA are not competing tools; they answer different questions. MTA tells you which specific touchpoints drove a specific conversion using click and impression data. MMM tells you how each channel contributes to baseline revenue over time using regression on aggregate spend and outcome data. Choose MTA when you need daily decision support on creative, audience, and bid changes, and when you have clean click-level signal across all paid channels. Choose MMM when you spend across hard-to-track surfaces (TV, podcast, OOH, influencer) or when iOS and cookie loss have hollowed out your click data. Most teams above $500K monthly spend benefit from running both: MMM as the strategic check on channel-level budget allocation, MTA as the day-to-day operational layer. The reconciliation gap between the two outputs is the real signal. When MTA says channel X gets 30% of revenue and MMM says 12%, the truth is somewhere in between and the gap itself tells you how broken your tracking is. Hyros runs MTA on a UID-based server-side stack across 4,000+ customers and $3.5 billion+ in tracked ad spend, so the MTA layer can feed clean inputs into an MMM run instead of starting from broken platform-reported data.