
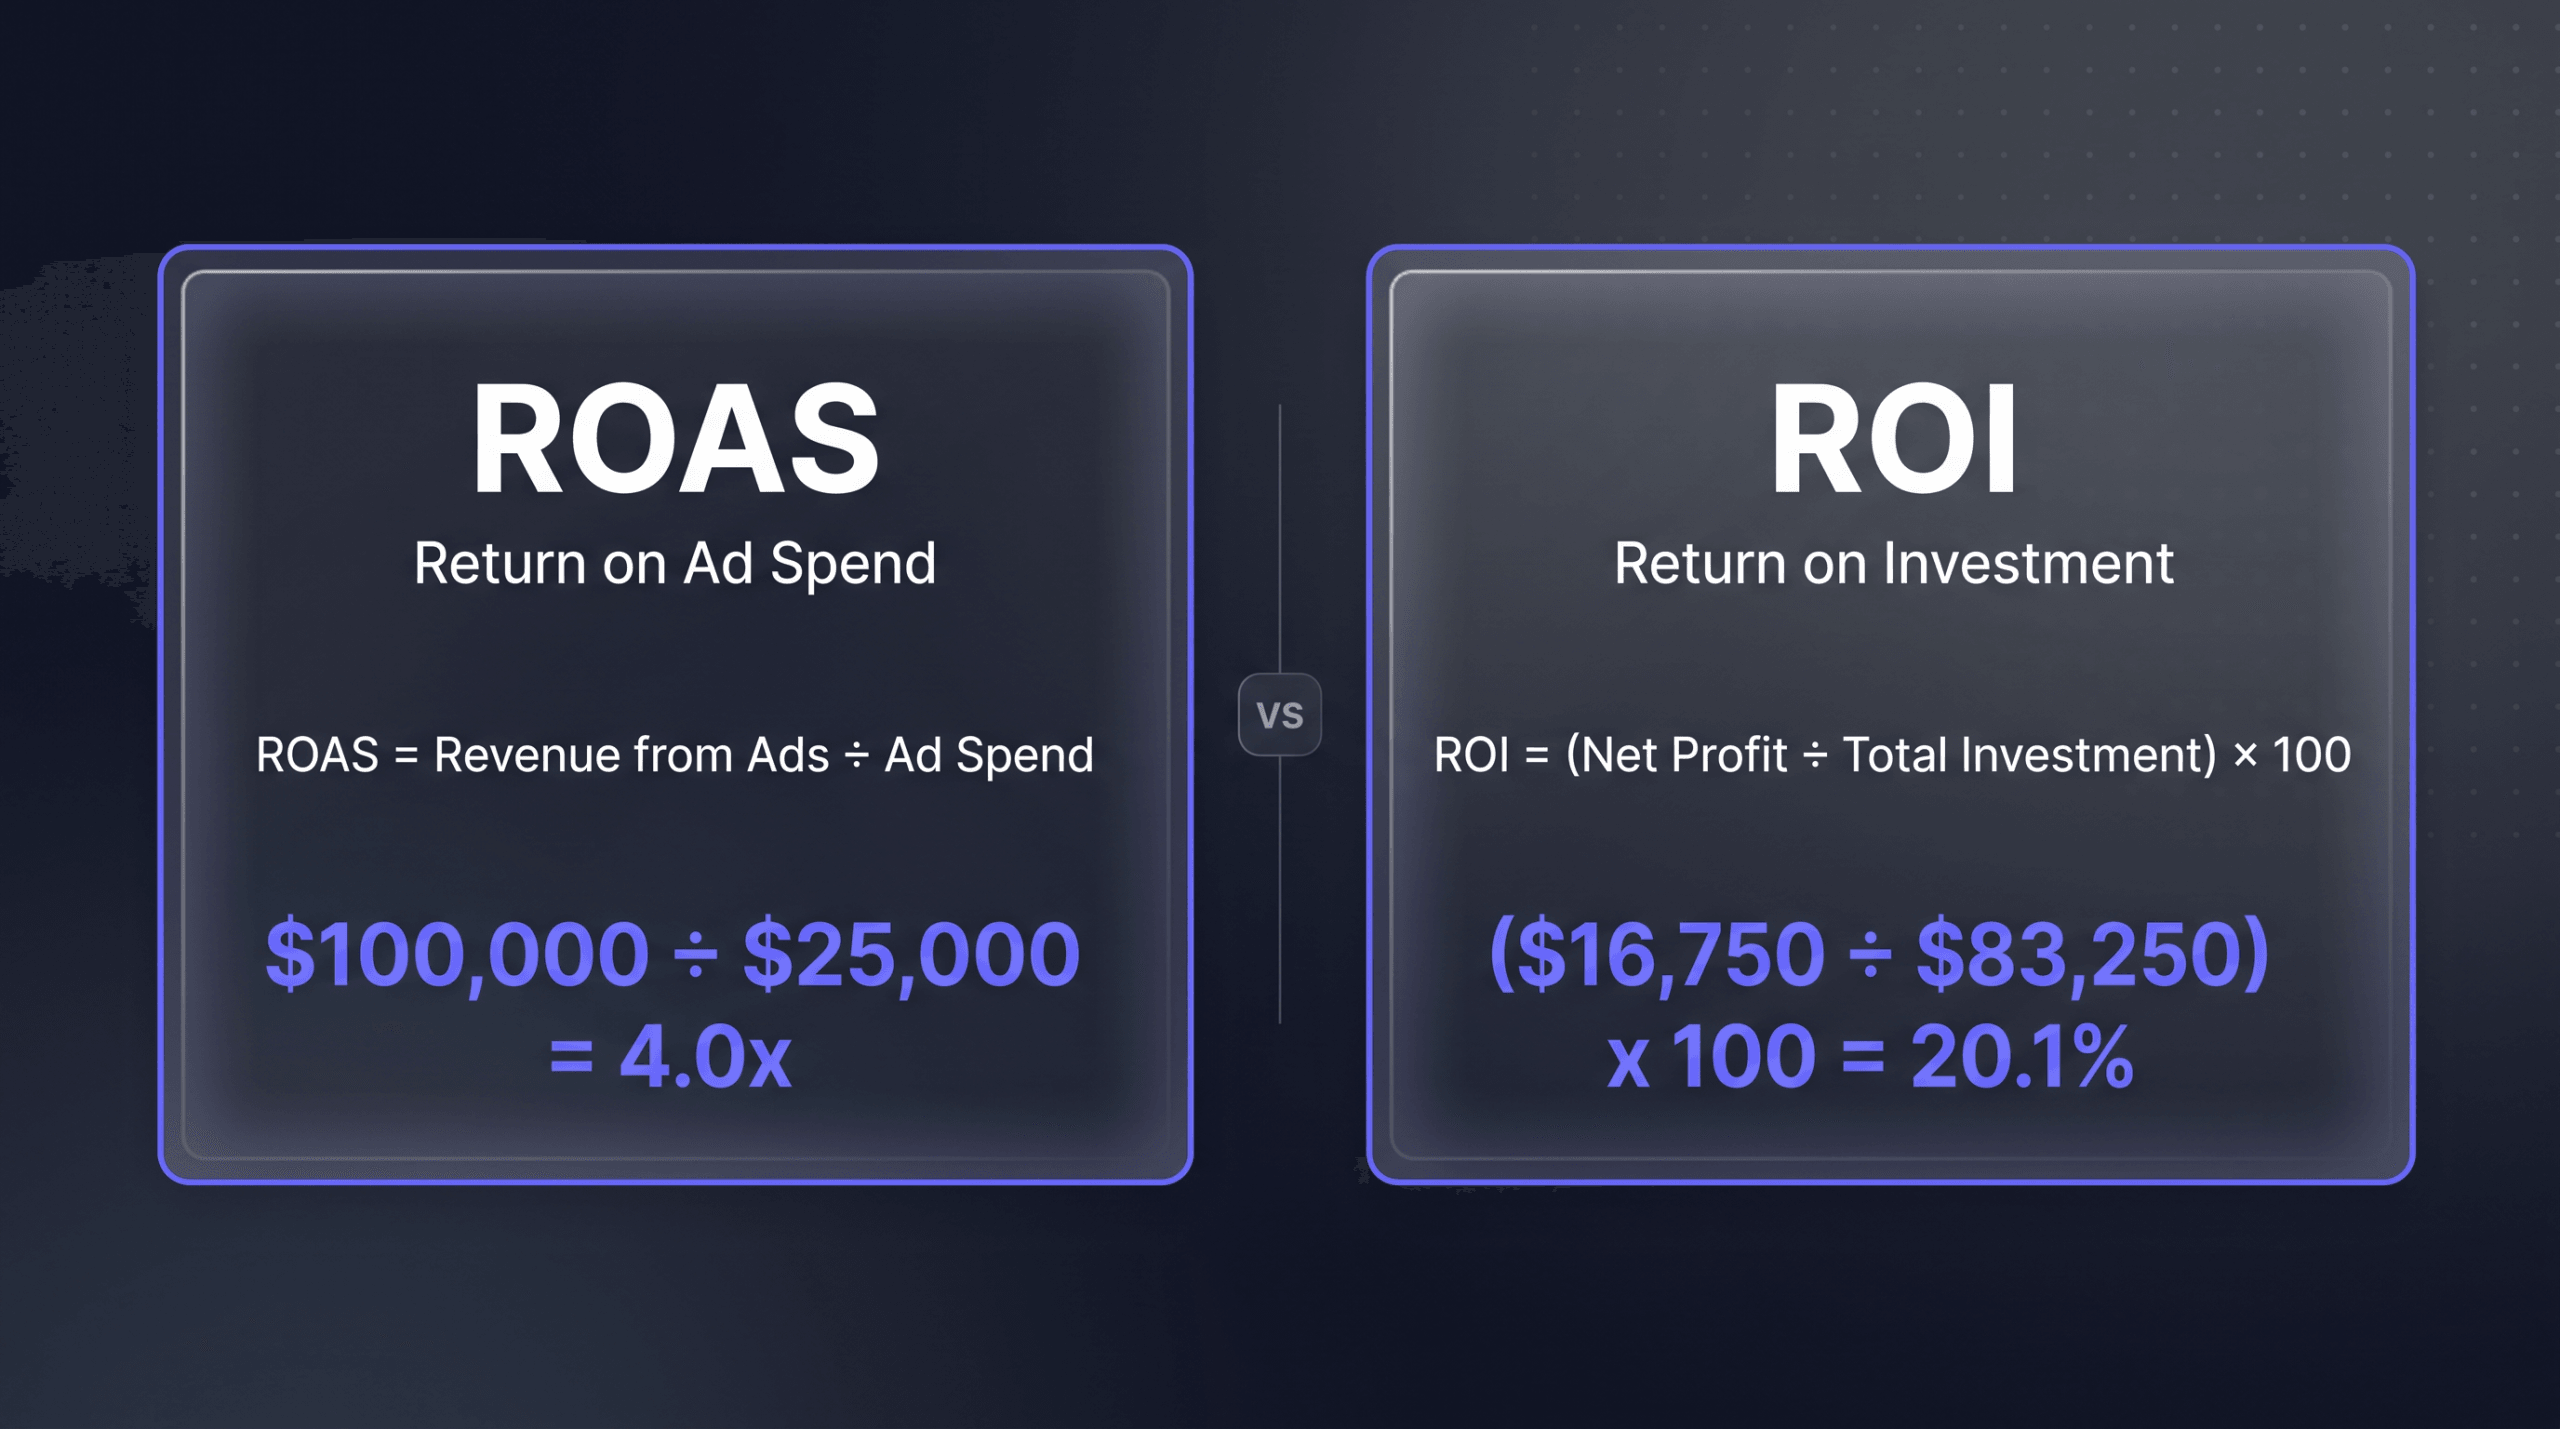

ROAS vs ROI: What’s the Difference?
TL;DR
- ROAS measures gross revenue per dollar of ad spend; ROI measures net profit after all costs. They answer completely different questions.
- A campaign can show a strong 5x ROAS and still lose money once you subtract product costs, shipping, software fees, and overhead.
- ROAS isolates ad channel efficiency so you can compare creatives, audiences, and platforms on level ground; ROI tells you whether the entire operation made money after every expense is accounted for.
- Most ad platforms only report ROAS, which means your dashboard can show healthy numbers while profits shrink.
- Use ROAS for daily ad optimization and channel comparisons; use ROI for deciding whether your marketing is actually profitable and worth scaling.
Overview
Most marketers spend their careers arguing about whether ROAS or ROI is the “right” metric, and I’m telling you right now, that’s the wrong fight. Neither metric saves you if your margins can’t survive normal optimization swings. I’ve seen accounts in the Hyros data where a 4x ROAS looked fantastic on a Monday and the business was losing money on every sale by Friday, purely because nobody had run the margin math.
Here’s what I mean. ROAS tells you how much top-line revenue each ad dollar generates. ROI tells you whether you actually made money after everything is accounted for. Confusing the two leads to scaling campaigns that look great on paper while quietly draining your bank account.
Let me give you the conclusion I’ve reached from working through thousands of ad accounts across Hyros. The big reason why people think their business isn’t scaling, why they think their ads aren’t working, is because they think it’s something they’re not doing in the ad manager. They think it’s something wrong with their front-end funnel. It isn’t. The real problem is almost always a business model margin problem masquerading as a metric problem. Fix the margin structure and suddenly a “bad” 3x ROAS campaign is printing money. Ignore it and a “great” 5x ROAS campaign quietly bleeds you out.
ROAS is a gross metric. It looks at revenue divided by ad spend and ignores every other cost in your business. ROI is a net metric: it subtracts product cost, fulfillment, software subscriptions, agency fees, team salaries, and any other expense tied to the campaign before calculating the return.
A company running Facebook Ads might report a 4x ROAS to the marketing team. That sounds great: $4 back for every $1 spent. But if the product has a 60% cost of goods sold and the company also pays for a fulfillment center, attribution software, and a media buyer’s salary, the actual ROI might be negative. The campaign is generating revenue but destroying profit.
This distinction matters more now than it did five years ago. Customer acquisition costs have risen across every major ad platform. The average eCommerce ROAS dropped to 2.87:1 in 2025, according to industry benchmarks. At that ratio, thin-margin businesses can’t afford to ignore the gap between revenue and profit. And according to LayerFive, nearly half of marketing spend is wasted due to poor attribution, meaning the ROAS numbers most teams rely on are built on bad data in the first place.
The problem compounds because ad platforms report their own version of reality. A Databox analysis found that summing all platform-reported conversions produces 150-250% of actual closed customers. Two or three platforms each claim credit for the same sale, inflating ROAS across the board. If your ROAS is inflated, your ROI calculation inherits that error and you end up scaling campaigns that were never profitable.
This article breaks down both formulas, walks through a worked example with real numbers, and explains when each metric is the right one to use.
What Is ROAS (Return on Ad Spend)?
ROAS stands for return on ad spend. The formula is simple:
ROAS = Revenue from Ads / Ad Spend
If you spend $10,000 on Google Ads in a month and those ads generate $40,000 in attributed revenue, your ROAS is 4.0 (often written as 4:1 or 400%).
ROAS only includes direct advertising costs. It doesn’t include the salary of the person managing the ads, the cost of the product being sold, the subscription to your analytics platform, or any other business expense. That is by design. ROAS is meant to isolate ad efficiency so you can compare creative variations, audiences, channels, and bidding strategies on a level playing field.
Most ad platforms report ROAS natively. Google Ads calls it “Conv. value / cost.” Meta Ads Manager shows it as “Purchase ROAS.” These in-platform numbers use the platform’s own attribution model, which means they often overcount. Two platforms can both take credit for the same sale if the customer clicked ads on both before purchasing. After iOS 14.5, 84% of iPhone users initially opted out of app tracking (Flurry, 2021; opt-in has since risen to ~37%), which collapsed Meta’s attribution window from 28 days to 7 days, a 75% reduction. The ROAS that Meta reports today is built on a fraction of the data it had access to three years ago.
An analysis of 601 Trustpilot reviews by CheckThat.ai found that server-side attribution tools consistently track 29-33% more conversions than native ad platform pixels. That gap means your in-platform ROAS is likely understated, but it also means the ROI you calculate from that ROAS is wrong in unpredictable ways, sometimes better, sometimes worse than reality.
For a deeper breakdown of the formula and its edge cases, see How to Calculate ROAS.
Key characteristics of ROAS:
- Top-line metric (uses revenue, not profit)
- Only includes ad spend in the denominator
- Platform-reported ROAS is often inflated due to attribution overlap
- Best used for comparing performance within and across ad channels
- Doesn’t tell you whether a campaign is profitable
What Is ROI (Return on Investment)?
ROI stands for return on investment. The formula is:
ROI = (Net Profit / Total Investment) x 100
Or, expanded:
ROI = [(Revenue – All Costs) / Total Investment] x 100
“All Costs” includes everything: product cost (COGS), ad spend, shipping and fulfillment, platform fees, software tools, agency retainers, and allocated overhead like team salaries. “Total Investment” is the sum of those costs.
Using the same example: $40,000 in revenue from $10,000 in ad spend. But now add $18,000 in product cost (45% COGS), $3,000 in shipping, $1,500 in software and tools, and $2,000 in allocated team cost. Total costs come to $34,500. Net profit is $5,500.
ROI = ($5,500 / $34,500) x 100 = 15.9%
That 4x ROAS translated to a 15.9% ROI. Still positive, but a very different story than “we quadrupled our money.”
Key characteristics of ROI:
- Bottom-line metric (uses net profit)
- Includes all costs in the calculation, not just ad spend
- Expressed as a percentage (can be negative)
- Answers “did we actually make money?”
- Required for business-level financial decisions
- Harder to calculate because it requires cost data from multiple systems
How Do ROAS and ROI Compare Side by Side?
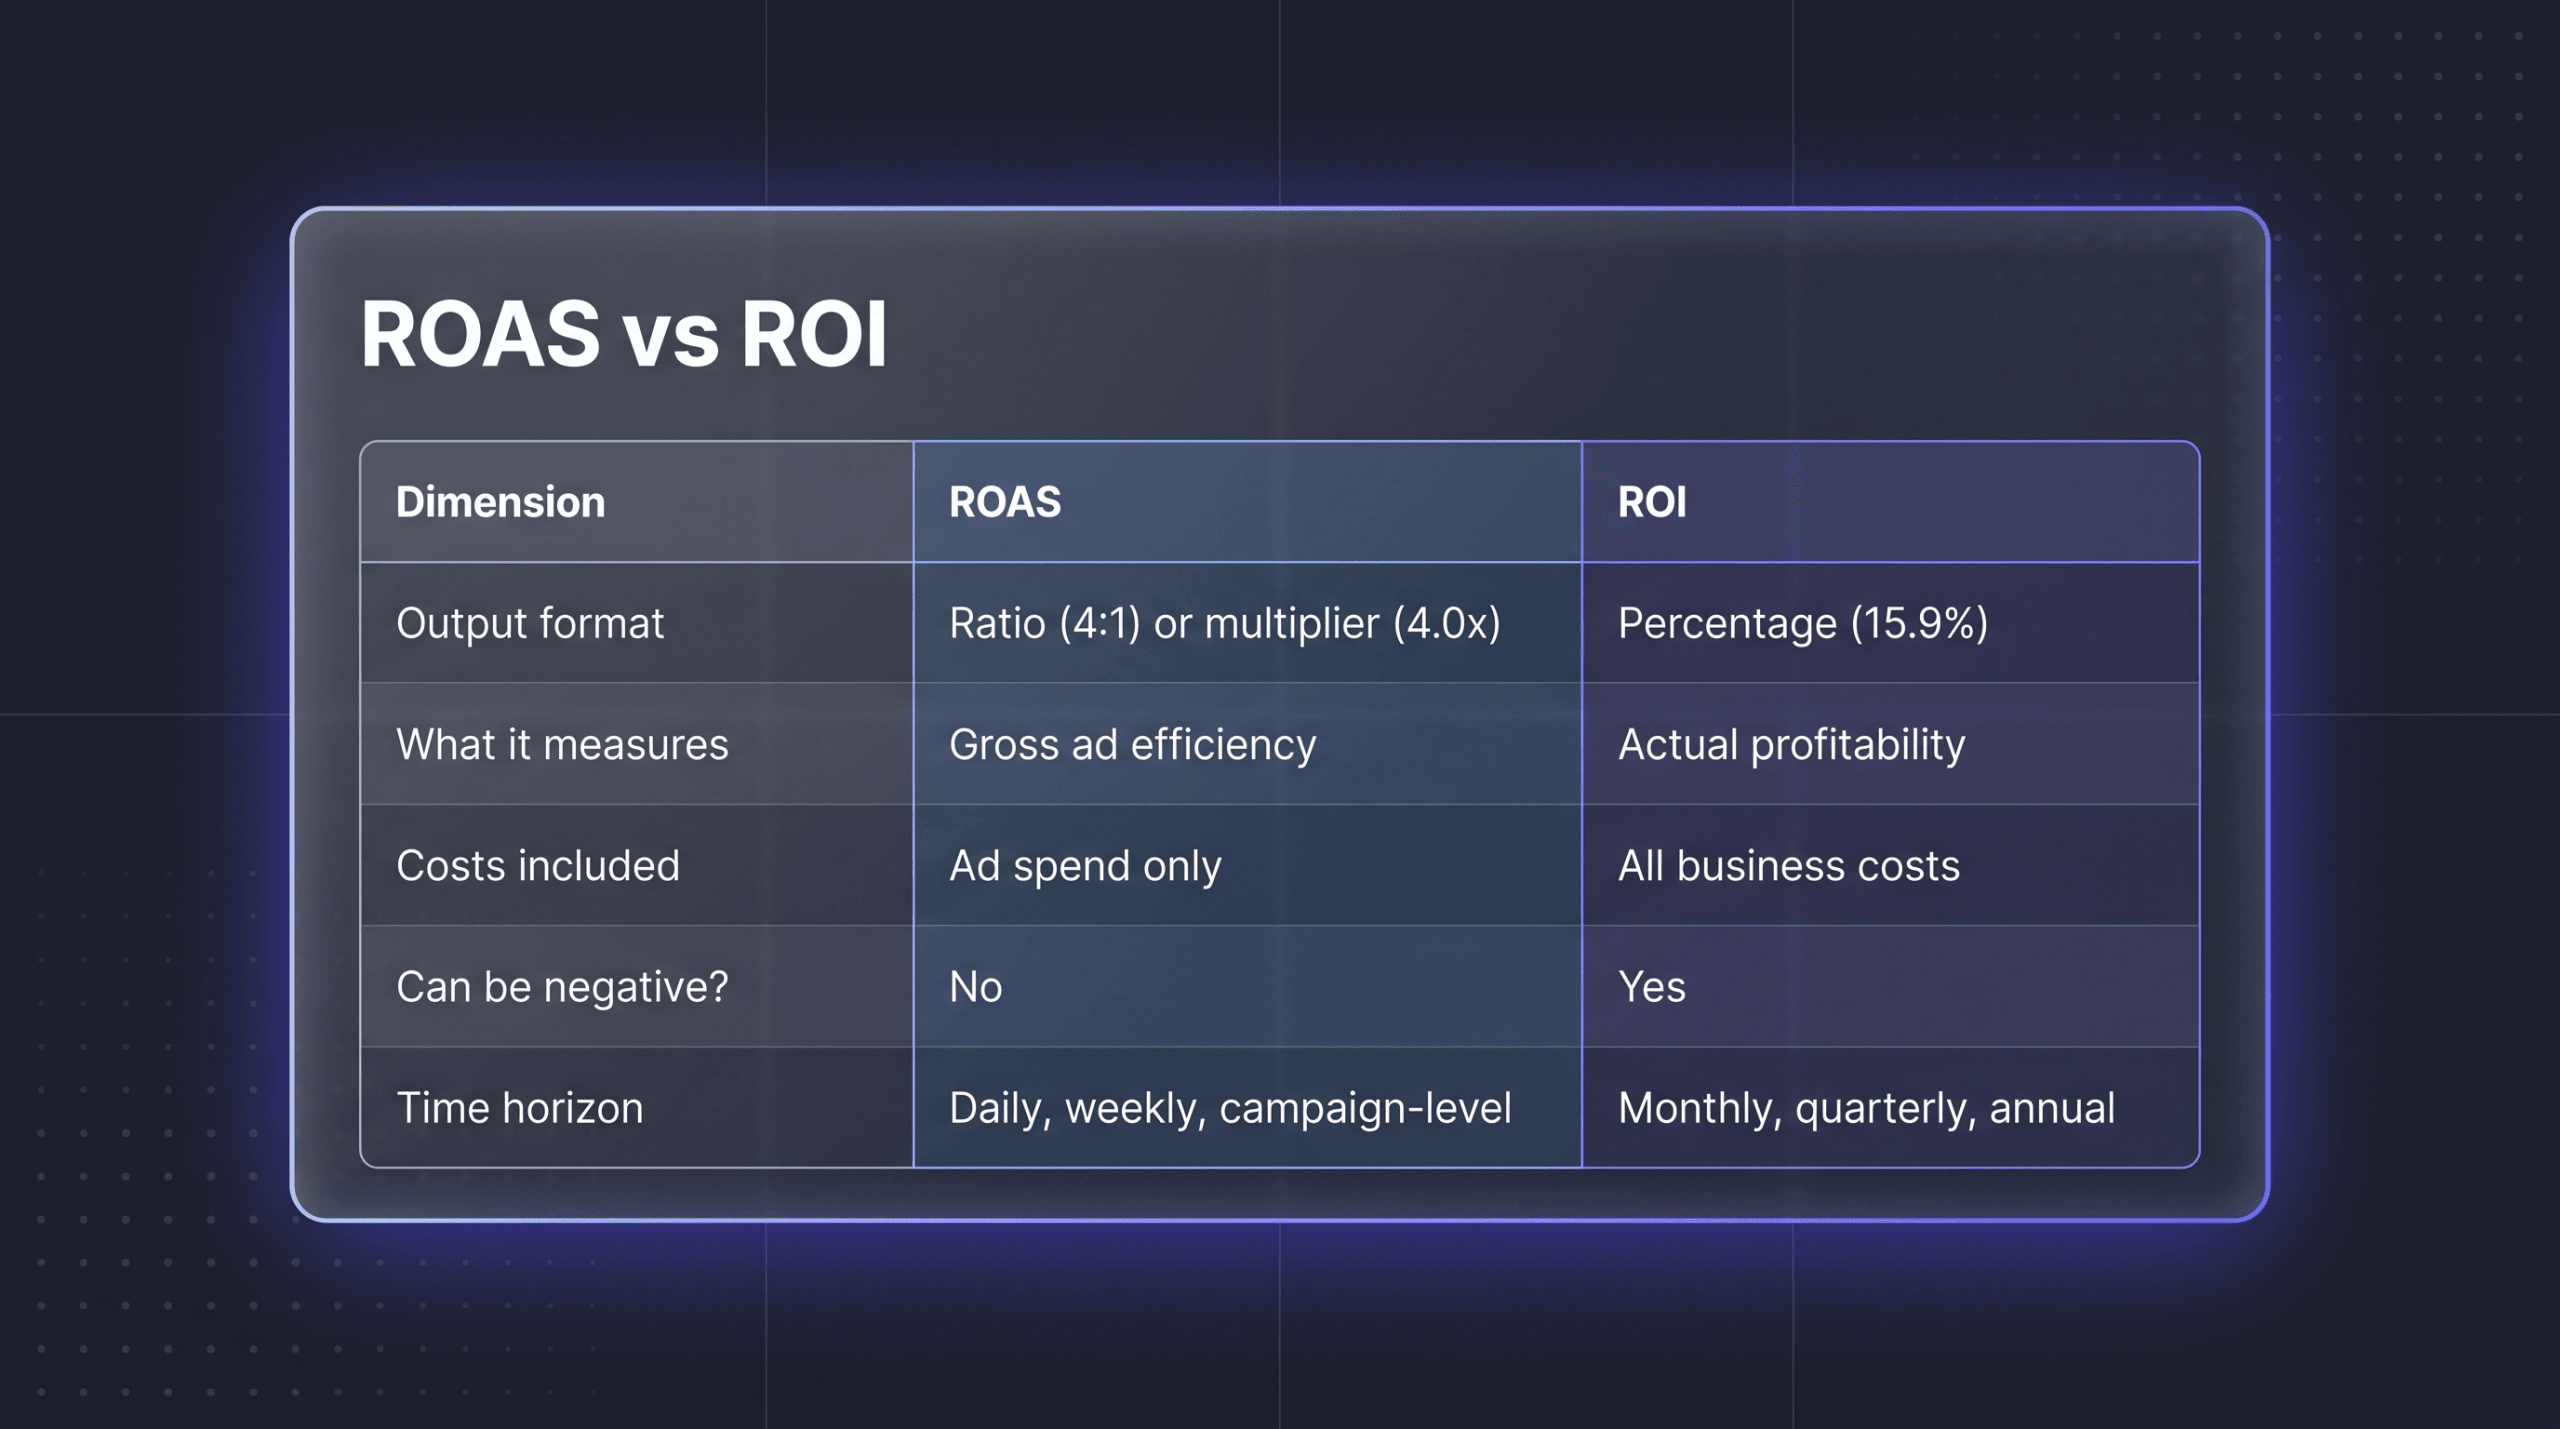
| Dimension | ROAS | ROI |
|---|---|---|
| Formula | Revenue / Ad Spend | (Net Profit / Total Investment) x 100 |
| Inputs | Revenue + ad spend only | Revenue + all costs (COGS, shipping, fees, overhead, ad spend) |
| Output format | Ratio (e.g., 4:1) or multiplier (4.0x) | Percentage (e.g., 15.9%) |
| What it measures | Gross ad efficiency | Actual profitability |
| Costs included | Ad spend only | All business costs |
| Best for | Campaign optimization, channel comparison, bidding decisions | Budget allocation, P&L reporting, executive decisions |
| Can be negative? | No (revenue and spend are always positive) | Yes (when total costs exceed revenue) |
| Reported by ad platforms? | Yes (Google, Meta, TikTok) | No (requires external cost data) |
| Time horizon | Daily, weekly, campaign-level | Monthly, quarterly, annual |
| Who uses it | Media buyers, performance marketers | CFOs, CMOs, business owners |
What Does ROAS vs ROI Look Like in a Real Campaign?
Let’s follow a single campaign from ROAS to ROI using realistic numbers for a direct-to-consumer supplement brand running Meta Ads.
Campaign facts:
- Ad spend: $25,000/month
- Revenue attributed to ads: $100,000
- Average order value (AOV): $80
- Orders: 1,250
ROAS calculation:
ROAS = $100,000 / $25,000 = 4.0x
The media buyer reports a 4x ROAS. The campaign looks strong.
Now add the costs:
| Cost category | Amount |
|---|---|
| Ad spend | $25,000 |
| Product cost (COGS at 40%) | $40,000 |
| Shipping and fulfillment | $8,750 ($7/order) |
| Payment processing (3%) | $3,000 |
| Attribution software | $1,000 |
| Creative production | $2,500 |
| Media buyer salary (allocated) | $3,000 |
| Total costs | $83,250 |
ROI calculation:
Net profit = $100,000 – $83,250 = $16,750
ROI = ($16,750 / $83,250) x 100 = 20.1%
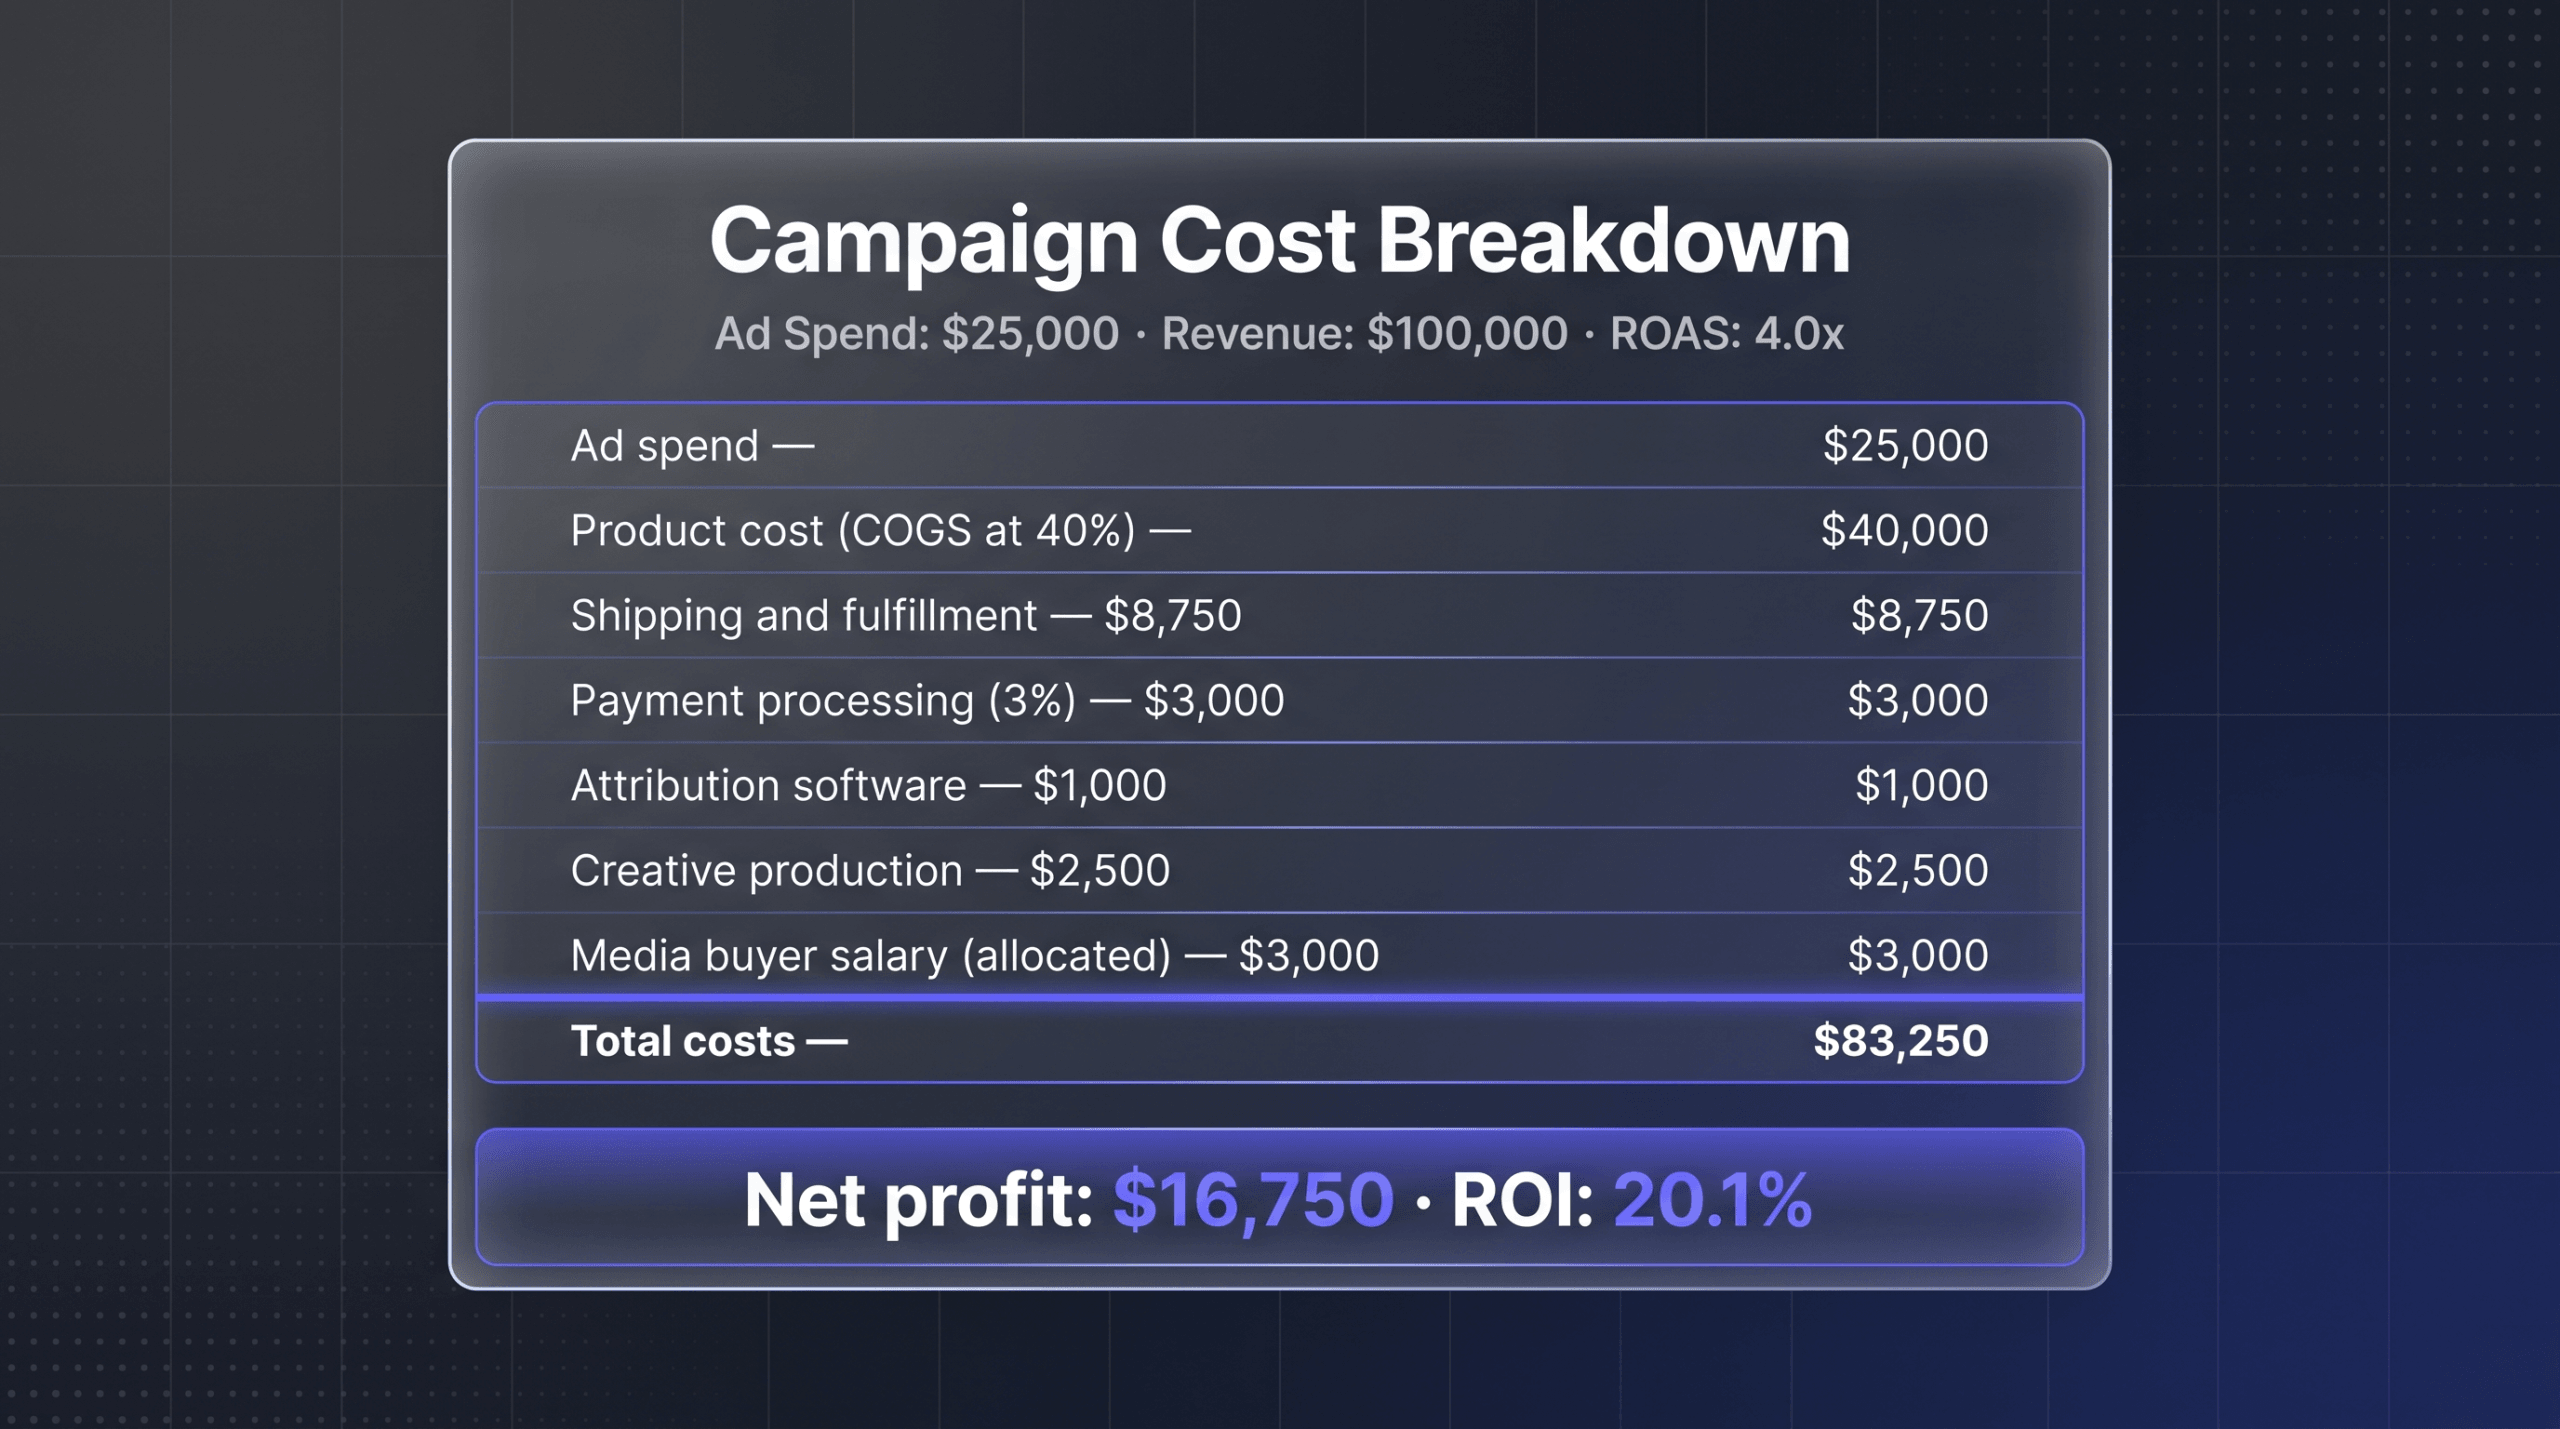
This campaign is profitable, but the margin is tight. If COGS were 55% instead of 40% (a $15,000 difference), the net profit drops to $1,750 and ROI falls to 2.1%. One bad month of returns or chargebacks and it goes negative.
Now imagine the media buyer scales ad spend to $50,000 chasing volume, but efficiency drops to a 3x ROAS. Revenue is $150,000, but COGS alone is $60,000. Shipping jumps to $13,125. Total costs hit $134,125, leaving $15,875 in profit on twice the spend. The ROI drops to 11.8% while the media buyer celebrates “scaling.”
This is why both metrics exist. ROAS told the media buyer the ads were working. ROI told the business owner the margins were shrinking.
When Should You Use ROAS?
ROAS is the right metric for tactical, day-to-day ad management decisions. Specific use cases:
1. Comparing ad creatives. If Ad A produces a 3.8x ROAS and Ad B produces a 5.1x ROAS on the same audience, Ad B is generating more revenue per dollar. Turn off A, scale B.
2. Evaluating channels. Google Ads averaging 4.5x ROAS vs. Meta Ads at 2.2x tells you where each dollar works harder. But watch for attribution overlap where both platforms claim the same conversion. Independent attribution tools like Hyros AI Attribution solve this by tracking the actual customer journey across platforms.
3. Setting bid targets. Automated bidding strategies on Google and Meta use target ROAS as an input. A 3x target ROAS tells the algorithm to bid more aggressively than a 5x target, trading efficiency for volume.
4. Testing audiences. Running the same ad to three different audiences? ROAS isolates which audience converts most efficiently relative to the cost of reaching them.
5. Monitoring blended ROAS. Blended ROAS combines all channels into a single number (total revenue / total ad spend). It smooths out platform-level attribution errors and gives a cleaner picture of overall ad efficiency.
ROAS is fast, easy to calculate, and available in real time from every ad platform. That speed is its advantage. It isn’t a profitability metric, and treating it as one is a common and expensive mistake.
When Should You Use ROI?
ROI is the right metric for strategic, business-level decisions where profitability matters more than efficiency. Specific use cases:
1. Setting marketing budgets. The CEO asks whether to increase the marketing budget by $50,000 next quarter. ROAS can’t answer this. ROI can, because it accounts for whether that additional spend produces actual profit after all costs.
2. Hiring decisions. Should the company hire a second media buyer at $6,000/month? Only ROI captures that salary as a cost and shows whether the additional campaigns they manage produce enough net profit to justify the hire.
3. Choosing between channels at a strategic level. Meta Ads might have a lower ROAS than Google Ads but a higher ROI because the products sold through Meta have better margins or lower return rates. ROI captures product-level profitability that ROAS ignores.
4. Reporting to investors or lenders. Financial stakeholders don’t care about ROAS. They care about ROI because it maps directly to the income statement. A 4x ROAS means nothing to a bank evaluating a loan application. A 35% marketing ROI does.
5. Evaluating agencies. If an agency charges $8,000/month and produces $120,000 in attributed revenue on $30,000 in ad spend, the ROAS is 4x. But after the agency fee, COGS, and all other costs, the ROI might be 12%. Comparing that 12% to what the brand achieved in-house at an 18% ROI is the real conversation. For a deeper look at how agencies structure multi-client attribution reporting, see our agency attribution guide.
6. Kill decisions. A product line with a 5x ROAS but a negative ROI due to high return rates and expensive shipping should be cut. ROAS would tell you to scale it. ROI tells you to kill it.
Why Can a High ROAS Still Lose Money?
The most dangerous mistake in paid advertising is optimizing for ROAS without understanding your gross margin. Here is the math that explains why.
Scenario A: High-margin product (70% gross margin)
- Revenue: $100,000
- COGS: $30,000
- Ad spend: $25,000
- Other costs: $10,000
- Total costs: $65,000
- Net profit: $35,000
- ROAS: 4.0x
- ROI: 53.8%
Scenario B: Low-margin product (30% gross margin)
- Revenue: $100,000
- COGS: $70,000
- Ad spend: $25,000
- Other costs: $10,000
- Total costs: $105,000
- Net profit: -$5,000
- ROAS: 4.0x
- ROI: -4.8%
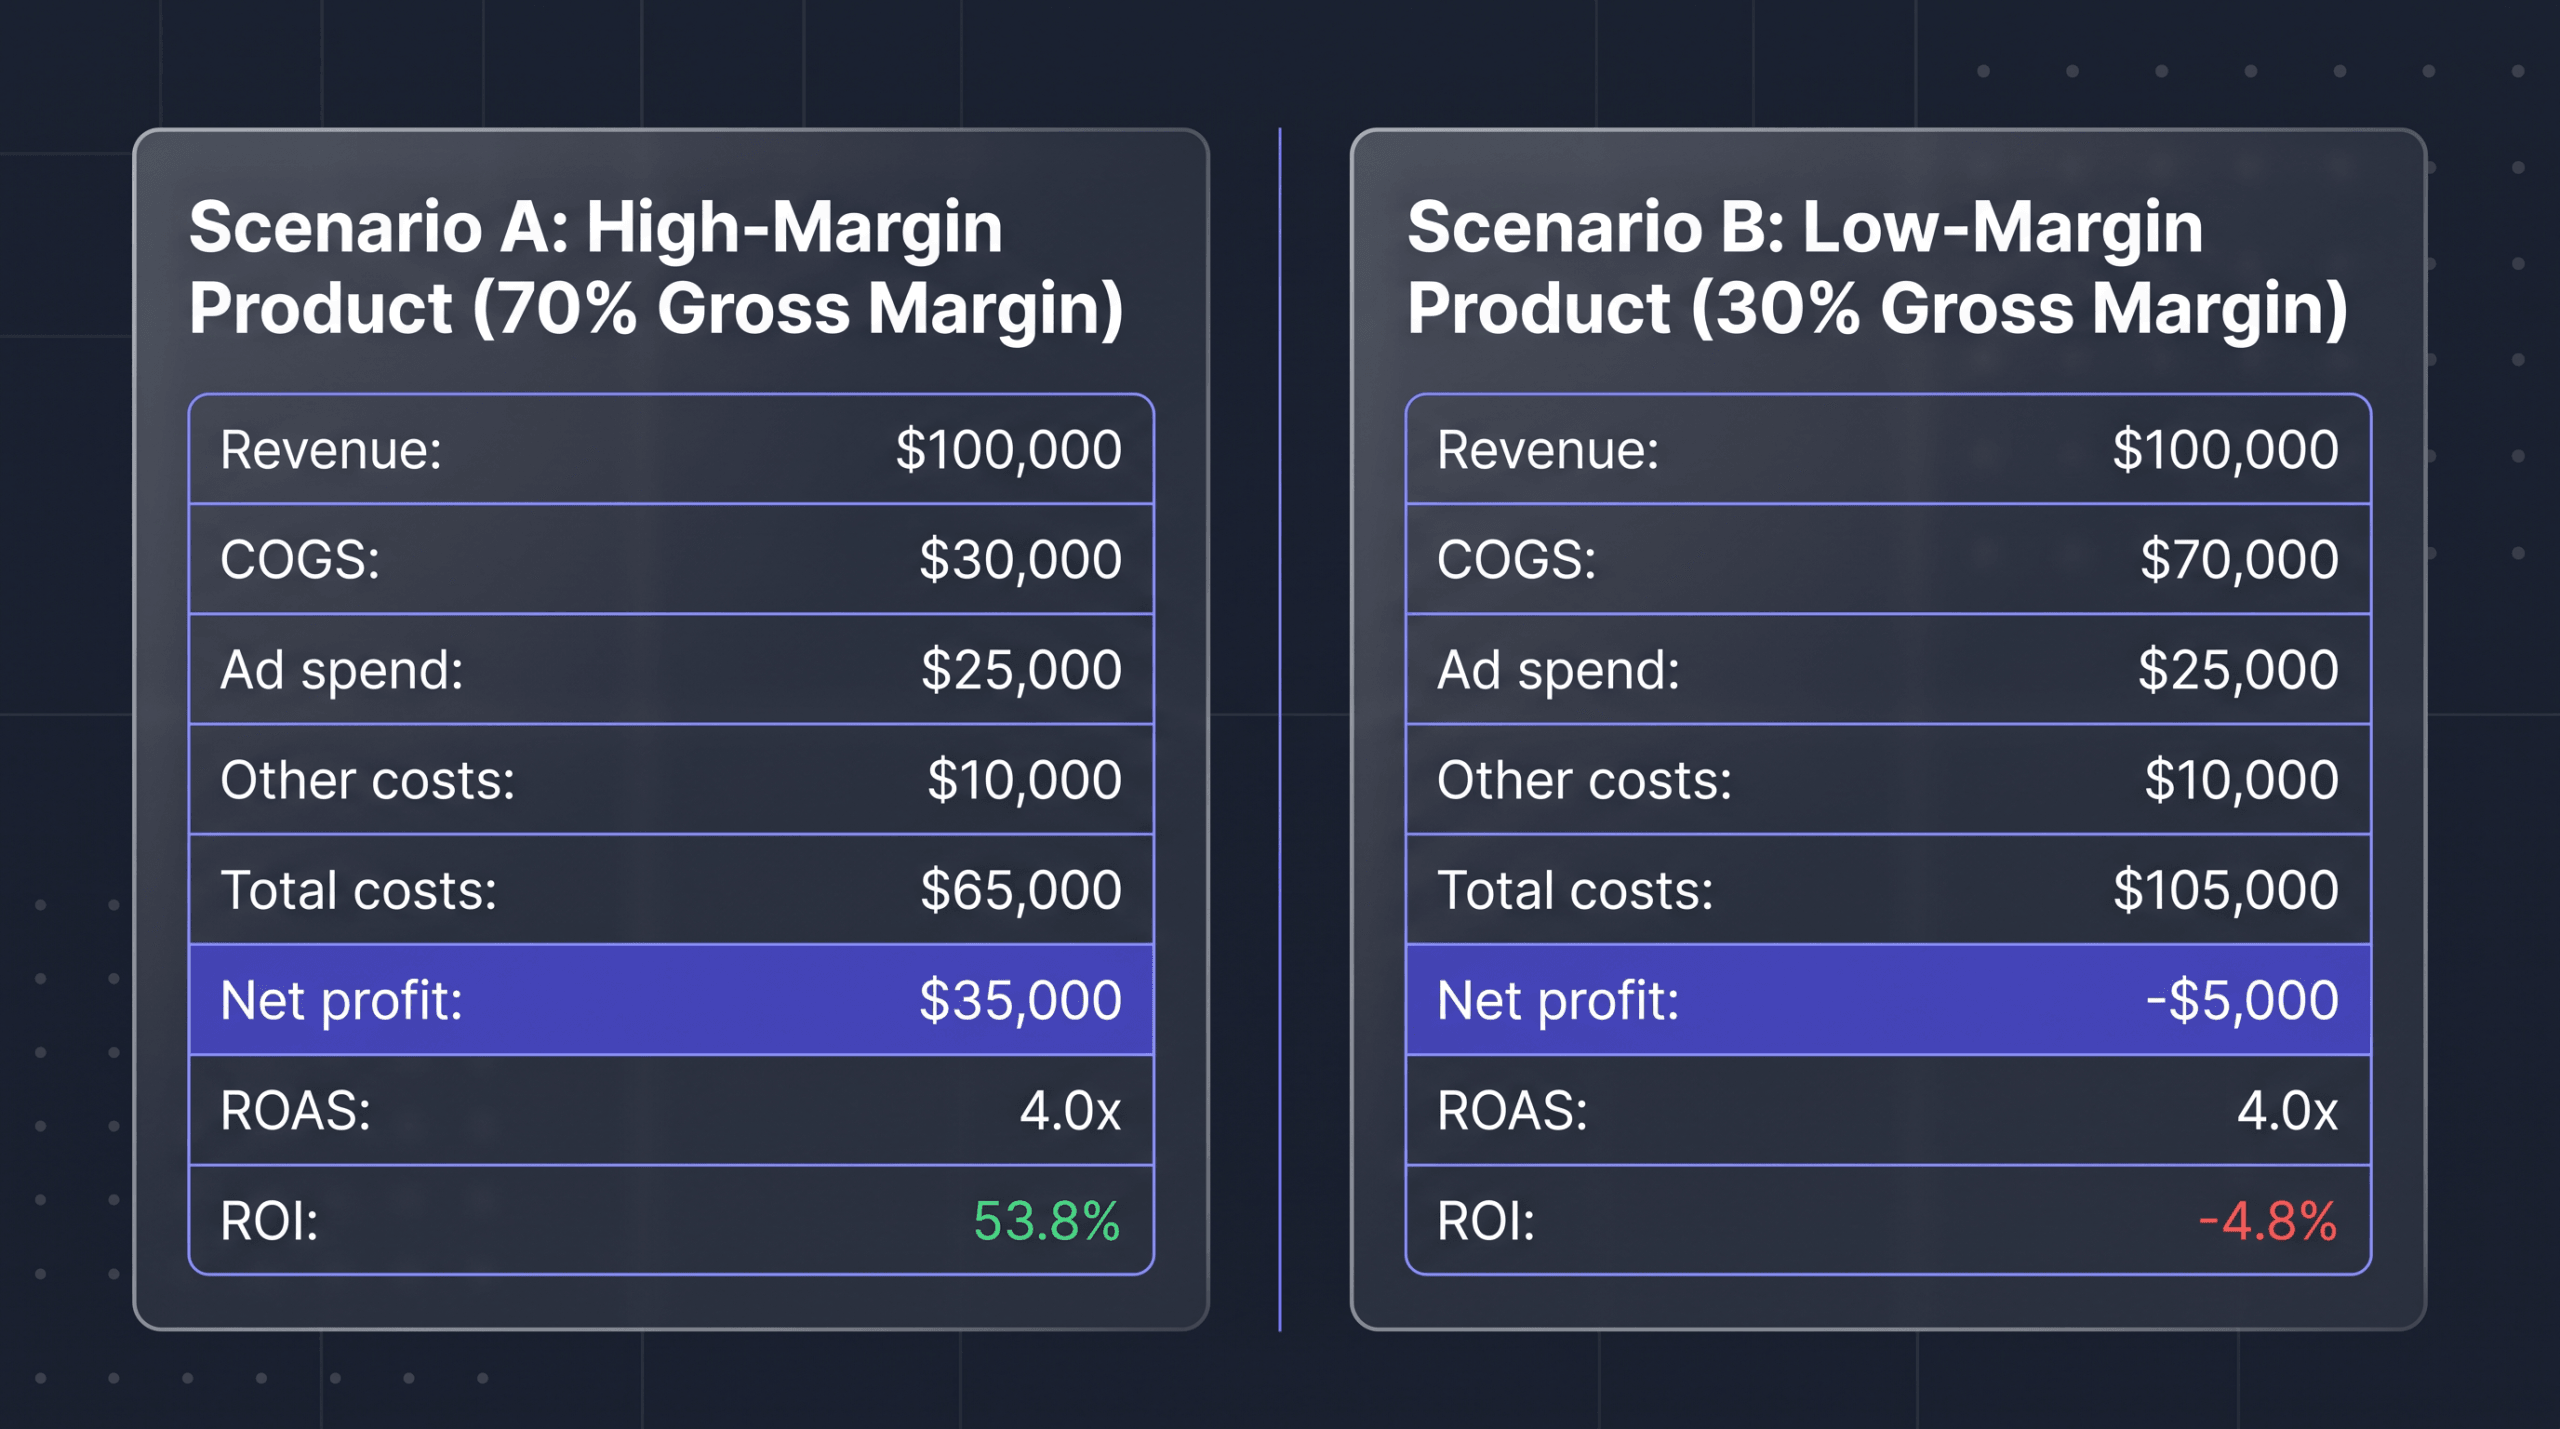
Same revenue. Same ad spend. Same ROAS. But Scenario A produced $35,000 in profit while Scenario B lost $5,000.
This is the gross margin trap. ROAS is blind to product cost. A media buyer optimizing to a 4x ROAS target will scale both campaigns equally. The business owner looking at ROI will scale A and kill B.
Here’s a scenario I see constantly that makes this concrete. Picture two campaigns side by side. Campaign One is hitting a 5x ROAS: $50,000 spend driving $250,000 in revenue. The media buyer is pumped. But this brand sells a physical kit with 72% COGS ($180,000), $12,500 in fulfillment, $5,000 in software and team costs. Total costs: $247,500. Net profit: $2,500. That’s a 1.01% ROI, barely above water, no room for a bad week of returns. Campaign Two is running 3x ROAS: $50,000 spend, $150,000 in revenue. Looks weak by dashboard standards. But this brand is selling a $997 digital course with 15% COGS ($22,500), $4,500 in total operating costs. Total costs: $77,000. Net profit: $73,000. ROI: 94.8%. The “mediocre” 3x ROAS campaign is 73 times more profitable than the “impressive” 5x ROAS campaign. Most teams would scale the wrong one.
And here’s what makes this worse: no matter what you do in the ad manager, no matter what you do in your funnels, you’re only going to get a 10-15% improvement out of that layer. That’s it. I’m not saying optimization doesn’t matter. It matters. But if the core problem is a margin structure that doesn’t work, squeezing 12% more efficiency out of your targeting isn’t going to fix it. You need 40%, 50%, 100% improvement, and that doesn’t come from the ad manager. It comes from fixing what you’re actually selling and what it costs you to deliver it.
I learned this lesson with my own ad accounts. When I ran $300,000 in annual ad spend through Hyros tracking, I discovered that $100,000 of it (a full third) was going to campaigns that produced zero measurable return. At the same time, 25% of campaigns I had turned off were actually generating 200-500% ROI, but platform tracking couldn’t see the conversions. The ROAS the platforms reported was wrong in both directions: overcounting on some campaigns, undercounting on others. Every ROI decision I made from that data was compromised.
The trap gets worse with bundled products, tiered pricing, and subscription models where the first-order margin is negative by design (expecting to profit on renewals). Without connecting ad attribution data to margin data at the order level, there’s no way to know which sales are actually profitable.
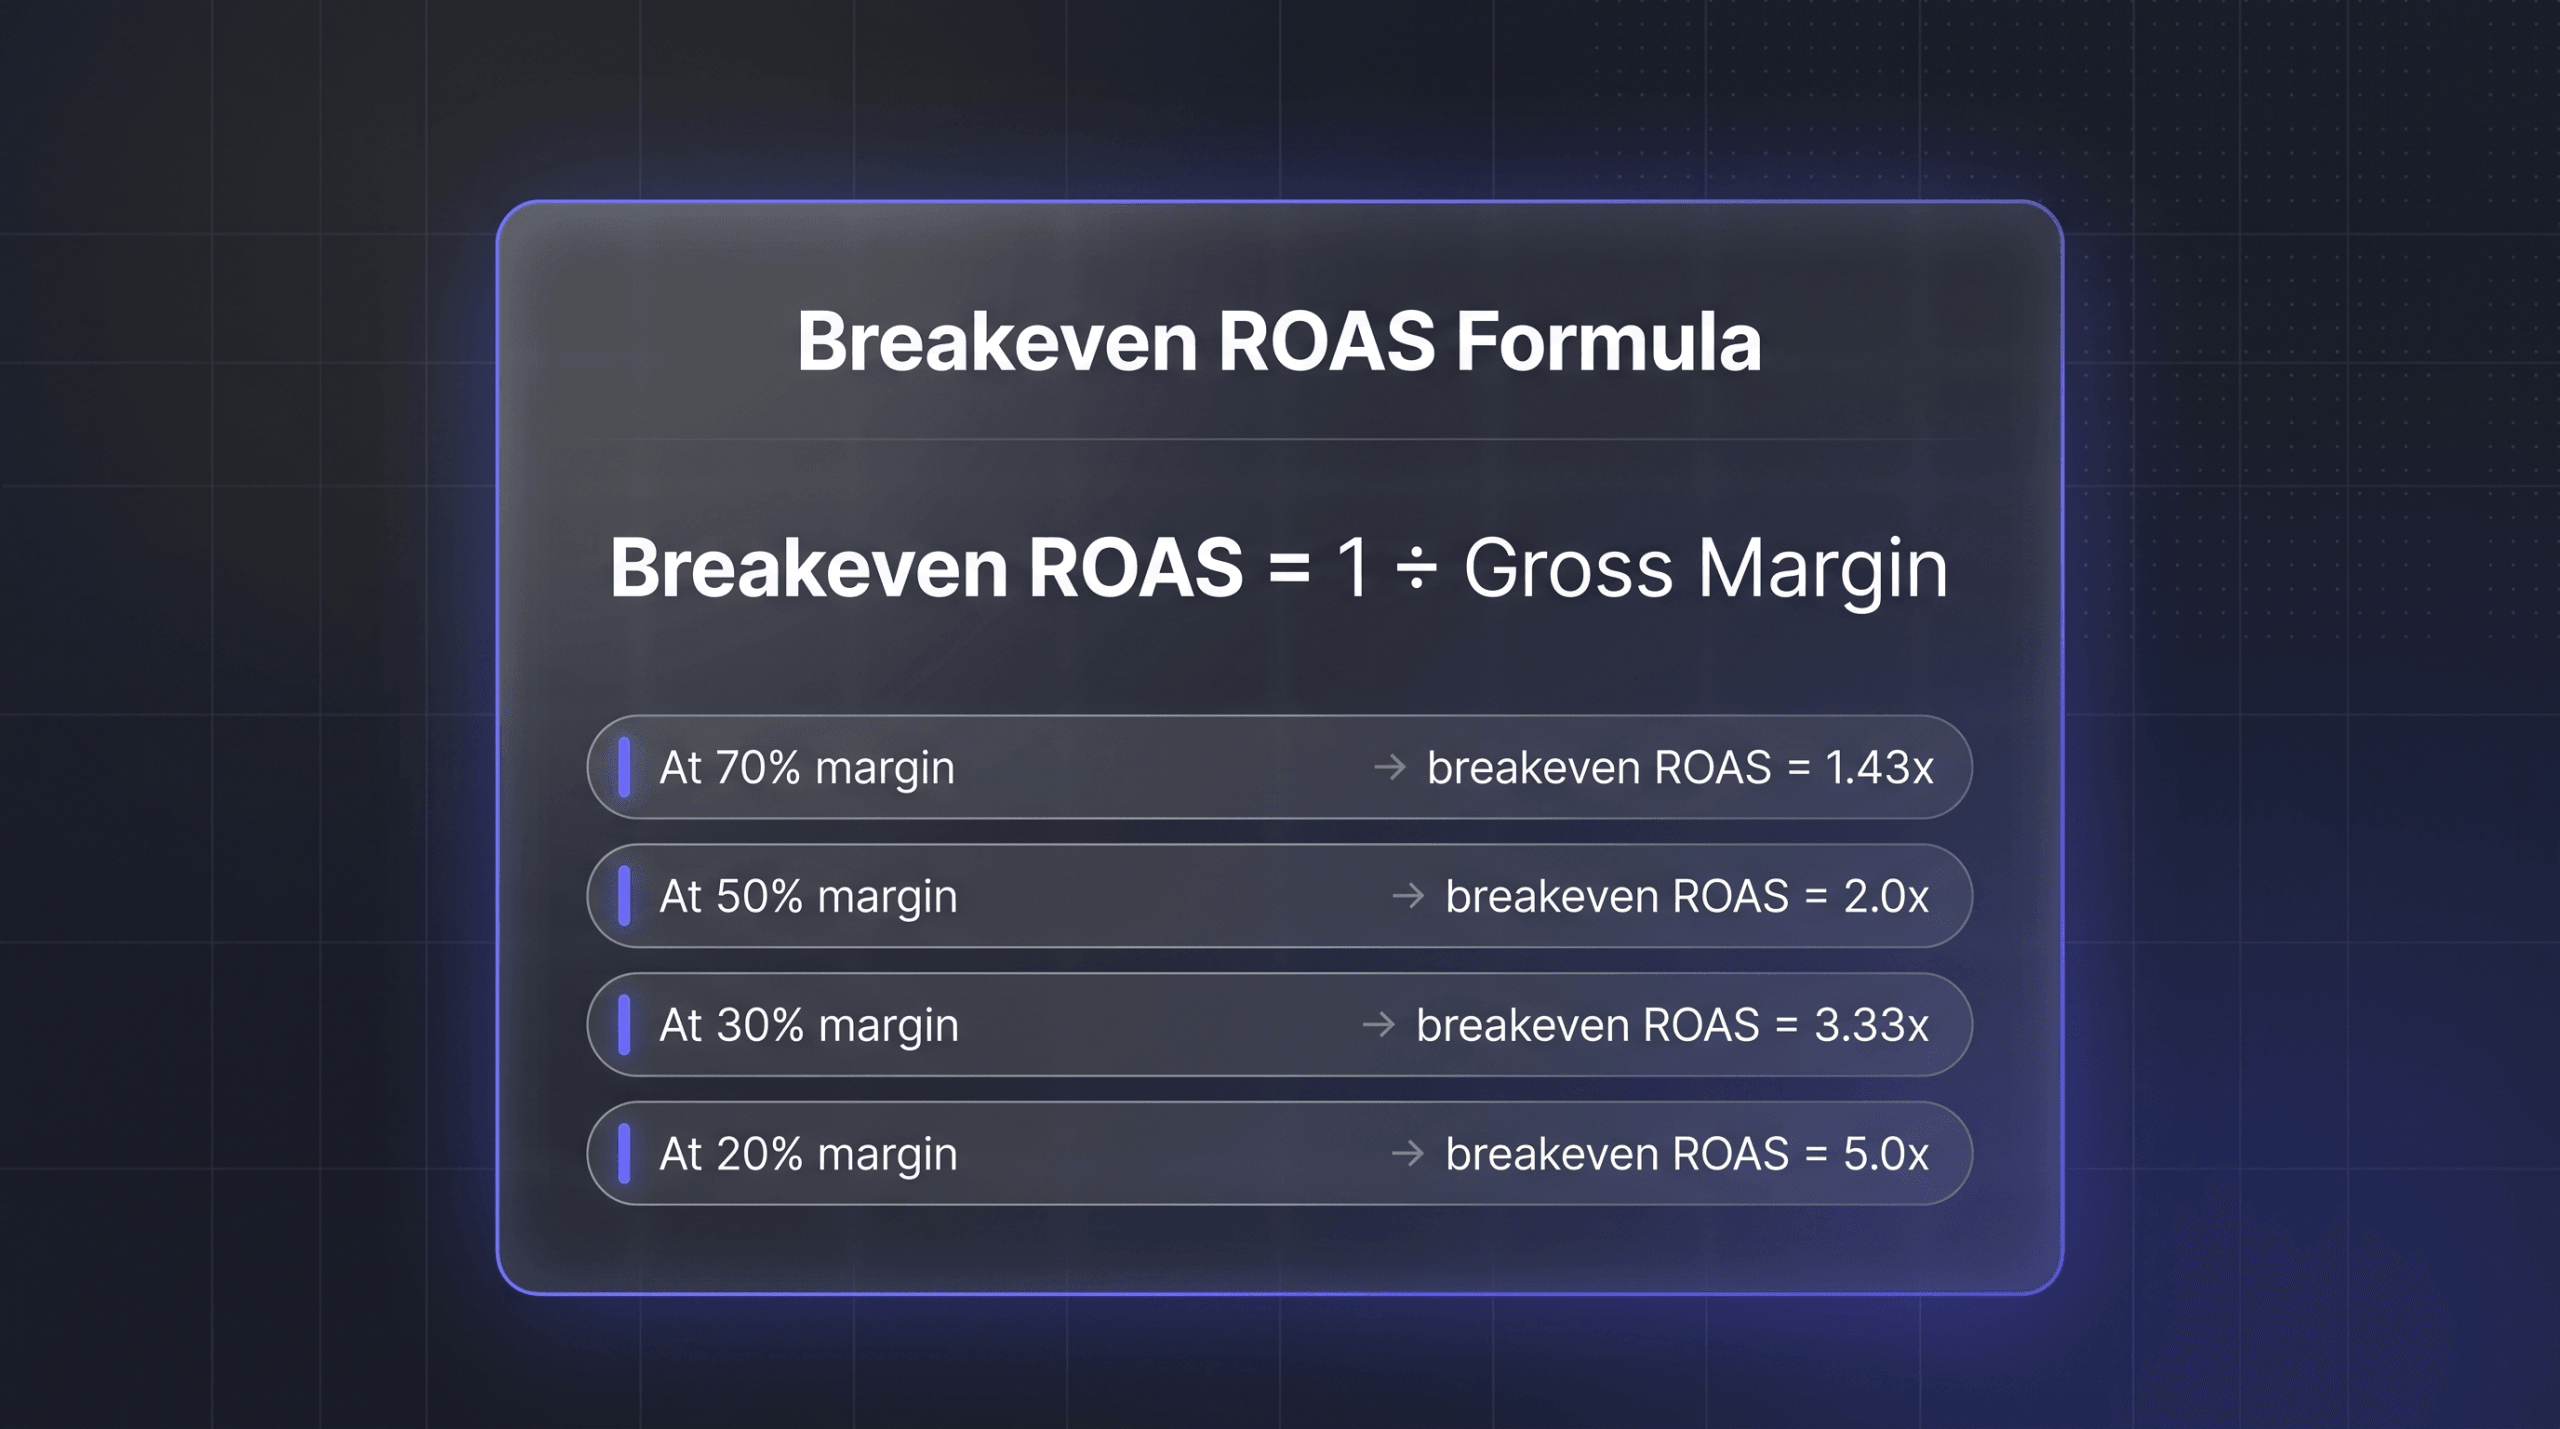
The breakeven ROAS formula makes this concrete:
Breakeven ROAS = 1 / Gross Margin
- At 70% margin: breakeven ROAS = 1.43x
- At 50% margin: breakeven ROAS = 2.0x
- At 30% margin: breakeven ROAS = 3.33x
- At 20% margin: breakeven ROAS = 5.0x
Any ROAS below that number means you’re losing money on every sale before you even account for operating costs. A business with 20% margins needs a 5x ROAS just to break even on ad spend alone. Add operating costs and the real target is closer to 7-8x.
How Does Hyros Report Both ROAS and ROI?
Most ad platforms report ROAS. Most accounting tools report ROI. Almost nothing connects the two at the campaign, ad set, or ad level. That gap is where money gets wasted.
Hyros connects ad attribution data to revenue and cost data in a single view. Here is how it handles each metric:
ROAS in Hyros:
Hyros tracks the customer journey across platforms, devices, and sessions using first-party data. When a sale happens, Hyros attributes it to the specific ad, ad set, and campaign that drove it, instead of relying on each platform’s self-reported numbers. This produces a de-duplicated ROAS that doesn’t double-count sales across Google and Meta. According to Hyros, this approach tracks 20-50% more sales than ad platforms report on their own. Their Shopify integration data shows Facebook underreports conversions by roughly 30%, Google by 29%, and TikTok by 33%.
The practical impact is visible in case study data. Tony Robbins’ media buying team used Hyros attribution to scale ad spend by 43% on Business Mastery and over 100% on Unleash The Power Within across a six-month period, decisions that required trusting the ROAS data enough to put more money behind it. Tan Books hit 500%+ ROAS during Black Friday/Cyber Monday 2023 and doubled their ad effectiveness year-over-year, but only after switching to server-side attribution that could actually see the full customer journey.
ROI in Hyros:
By integrating product cost and margin data, Hyros can show margin-adjusted returns alongside raw ROAS. Instead of seeing “this campaign did 4x ROAS,” you see “this campaign produced $16,750 in profit at a 20.1% ROI.” That changes which campaigns you scale, which you optimize, and which you shut down. According to Hyros, brands see at least a 15% increase in ad ROI on average, a number they back with a 90-day guarantee offering 20-30% ROI improvement or a refund.
Why this matters:
When your blended ROAS drops from 4x to 3x, you need to know whether that means your profit went down 25% or whether a shift in product mix actually improved your bottom line. ROAS alone can’t answer that. ROAS connected to margin data can.
Track ROAS and margin-adjusted ROI in one place. Book a demo to see how Hyros connects ad spend to actual profit.
FAQ
Is ROAS the same as ROI?
No. ROAS (return on ad spend) measures gross revenue generated per dollar of ad spend. ROI (return on investment) measures net profit after subtracting all costs, including product cost, shipping, fees, and overhead. ROAS is always a positive ratio. ROI can be negative. A campaign with a strong ROAS can have a weak or negative ROI if the product margins are thin.
Which is more important, ROAS or ROI?
Neither is universally more important. They serve different purposes. ROAS is more useful for daily campaign management because it isolates ad efficiency and is available in real time from ad platforms. ROI is more useful for business-level decisions like budget allocation, hiring, and profitability analysis. The best-run marketing teams track both: ROAS for tactical optimization, ROI for strategic direction.
What is a good ROAS and ROI?
A “good” ROAS depends on your gross margin. A business with 70% margins can profit at a 2x ROAS. A business with 25% margins needs at least a 5x ROAS just to break even on ad spend. The average eCommerce ROAS in 2025 is approximately 2.87:1. For ROI, most businesses target 15-30% for paid marketing campaigns, though this varies by industry, growth stage, and whether the company is optimizing for profit or market share.
How do you convert ROAS to ROI?
You need your gross margin and total non-ad costs to convert. The rough formula is:
ROI = [(Revenue – COGS – Ad Spend – Other Costs) / (Ad Spend + Other Costs)] x 100
For example, if ROAS is 4x on $25,000 ad spend, revenue is $100,000. Subtract $40,000 COGS (40%), $25,000 ad spend, and $10,000 in other costs. Net profit is $25,000. Total investment is $75,000. ROI = 33.3%. There is no shortcut formula because ROI requires cost data that ROAS doesn’t include.
Does Google Ads show ROI?
No. Google Ads shows ROAS (labeled as “Conv. value / cost”) but not ROI. Google doesn’t have access to your product costs, shipping expenses, agency fees, or overhead, so it can’t calculate net profit. To see ROI at the campaign level, you need to export Google Ads data and combine it with cost data from your accounting or ERP system, or use an attribution tool like Hyros that integrates both revenue and cost data.
Standalone Summary
ROAS (return on ad spend) measures gross revenue per ad dollar. The formula is Revenue / Ad Spend. A $50,000 spend generating $200,000 in revenue produces a 4x ROAS. ROI (return on investment) measures net profit after all costs. The formula is (Net Profit / Total Investment) x 100. If that $200,000 in revenue came with $120,000 in product cost and $30,000 in operating expenses, net profit is $0 and ROI is 0%, despite the 4x ROAS. The one-sentence distinction: ROAS tells you how efficiently your ads generate revenue; ROI tells you whether your business actually made moner from that revenue. Every marketing team should track both. Use ROAS for daily ad decisions. Use ROI for monthly business decisions. The gap between them is your margin exposure.
Related in This Series
Silo: Ad Attribution Fundamentals
More from the Ad Attribution Fundamentals series:
- How to Calculate ROAS: Formula, Examples, and Benchmarks
- Blended ROAS Explained: Why It Matters in 2026
- What Is Ad Attribution? A Complete 2026 Guide
- What Is Hyros? How the Ad Tracking Platform Actually Works
Also explore: