

Post-Purchase Surveys vs Tracked Attribution: When to Use Each
TL;DR
- Surveys and tracked attribution answer different questions, not competing ones
- Surveys catch dark social discovery; tracked data drives spend and ROAS decisions
- The gap between the two views is the dark social estimate; reconciliation is the deliverable
Post-purchase surveys and tracked attribution are not rival methods. Surveys capture self-reported discovery (TikTok mentions, podcast shoutouts, word-of-mouth) that device-bound tracking cannot see, while tracked attribution captures behavioral revenue, click-to-conversion paths, and ad-level performance that self-reports distort by a meaningful margin. Use surveys for channel discovery and dark social estimation, and use tracked data for spend optimization and ROAS decisions. Run both, treat the gap between the two views as the dark social estimate, and make the reconciliation loop the actual deliverable.
Why This Question Is Framed Wrong Everywhere Else
The page-1 SERP for “post-purchase survey vs tracked attribution” lines up like a vendor war. Fairing argues surveys are the antidote to tracking decay. KnoCommerce pushes survey data into Klaviyo activation. Lifesight routes the conclusion to its marketing mix model. Triple Whale sells both and frames “use both” with stack-biased recommendations. Every result frames the choice as either/or, and every result has a product to sell at the end of it.
I have audited accounts that ran one method and accounts that ran both. The single-method accounts had a blind spot the size of their dark social footprint. The both-methods accounts had a reconciliation gap they did not know how to read. Surveys and tracked attribution are not rival methods. They are orthogonal answers to different questions, and the right deliverable is the reconciliation loop that runs between them.
For the broader model landscape this sits inside, see Multi-Touch Attribution.
What Post-Purchase Surveys Actually Measure
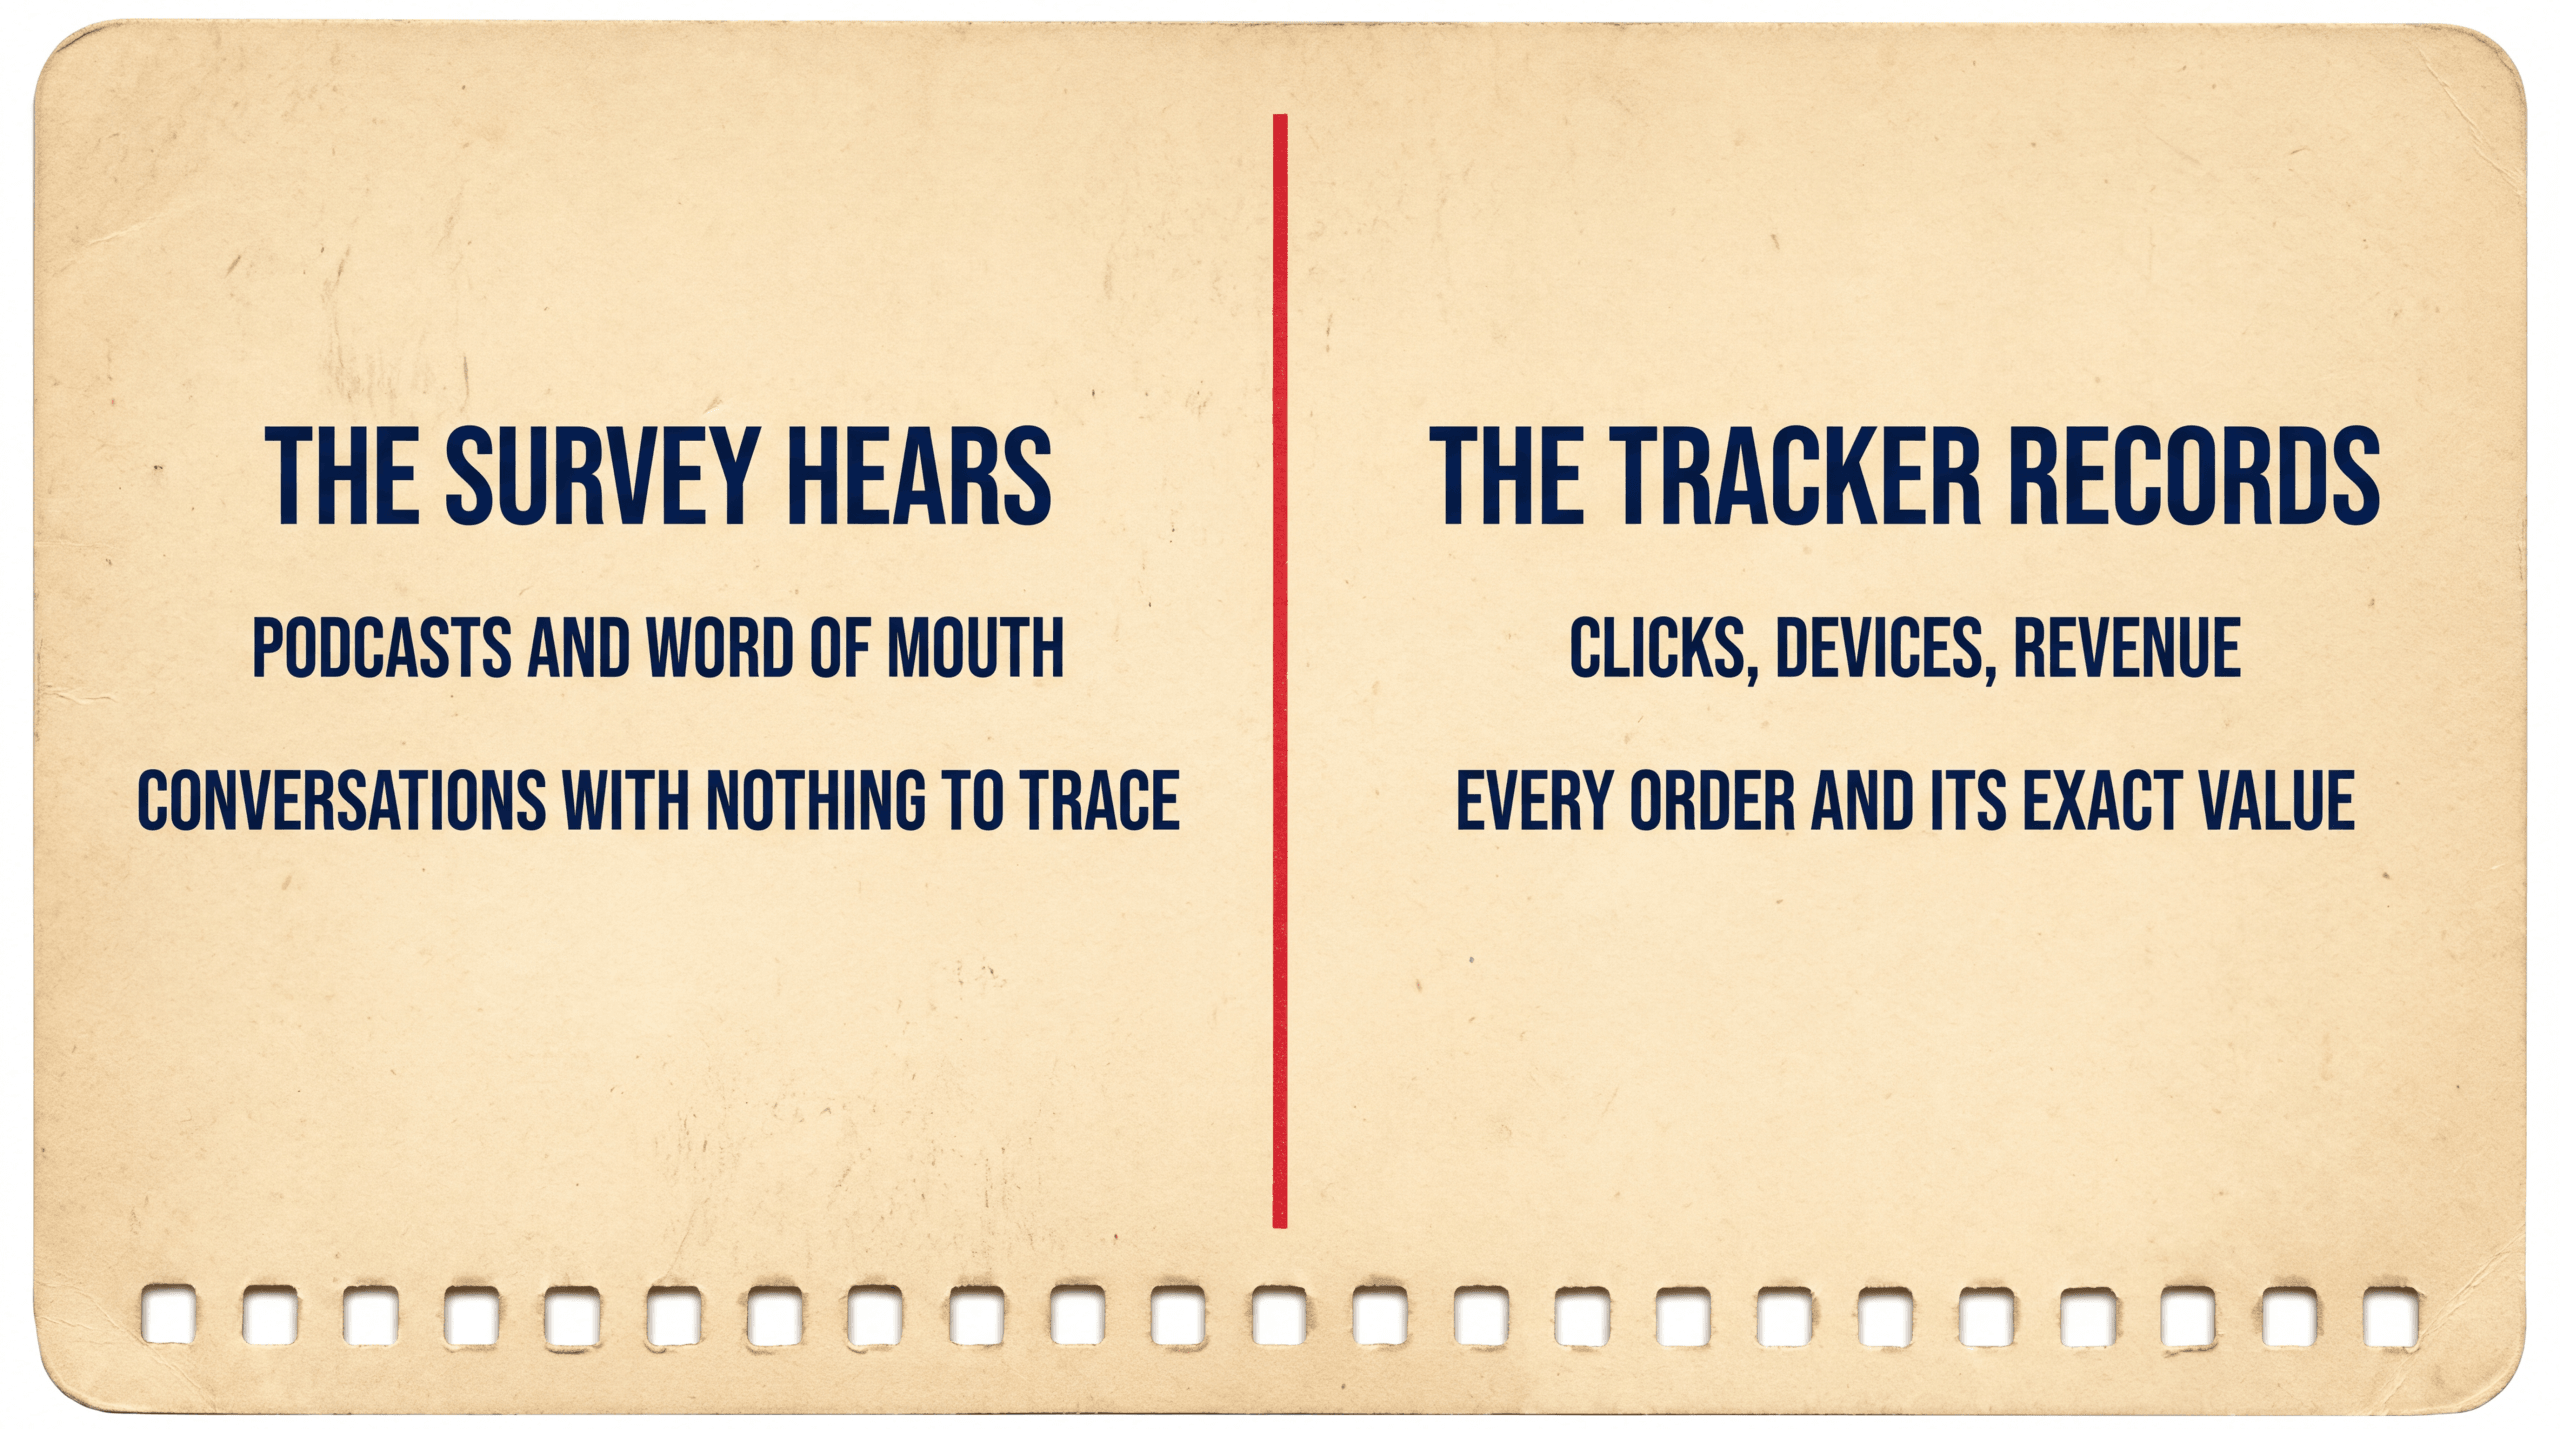
A post-purchase survey asks the buyer one question at the moment they are most engaged with your brand: “How did you hear about us.” The answer is self-reported, single-source, and unfiltered by any tracking layer.
That is the unique value. Surveys are the only attribution method that catches channels with no click event. Podcast mentions. TikTok organic shoutouts. A friend’s recommendation at dinner. A YouTube video the buyer watched on the kitchen TV while a different device sat in their pocket. The pixel did not fire. The CAPI event did not log. The UID layer has nothing to match against. The only way you ever hear about any of it is by asking.
After iOS 14.5 rolled out in April 2021, the dark social problem accelerated. Flurry Analytics reported roughly 96 percent of US iPhone users initially opted out of ATT, with current opt-in around 35 to 37 percent per Adjust Q2 2025. That share of the audience is invisible to client-side tracking by design. Surveys catch them anyway, because the question is “how did you hear about us,” not “which pixel saw you first.”
What surveys measure well:
- Self-reported discovery channel for buyers, including channels with no click event
- Brand recall, sentiment, and unaided awareness signals
- Dark social: word-of-mouth, podcasts, offline media, organic social with no UTM
- Channel mix for top-of-funnel discovery, where tracking is structurally blind
What surveys do not measure:
- Which specific ad creative drove the click
- Revenue per ad set or campaign
- Cross-device journey reconstruction
- Spend-level decisions where ad-level granularity matters
For the model-level question of which touchpoint should get credit, see Last-Touch Attribution.
What Tracked Attribution Actually Measures
Tracked attribution runs on the click-to-conversion chain. The pixel logs the click, the conversion API logs the event, the UID layer reconciles the journey across sessions and devices. Every step has a timestamp and an identifier. The chain is auditable. Hyros runs this layer across more than 4,000 customers and tracks more than $3.5 billion in attributed revenue. CheckThat.ai’s 2026 review across 601 Hyros implementations found tracked attribution surfaces 29 to 33 percent more conversions versus native platform reporting, which is the size of the deduplication gap a survey will never measure for you.
What tracked attribution measures well:
- Revenue per channel, deduplicated across platforms
- Ad-level performance: campaign, ad set, creative
- Click-to-conversion paths and cross-device journeys
- Lifetime value attached back to acquisition channel
- Incrementality test outcomes when paired with a holdout
What tracked attribution does not measure:
- Channels with no click event (podcasts, TV, word-of-mouth, offline)
- Why a buyer chose you over a competitor
- Unaided brand awareness or recall
- The portion of the audience that opted out of ATT or cleared cookies before purchase
The two methods are not in tension. They are answering different questions. Tracked attribution answers spend questions. Surveys answer discovery questions. Each one is the wrong tool for the other one’s job.
For why platform-reported numbers run higher than reconciled revenue, see Meta Ads Reporting and Attribution Accuracy.
The Self-Report Accuracy Gap (And Why It Exists)
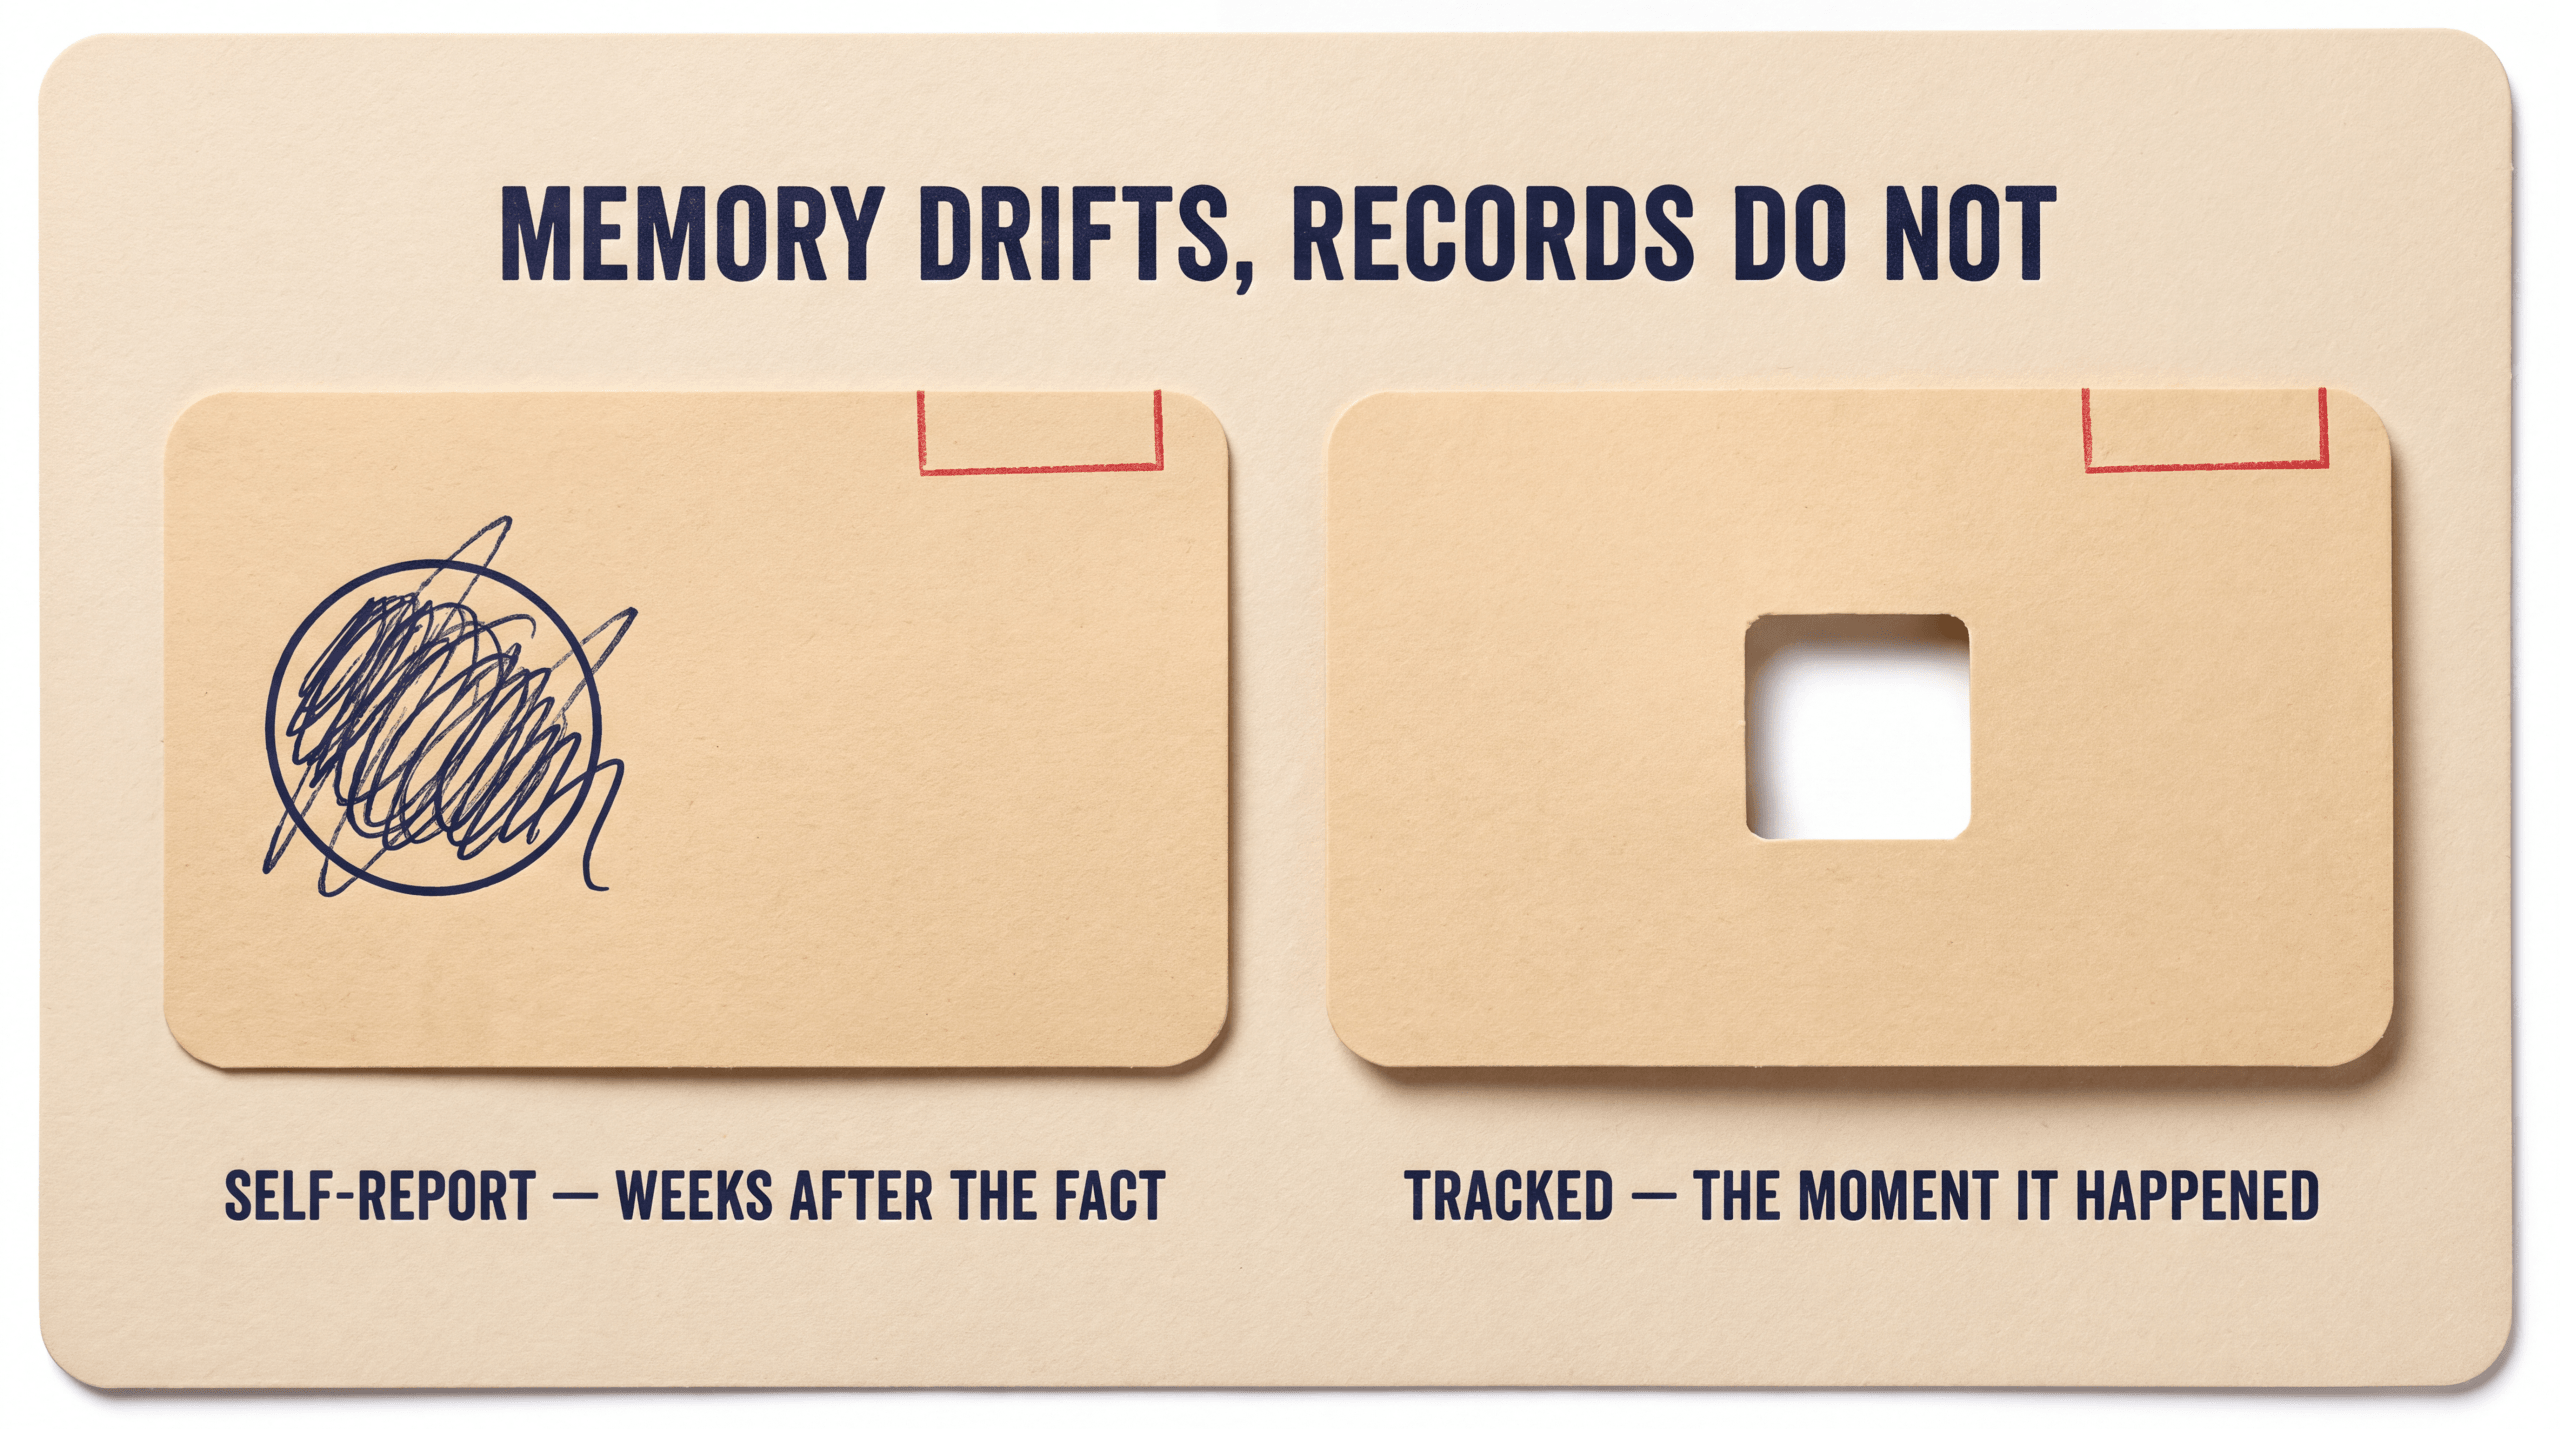
Self-reported attribution drifts from behavioral attribution. The drift is well-documented in survey-methodology literature on recall bias, and it happens for four overlapping reasons.
Recall bias. Buyers remember the most recent or most memorable touch, not the chain that actually moved them. A buyer who saw your Meta ad on Monday, your Google retargeting on Tuesday, and your podcast sponsorship on Wednesday will often credit “the podcast” because the audio context made it stick.
Last-touch bias in respondent memory. Buyers report the touchpoint nearest to the purchase decision more often than the touchpoint that started the journey. The brain favors recency for retrieval. That mirrors the structural bias in last-click tracked attribution, just with different distortion.
Social desirability bias. “A friend recommended you” sounds nicer than “I saw an ad.” Buyers under-credit ads in self-reports because the cultural valence of “advertising” is lower than “word of mouth.” The bias runs one direction. Surveys systematically under-count paid channels and over-count organic.
Survey design effects. Forced-choice questions with a fixed channel list cap the dark social signal. Open-ended questions catch dark social but introduce coding overhead and reduce response rate. The trade-off is real and unavoidable.
The size of the drift varies by category, time-since-purchase, and survey design. I have seen accounts where survey-reported credit lined up within five points of tracked credit on direct-response channels, and accounts where survey credit for TikTok ran two to three times the tracked credit on the same channel. The drift is not constant, which is why a single global correction factor does not work. Reconcile per channel, per quarter.
The Decision Matrix: Which Method Answers Which Question
There is one right tool per question. Mixing tools introduces noise. Treating one tool as universal introduces blind spots. Run the question through this matrix before you decide which dashboard to open.
| Business question | Right tool | Reason |
|---|---|---|
| Where did you first hear about us | Survey | Self-report is the only signal for channels with no click event |
| Which ad creative drove conversions | Tracked | Surveys lack ad-level granularity |
| How much spend should I shift to TikTok | Tracked | Spend decisions need revenue-per-dollar, not recall data |
| Is podcast sponsorship working | Survey primary + lift test | Podcasts have no click; lift test confirms incremental revenue |
| What is true ROAS per channel | Tracked | One revenue line, deduplicated; survey share cannot do this |
| What is our dark social baseline | Survey | Gap between survey and tracked credit estimates dark social |
| Which campaigns drove repeat purchase | Tracked + LTV blend | Repeat purchase data lives in CRM, joined to acquisition source |
| What brand do customers associate us with | Survey (open-ended) | Brand recall is a self-report by definition |
The same buyer can appear in both columns. A customer who saw a podcast ad on Monday, clicked a Google retargeting ad on Tuesday, and bought on Wednesday should be credited to “podcast” in the discovery view (survey) and to “Google retargeting” in the spend view (tracked). Both credits are correct inside their own scope. The mistake is forcing them into the same column.
For where blended ROAS fits across both views, see Blended ROAS: Definition and Calculation.
How to Reconcile When Survey and Tracked Data Disagree
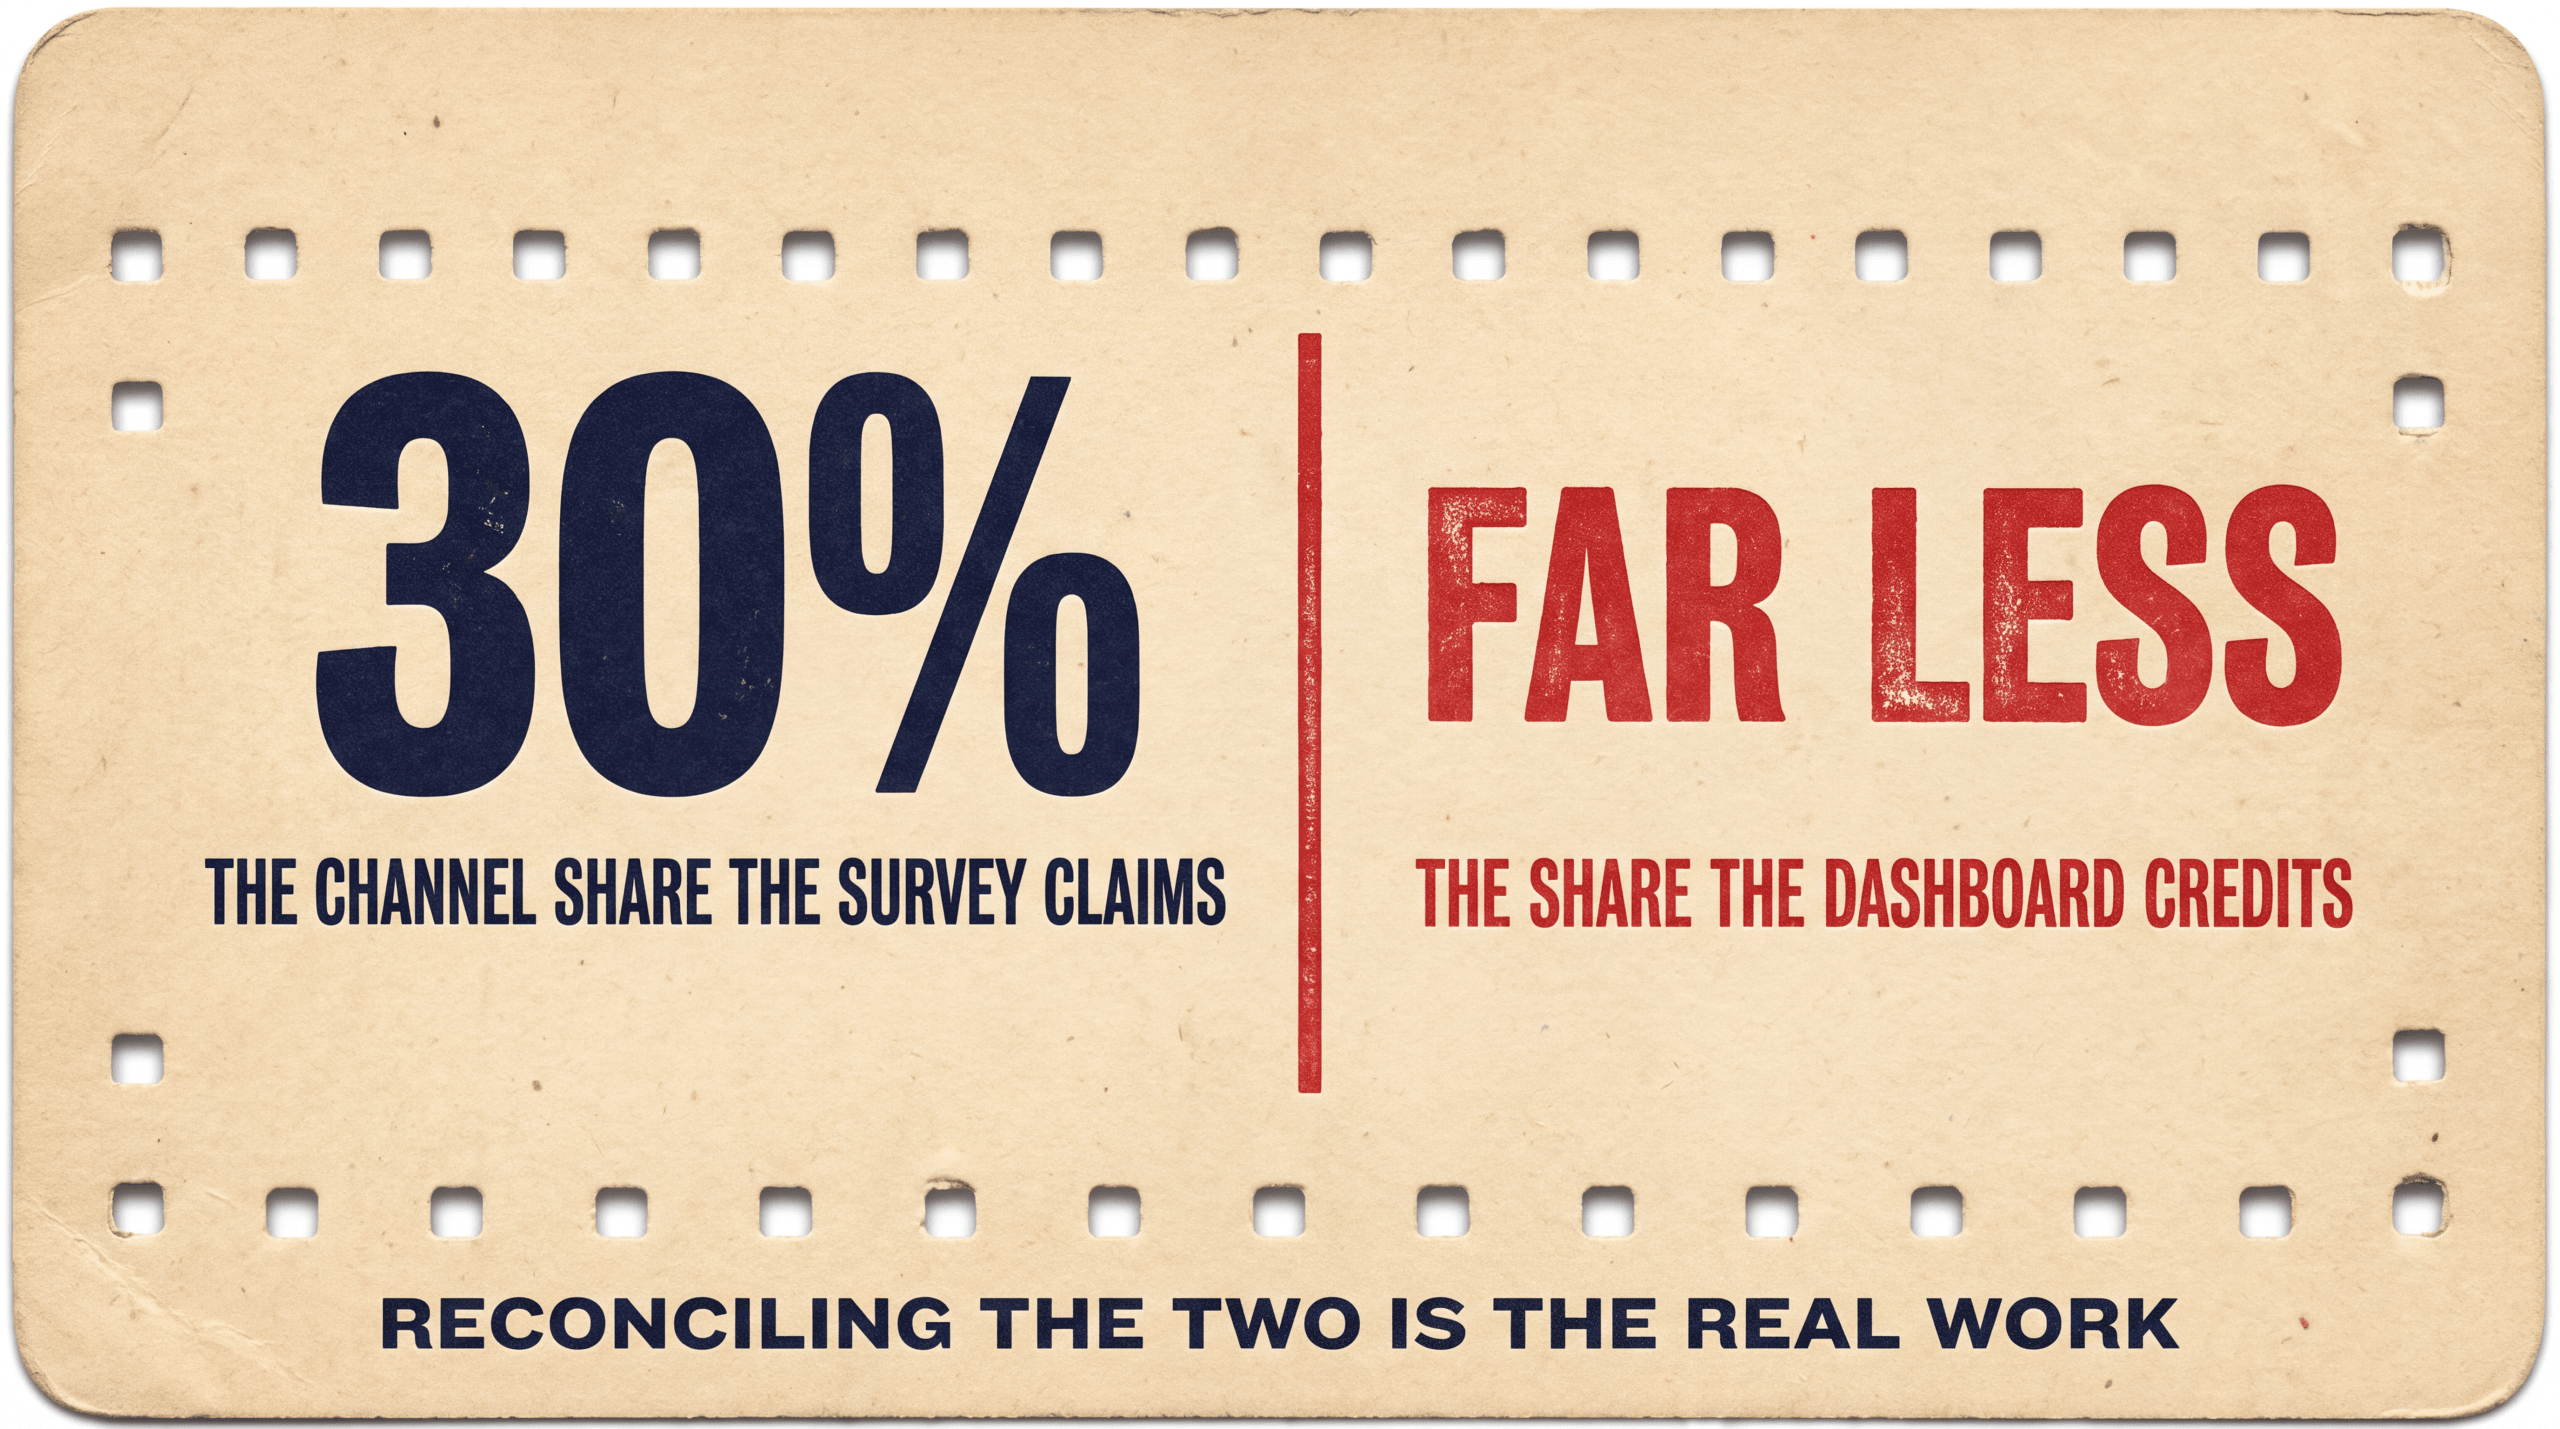
Disagreement between survey and tracked attribution is not a measurement failure. It is the information. The gap between the two views is the dark social estimate. Nobody else on the SERP teaches the reconciliation step, and the reconciliation step is the deliverable.
Here is a realistic disagreement I have seen across accounts. Run the diagnostic in this order.
The setup. The survey says 30 percent of customers first heard about you on TikTok. The tracked dashboard credits TikTok with 8 percent of revenue. The gap is 22 percentage points. The question is what to do with it.
Step 1: Define the scope. Survey credit and tracked credit are not the same denominator. Survey credit is “share of buyers who say they first heard about us on X.” Tracked credit is “share of revenue attributed to channel X after deduplication.” Same channel name, different math. Before you treat the gap as dark social, normalize the scope. Compare survey share of buyers to tracked share of buyers on the same channel, not revenue.
Step 2: Strip the iOS-invisible cohort. If 35 to 37 percent of iOS users opted in to tracking per Adjust Q2 2025, the rest are invisible to client-side measurement. A non-trivial slice of the 22-point gap is iOS attribution loss, not true dark social. Cross-reference the buyer mix by device and adjust.
Step 3: Check for click-free channels. Podcasts, organic social shoutouts, and word-of-mouth referrals will register on the survey side and produce zero events on the tracked side by structural design. If TikTok organic content (creator videos, not paid ads) is part of the channel mix, that share will show up in the survey and not in the tracked dashboard. The gap on that slice is correct, not broken.
Step 4: Run an incrementality test. If the channel is paid (TikTok ads, not organic), run a geo holdout or a time-on time-off test. The lift test will tell you whether the spend is moving conversions or whether the survey credit is recall bias inflating the channel. If the test shows no lift, the survey share is over-stating TikTok’s role.
Step 5: Update the dark social baseline. Whatever portion of the gap survives steps 2 through 4 is your dark social estimate for that channel. Write it down. Re-measure next quarter. Watch the trend, not the snapshot.
The reconciliation walk is the work no SERP result teaches. Every comparison article on this topic stops at “use both.” The actual operating skill is the disagreement resolution.
For the upstream click-vs-view problem this sits next to, see View-Through vs Click-Through Conversions.
When to Run Surveys: Cadence, Sample Size, Question Design
The vendor pitch is a multi-question post-purchase survey with branching logic and rich segmentation. The operator reality is that response rate falls off a cliff after the first question. A single well-designed question on every order is more useful than a six-question survey on 10 percent of orders. Coverage beats depth.
Cadence. Deploy on 100 percent of orders. Every order is a sample. Coverage is the difference between a directionally useful signal and a margin-of-error mess. Vendors that quote response-rate benchmarks above 50 percent are quoting their best customer cohorts. Expect 25 to 45 percent in practice across categories.
Sample size. Channel-level credit needs roughly 100 responses per channel per period to stabilize. For a DTC brand running 5 channels at 30 percent response rate on 1,000 monthly orders, that gives you 300 responses split across 5 channels, which means you cross the 100-per-channel threshold somewhere between monthly and quarterly review cycles. Plan the reporting cadence around that math, not the vendor’s monthly dashboard.
Question design. One question is best. “How did you hear about us.” Forced-choice with an “Other” field that captures open-ended text. List your real channels, not a generic checkbox menu. If you do not run podcast ads, do not list “podcast.” Forced-choice with a fictional option corrupts the data set. Update the channel list quarterly as the mix shifts.
Mobile-first. More than half of orders close on mobile. The survey input needs to be a single-tap select, not a multi-screen form. Drop-off on mobile surveys is 3 to 5 times higher than desktop when scrolling is required. The first question runs above the fold on a phone, or it does not run at all.
Sentiment add-on (optional). A second optional question on a separate page can capture sentiment (“Why did you choose us”) without sacrificing response rate on question one. Treat it as a bonus, not the primary signal.
For info-product cycles where the survey question shape needs to flex, see Info-Product Tracking.
When to Trust Tracked Data Over Self-Reports (And Vice Versa)
The trust hierarchy depends on the question, not the data quality. A high-quality survey is the wrong tool for an ad-level spend decision. A high-quality tracked dashboard is the wrong tool for a podcast channel discovery question. Match the tool to the decision.
Trust tracked data when:
- The decision is about spend allocation between paid channels you are already measuring
- The question is ad-level (which creative, which audience, which campaign)
- The cycle is short enough that recall accuracy decays before you collect the survey
- The channel has a click event you can reconcile through CAPI + UID
Trust survey data when:
- The decision is about a channel with no click event (podcasts, TV, offline, word-of-mouth)
- The question is brand-level (recall, sentiment, association)
- The cycle is long enough that the survey can run on representative volume
- The platform-side attribution is structurally blind (iOS opt-outs, third-party cookie deprecation)
Trust neither alone when:
- The channel is hybrid (paid TikTok plus organic TikTok creators, same brand handle)
- The buyer journey involves a device switch the pixel cannot bridge
- The platform reports view-through revenue that an incrementality test cannot confirm
- The survey response rate is below 20 percent and the cohort is not representative
There is one other case worth naming. When tracked attribution and platform-reported attribution disagree, trust tracked. When tracked attribution and a well-designed survey disagree, treat the gap as information, not as a winner-loser fight. The platform has a financial incentive to over-report. The survey has a structural bias to under-report paid channels. Both biases run in the same direction. Tracked attribution, run server-side with UID reconciliation, is the neutral arbiter on the paid-channel question.
For the conversion-side mechanics that drive tracked accuracy, see Server-Side Tracking.
The Combined Reporting Stack: Survey, Tracked, Reconciliation Loop
The deliverable is not “survey vs tracked.” The deliverable is the operating model that runs both in parallel and resolves their disagreements on a known cadence. Three cycles, three different jobs.
Weekly: tracked attribution review for spend decisions. Run the tracked dashboard every week. Look at channel ROAS, blended ROAS, and campaign-level performance. Decide what to scale, what to cut, what to test next week. This is the operational cycle. The survey does not show up here. Spend decisions move too fast for the survey response rate to keep up. The weekly cycle has its own settling problem worth knowing about. See why ROAS drops on weekends for the Sunday-morning backfill pattern that distorts week-over-week reads.
Monthly: survey cohort review for channel mix and discovery. Pull the previous month’s survey data. Look at share of buyers per channel. Compare to the tracked share of buyers on the same channels (not revenue, the apples-to-apples denominator). Flag gaps that exceed 10 percentage points. Decide what is structural (click-free channels), what is iOS attribution loss, and what needs an incrementality test next quarter.
Quarterly: reconciliation review to update dark social baseline. Run the full reconciliation walk on every channel where the survey and tracked shares disagreed in any of the three monthly reviews. Categorize each gap into iOS loss, click-free channel, recall bias, or true dark social. Write the new dark social baseline down. Adjust the channel mix decisions for next quarter accordingly.
This is the loop. Nobody on the SERP teaches it because every vendor needs to sell you one method or the other. The honest answer is that you need both, and the work that ties them together is the reconciliation step the vendor stack will not teach because it does not sell a product.
For the agency-side translation of this stack to non-technical clients, see How to Report Attribution to Non-Technical Clients.
FAQ
Should I trust the survey more than the pixel when they disagree?
Neither tool wins by default. The right answer depends on which question is on the table. For spend allocation between paid channels you already measure, trust tracked attribution because surveys have recall bias and lack ad-level granularity. For channels with no click event (podcasts, TV, organic word-of-mouth), trust the survey because tracked attribution is structurally blind to channels with no pixel chain. When both views disagree on a paid channel, run an incrementality test before assuming either side is right. The gap that survives the test is the dark social signal you should write down and re-measure next quarter.
Which post-purchase survey tool is cheapest to start with?
The cheapest start is a one-question survey on your existing order confirmation page. No vendor tool required. If you want vendor tooling for cohort analysis, dashboarding, and Klaviyo activation, Fairing, KnoCommerce, and Enquire are the three names that come up most often in DTC stacks as of mid-2026. Pricing tiers differ by order volume and shift quarterly, so check each vendor’s current pricing page directly, not a third-party listing. Start with the free or starter tier, prove the cadence works, then move up the tiers if the data is driving real channel decisions.
When is survey-only sufficient (no tracked attribution)?
Survey-only is sufficient for businesses where the channel mix is dominated by click-free channels (podcasts, TV, offline events, word-of-mouth referrals) and the paid digital share is small enough that ad-level optimization is not the primary lever. Local services, high-ticket coaching, and some info-product launches fit this profile in their early stage. Once paid digital spend crosses the threshold where weekly creative testing matters, survey-only is no longer enough. You need the tracked layer for the ad-level decisions.
When is tracked-only sufficient (no survey)?
Tracked-only is sufficient for businesses where the channel mix is fully measurable through pixel and CAPI events, no offline or organic-only channels contribute meaningful volume, and the question of dark social is not relevant to the decisions on the table. Pure performance marketing accounts that run only paid digital, with no podcasts and no organic social influence, can run tracked-only without missing meaningful signal. That profile is rarer than most operators assume. If any portion of your audience first hears about you outside a clickable surface, you have a blind spot a survey would fix.
How big is the dark social blind spot for most DTC brands?
The honest answer is “it depends on the category, and you do not know yours until you measure it.” Rand Fishkin and the SparkToro team have written extensively about dark social in marketing analytics, and the consistent finding is that the share of journeys influenced by untracked surfaces (Slack, Discord, Reddit DMs, WhatsApp groups, podcasts, offline conversations) is substantially larger than most marketing dashboards reflect. The way to size your own dark social baseline is to run the reconciliation walk in this article quarterly and watch the trend. The number will move. The trend is what matters for budget decisions.
Do I need both tools if I am running incrementality tests anyway?
Incrementality tests measure lift, not discovery. A geo holdout will tell you whether paid Meta drives incremental revenue versus a control, but it will not tell you that 22 percent of buyers say they first heard about you on a podcast you do not measure. The three tools (tracked attribution, surveys, incrementality tests) answer three different questions: where revenue lands, where buyers say they came from, and whether spend is causal. The reconciliation loop uses all three. Dropping any one of them creates a known blind spot.
Standalone Summary
Post-purchase surveys and tracked attribution are not competing methods. Surveys capture self-reported discovery for channels with no click event (podcasts, word-of-mouth, organic social, offline media). Tracked attribution captures click-to-conversion revenue at ad-level granularity, deduplicated across platforms via UID reconciliation. The two views disagree, and the gap between them is the dark social estimate. Use surveys for discovery questions and channel mix, use tracked data for spend optimization and ROAS decisions, and run a quarterly reconciliation loop that resolves disagreements into four categories (iOS attribution loss, click-free channels, recall bias, true dark social). The deliverable is the reconciliation cadence, not the choice of method. Hyros tracks $3.5 billion in revenue across more than 4,000 customers using server-side UID reconciliation, with CheckThat.ai’s 2026 review surfacing 29 to 33 percent more conversions versus native platform reporting across 601 reviewed implementations. The dashboard view is the artifact. The reconciliation loop is the deliverable.
Want a tracked attribution layer your survey data can actually reconcile against? → Book a demo
Related in This Series
Cluster: Attribution Fundamentals
- What Is Ad Attribution
- Multi-Touch Attribution
- Last-Touch Attribution
- Meta Ads Reporting and Attribution Accuracy
- View-Through vs Click-Through Conversions
- Server-Side Tracking
- Blended ROAS: Definition and Calculation
- How to Report Attribution to Non-Technical Clients
- Why ROAS Drops on Weekends (And What to Do About It)